Sample Category Title
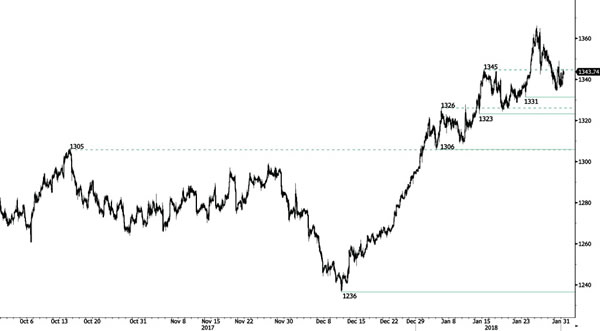
GOLD Declining
Gold is declining after strong increase initiated in 12/12/2017. Hourly support is at 1'331 (23/01/2018 low) while additional support is given at 1'323 (12/01/2018 low). Expected to show short-term upside moves.
In the long-term, the technical structure suggests that there is a growing upside momentum. A break of 1'392 (17/03/2014) is required to confirm it. A major support can be found at 1'045 (05/02/2010 low).
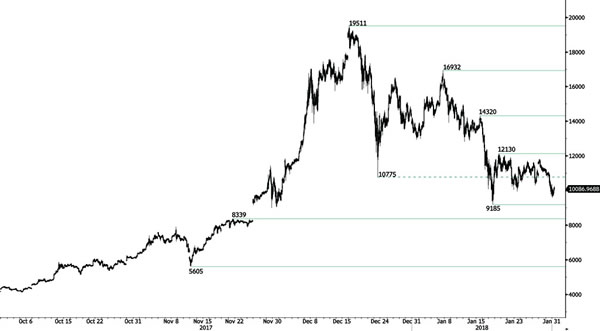
BITCOIN Descending
Bitcoin is trading lower. Hourly support is at 9'185 (17/01/2018 low) while resistance is located at 12'130 (18/01/2018 high). The short-term technical structure suggests further decline.
In the long-term, the digital currency has had an exponential growth but also presented important downturns. There is decent likelihood that the currency could stabilize between 9'000 - 12'000 in 2018. Bitcoin is trading far above its 200 DMA (5K+ gap).
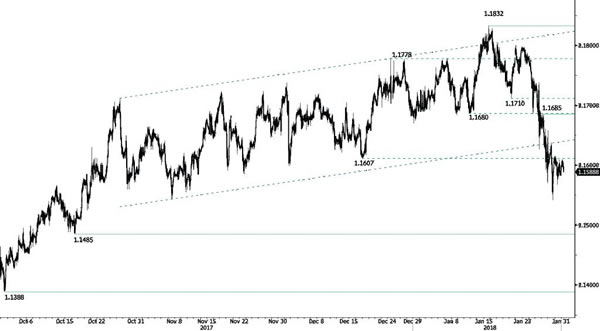
EUR/CHF Decrease
EUR/CHF is trading mixed. Hourly resistance given at 1.1685 (26/01/2018 high) is getting distanced. Expected to show further short-term downside moves.
In the longer term, the technical structure has reversed. Strong resistance is given at 1.20 (level before the unpeg). Yet, the ECB's slowing QE program is likely to cause buying pressures on the euro, which should weigh in favour of the EUR/CHF. Supports can be found at 1.0184 (28/01/2015 low) and 1.0082 (27/01/2015 low).
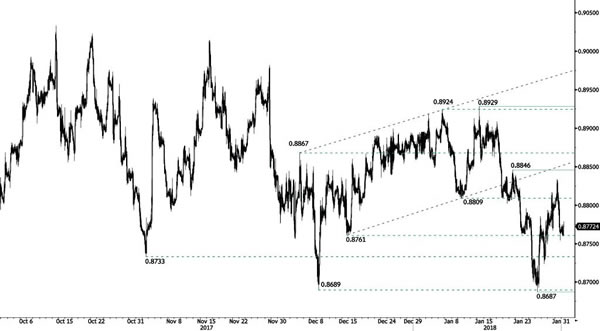
EUR/GBP Bouncing Downward
EUR/GBP is trading lower but is slowly rising back. Hourly support is given at 0.8687 (25/01/2018 low). The technical structure suggests further short-term strength.
In the long-term, the pair has largely recovered from lows in 2015. The technical structure suggests an upside momentum. The pair is trading below the range of its 200 DMA. Strong resistance can be found at 0.9500 (psychological level).
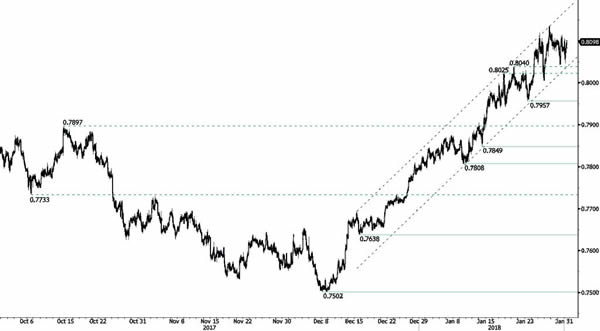
AUD/USD Targeting Resistance At 0.8134
AUD/USD's upside pressures are growing back. Hourly resistance given at a distance of 0.8134 (26/01/2018 high). Support stands at 0.7957 (23/01/2018 low). The road is wide open for further upside.
In the long-term, the trend is turning positive. Key support stands at 0.6009 (31/10/2008 low). A break of the key resistance at 0.8164 (14/05/2015 high) is needed to invalidate our long-term bearish view (drawing near).
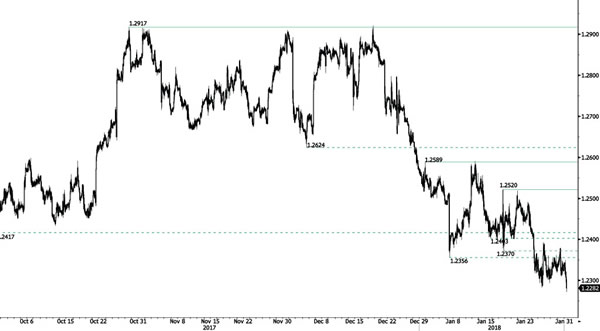
USD/CAD Skewed To The Downside
USD/CAD keeps on weakening. Hourly resistance is given at 1.2520 (17/01/2018 high) while further resistance given at 1.2589 (01/01/2018) is momentarily out of reach. The technical structure indicates that additional weakness is achievable.
In the longer term, the pair is trading between resistance point at 1.3805 (05/05/2017 high) and support at 1.2128 (18/06/2015 low). Strong resistance is given at 1.4690 (22/01/2016 high). The pair is likely to head lower. The pairs is trading below 200 DMA
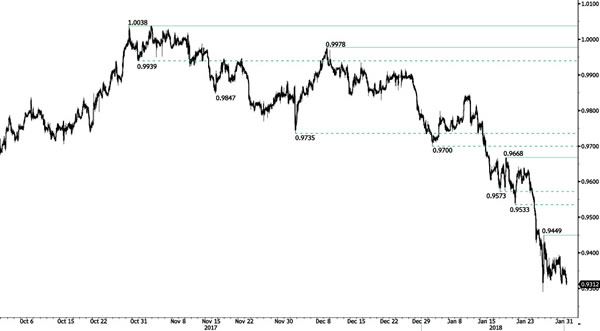
USD/CHF Bearish Breakout
USD/CHF is decreasing. The technical structure indicates that further weakness is likely. Hourly resistance is at 0.9449 (25/01/2018 high). Expected to show further short-term downside move.
In the long-term, the pair is still trading in range since 2011 despite some turmoil when the SNB unpegged the CHF. Support at 0.9259 (24/08/2015 low) is attainable. Key support remains at 0.9072 (07/05/2015 low) while resistance at 1.0344 (15/12/2016 high) is distanced. The technical structure favours a long term bullish bias since the unpeg in January 2015.
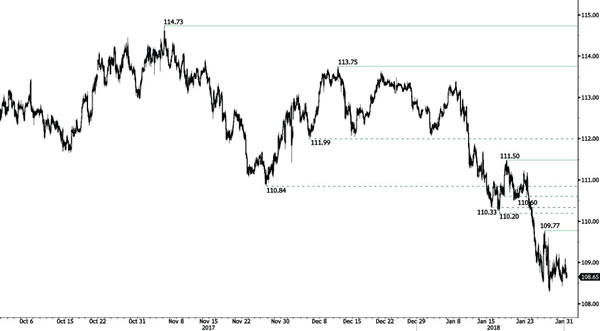
USD/JPY Sideways Trading
USD/JPY is trading below 109. A bearish breakout is achievable. Hourly resistance is at 109.77 (26/01/2018 high). The technical structure suggests further short-term downside moves.
We favor a long-term bearish bias. Support is now given at 107.32 (08/09/2017 low). A gradual rise towards the major resistance at 125.86 (05/06/2015 high) seems unlikely. Expected to decline further support at 101.20 (09/11/2016 low).
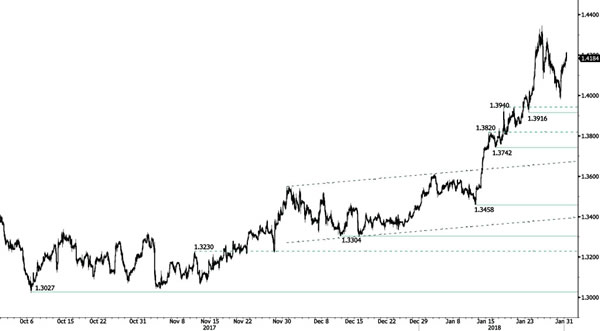
GBP/USD Taking Off
GBP/USD is trading up. The technical structure suggests further potential upside move. Hourly support is given at 1.3916 (23/01/2018 low).
The long-term technical pattern is reversing. The Brexit vote had paved the way for further decline but the pair is now moving up to 2016 highs. A long-term support given at 1.1841 (07/10/2017 low) and a strong resistance at 1.5018 (24/06/2016 high) are identified.
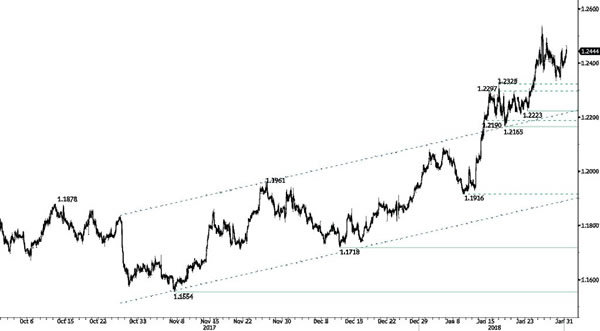
EUR/USD Rebouncing
EUR/USD is progressing. The pair is now retracing and lies well above 1.2325 (17/01/2018 high). Hourly support is given at 1.2223 (23/01/2018 low). The technical structure suggests further short-term upside moves.
In the longer term, the momentum is turning largely positive. We favor a continued bullish bias. Key resistance is holding at 1.2856 (15/10/2014 high) while strong support lies at 1.1554 (08/11/2017 low).