Sample Category Title
Will US Rates Finally Lift The Greenback?
FOMC: wait until March
Its widely expected that the FOMC will hold policy steady and signal that the next likely interest rate hike will come in March. Therefore, the focus will be on the language around the meeting. Today’s statement, in our view, will acknowledge that inflation risk have shifted upwards but no material change. We could see a shift from characterizing the economic outlook from “"Near-term risks to the economic outlook appear roughly balanced, but the Committee is monitoring inflation developments closely."” to just “balanced” give the quality of upwards data surprises. However, dragging expectation is the fact that inflation pressure remains subdued, allowing the fed to keep their options open. Inflation on a rolling 3 month average continues to print below the FOMC’s target of 2% while December’s core CPI data suggest trend inflation firming below the feds started goal. Markets continue to discount a hawkish fed, which could catch the ultra-short USD positioning flat-footed. US-G10 yield spread have absolutely blown out; increase our concern for a near term USD correction. Given the stretched nature of US-German spreads we see EURUSD as the most vulnerable to a pullback.
US stock markets down two days in a row
US stocks had a poor performance during the last two days, with a performance of -1.43% for Nikkei 225, -1.37% for Dow Jones and -1.09% for S&P500. This strong decrease is essentially correlated with rising oil production, announcements of health care competition on the US market and particularly worries that concern the ascending US treasuries U-curves. The decline was broad-based but particularly impacted (based on DJIA): Healthcare (-2.86%), Energy (-2.07%), Consumer Discretionary (-1.79%) and Information Technology (-1.30%).
With a +2.71% on the 10 years US Treasury notes (+0.66% since July 9th 2017) and +2.11% on the 2 year (+0.84% since July 9th 2017), the highest rate level since March 31st 2014, many investors and fund managers who rather look for income-based earnings have decided to trade up for a less volatile and risk-free investment, diminishing their equity exposure in the portfolio. 10 year US treasury and Bund differentials are now at +2.02% while UST and Japan lies at +2.6125.
USD is not following the trend and continues its depreciation against major currencies since January 9th 2018: EUR/USD +058%, GBP/USD +0.87%, JPY/USD +0.27%, USD/CHF -0.62%.
Though many investors tend to say that equity and commodity asset classes are going to suffer in the coming periods due to increasing attractiveness of Government bonds, we remain unconvinced that this will push out other investors than income-seeking bondholders or similar outside of equities for instance. We think that a more dovish Fed in 2018 will support risk, equities, commodities and US Treasury notes purchases.
EUR/JPY V Shaped Reversal For Uptrend Continuation
The EUR/JPY has made a V-shaped reversal pattern close to W L4, and at this point, we see a bullish impulse slightly above W H1 and H2 camarilla pivots. 132.15-25 is the POC zone where we could see a bounce towards W L3 -135.47. MACD also turned bullish. 4h close above W L3 suggest 135.94 as a potential target for the move. If 136.30 is broken in upcoming days, we might even see 136.74 as a continuation move.
W H1 -. Weekly Camarilla Pivot (Interim resistance - Weak)
W H2 - Weekly Camarilla Pivot (Weekly resistance)
W H3 - Weekly Camarilla Pivot (Weekly resistance - main)
W H4 - Weekly Camarilla Pivot (Strong Weekly Resistance)
W L4 - Weekly Camarilla Pivot (Interim support - Strong)
W L3 – Weekly Camarilla Pivot (Interim support - Main)
W L2 – Weekly Camarilla Pivot (Interim support)
W L1 - Weekly Camarilla Pivot (Interim support - Weak)
POC - Point Of Confluence (The zone where we expect price to react aka entry zone)
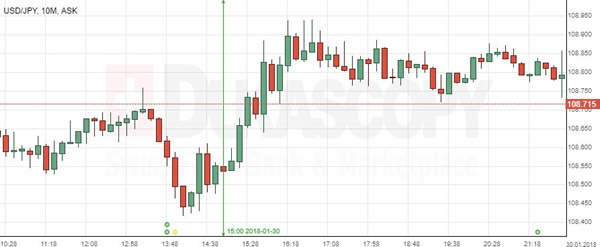
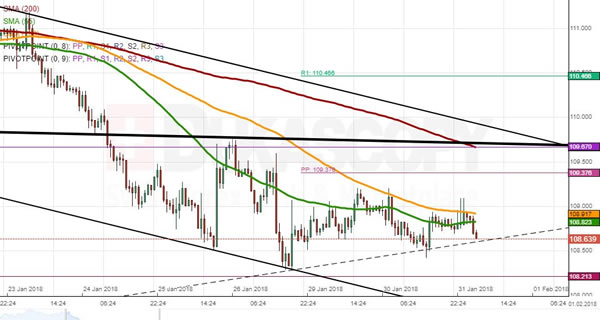
Technical Outlook: USDJPY – Narrow Consolidation To Precede Fresh Downside While Falling 10SMA Caps
The pair is holding in extended consolidation above 108.50 zone where strong bids temporarily halted bears.
Limited upside attempts signal that overall bears remain firmly in play for final push through 108.50/00 pivots towards key support at 107.31 (08 Sep low).
Congestion tops at 109.20 mark initial resistance ahead of more significant falling 10 SMA (109.67) and psychological 110.00 barrier, violation of which would sideline immediate bears and signal stronger correction of 113.38/108.28 bear-leg.
Res: 109.20, 109.67, 110.00, 110.23
Sup: 108.50, 108.28, 107.83, 107.31
Forex Technical Analysis: EUR/USD, USD/JPY, GBP/USD
EUR/USD
Current level - 1.2434
The climb above 1.2390 signals a reversal of the bearish bias since 1.2540 as market participants are getting ready for today's FOMC meeting. The intraday bias is positive above 1.2390, for another upswing towards 1.2540.
| Resistance | Support | ||
| intraday | intraweek | intraday | intraweek |
| 1.2460 | 1.2540 | 1.2390 | 1.2330 |
| 1.2540 | 1.2870 | 1.2330 | 1.2220 |

USD/JPY
Current level - 108.71
The overall bias remains bearish, for a violation of 108.25 low, towards 107.30 zone. Initial intraday resistance lies at 109.20.
| Resistance | Support | ||
| intraday | intraweek | intraday | intraweek |
| 109.20 | 110.20 | 108.25 | 108.50 |
| 110.20 | 112.00 | 108.25 | 107.30 |

GBP/USD
Current level - 1.4185
The break through 1.4090 signals a reversal of the whole slide from 1.4340 peak and the intraday bias is positive above the mentioned support, for a rise towards the previous high.
| Resistance | Support | ||
| intraday | intraweek | intraday | intraweek |
| 1.4215 | 1.4340 | 1.4090 | 1.3910 |
| 1.4340 | 1.4730 | 1.3985 | 1.3730 |

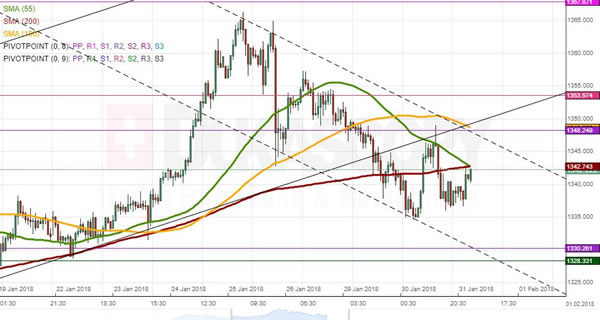
XAUUSD Analysis: Re-Tests 55-Hour SMA
Even though the yellow metal managed to shoot up during the first half of Tuesday, the combined resistance of the 55-hour SMA, the weekly PP and the bottom boundary of the breached two-month channel up proved to be an unbreakable barrier which sent the pair down to 1,336.80. The rate has since returned back to the 55-hour SMA which is now likewise reinforced by the 200-hour SMA. The pair should edge slightly higher in this session towards the prevailing short-term channel down circa 1,345.00. The upside target in this case could be the weekly PP and the 100-hour SMA near 1,348.30. By and large, several noteworthy fundamentals which could shake the market are to be released today. In case of a negative surprise, Gold should be supported by the weekly S1 and the monthly R2 at 1,329.00.
USDJPY Analysis: Fails To Move Above 109.00
USD/JPY has remained steady for the last three trading sessions. The main reason has been the pair’s inability to breach the strong support of the 55– and 100-hour SMAs that were located slightly below 109.00 at the time of the analysis. The overall trend, however, has been slightly upwards, as shows by the dashed line. Given that the Greenback still remains weak against the Yen, bulls might fail to breach the 109.00 area, at least during the first part of the day. This situation could change later in the session when several noteworthy fundamentals are released. A positive outcome should not exceed the 200-hour SMA at 109.67, while the opposite scenario might bring further decline for the US Dollar down to the 108.00 mark or the distant weekly S1 at 107.53.
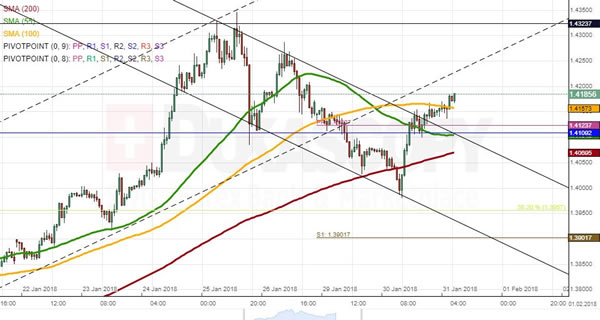
GBP/USD Analysis: Recovers Previous Losses
Upside risks prevailed in the market on Tuesday, thus allowing GBP/USD to end the session with a 74-pip advance. The pair experienced a brief period of consolidation after breaching the 55-hour SMA and the weekly PP, but eventually managed to dash through the 100-hour moving average, as well. In accordance with technical indicators, there is still some upside potential that could push the rate towards the 1.4250 mark where the bottom boundary of the breached four-week channel is located. However, their high positioning suggests that this expected movement up is unlikely to be sustainable for the whole session. Meanwhile, the southern barrier is guarded by several noteworthy support levels. In case no fundamentals breach this area, the Pound should remain trading near 1.4150 by Wednesday morning.
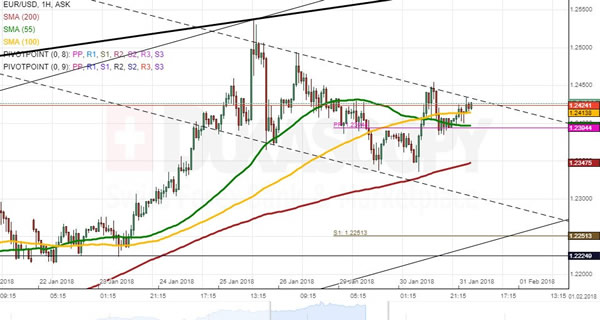
EUR/USD Analysis: At Crossroads
EUR/USD spent the Tuesday morning in between the bounds of the 100– and 200-hour SMAs. A subsequent surge apparent mid-session allowed for a breakout of the former, the 55-hour moving average, the weekly PP and the monthly S2 in the 1.2400/45 area. At that point, the Euro lost its upside momentum and thus remained fluctuating within this territory. This trading day might mark another surge, as shown by technical indicators. This scenario is rather realistic, considering that the southern side is now protected by several notable barriers; meanwhile, the nearest resistance is formed by the distant weekly R1 at 1.2575. On the other hand, the pair has lost momentum up near the monthly S2. This factor might likewise be an early indication of a fall that should halt at the 200-hour SMA circa 1.2340.
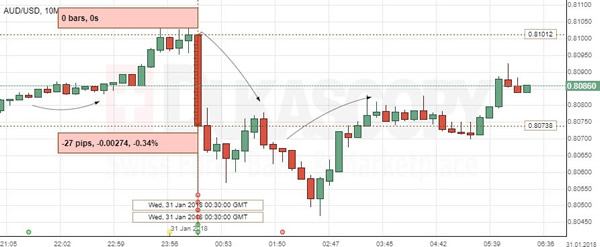
AUD/USD: Australian Consumer Price Index
The Aussie fell against the US Dollar in a wake of the quarterly report on Australia’s consumer price data. The AUD/USD exchange rate slipped 0.34% or 27 base points to the 0.8073 mark.
Australian consumer inflation remained subdued in the December quarter, as the core CPI annual growth was below the Bank’s target for the second year in a row, fuelling investors’ expectations for a rate hike anytime soon. The Australian Bureau of Statistics reported that the country’s CPI grew 0.6% in the Q4, while annual growth pace was registered at 1.9%. Higher prices of petrol, tobacco and fruit contributed most to expansion, while the main headwind was pay growth, which weakened to historical lows even with a strong employment.
USD/JPY: CB Consumer Confidence
The USD/JPY currency pair ignored stronger-than-anticipated CB consumer confidence report. The Greenback fell slightly against the Yen, but continued trading session higher, in the 108.75 area.
The US consumer confidence strengthened over the course of January, while house prices rose further in November, indicating that a recent consumer spending acceleration was set to be steady despite a sluggish pay growth. The Conference Board stated that the consumer confidence index rose to 125.4 in January, suggesting stronger spending in the beginning of the year. However, consumers were less optimistic in the current conditions’ evaluation, while being more ambivalent concerning income prospects.