Sample Category Title
USD/CAD Daily Outlook
Daily Pivots: (S1) 1.2310; (P) 1.2335; (R1) 1.2363; More...
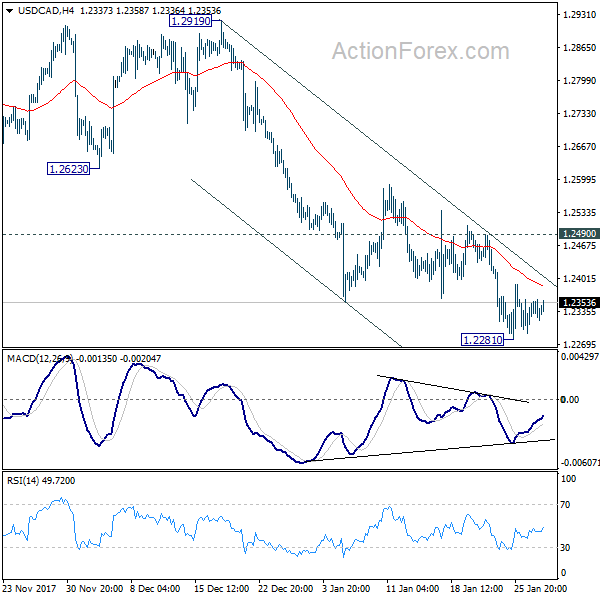
USD/CAD's consolidation from 1.2281 temporary low is still unfolding and intraday bias remains neutral. As long as 1.2490 resistance holds, near term outlook stays bearish and deeper decline is expected. On the downside, break of 1.2281 will extend the decline from 1.2919 and target a test on 1.2061 low. However, considering bullish convergence condition in 4 hour MACD, break of 1.2490 will indicate short term bottoming and bring stronger rebound.
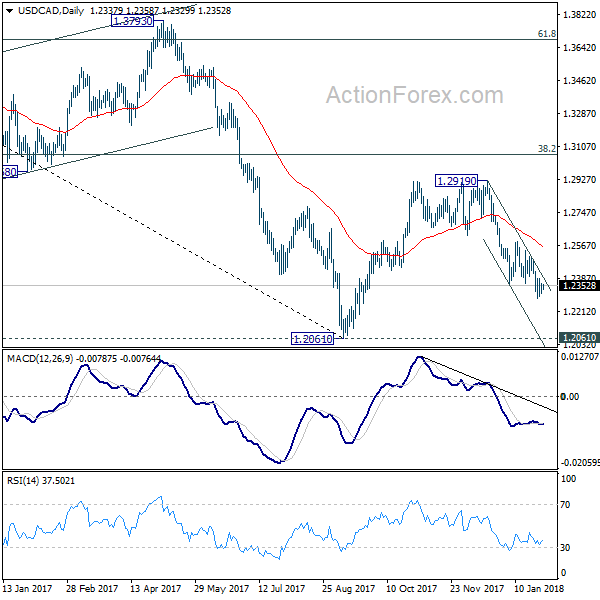
In the bigger picture, rebound from 1.2061 is likely completed completed at 1.2919, rejected by 55 week EMA and kept below 38.2% retracement of 1.4689 to 1.2061 at 1.3065. The development also suggests that long term fall from 1.4689 is not completed yet. Decisive break of 1.2061 low will target 61.8% retracement of 0.9406 to 1.4689 at 1.1424. This will now be the favored case as long as 1.2919 resistance holds.
USD/JPY Daily Outlook
Daily Pivots: (S1) 108.57; (P) 108.88; (R1) 109.27; More...
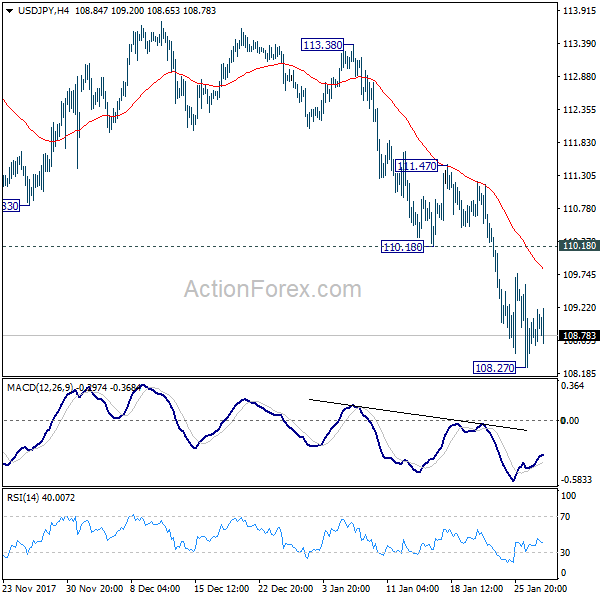
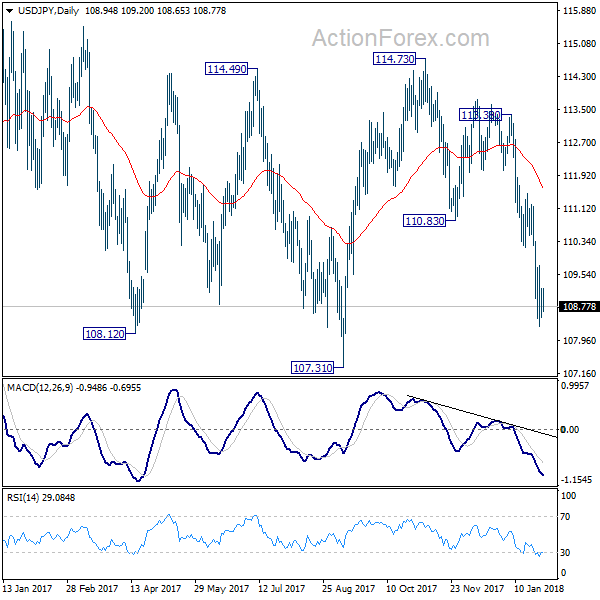
Intraday bias in USD/JPY remains neutral for consolidation above 108.27 temporary low. As long as 110.18 resistance holds, deeper decline is expected. On the downside, break of 108.27 will extend recent fall through 107.31 support to next fibonacci support at 106.48. Nonetheless, break of 110.18 will be the first sign of near term reversal and will turn bias back to the upside for 111.47 resistance.
In the bigger picture, current development argues that the corrective pattern from 118.65 is extending. There is risk of dropping further to 61.8% retracement of 98.97 to 118.65 at 106.48. But this level should provide strong support to contain downside and bring resumption of rise from 98.97. However, sustained break of 106.48 will now likely send USD/JPY through 98.97 to resume the corrective fall from 125.85 (2015 high).
USD/CHF Daily Outlook
Daily Pivots: (S1) 0.9335; (P) 0.9361; (R1) 0.9401; More...
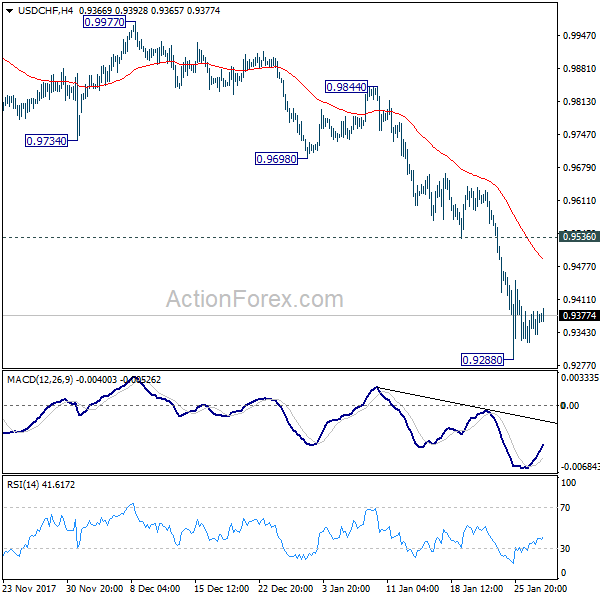
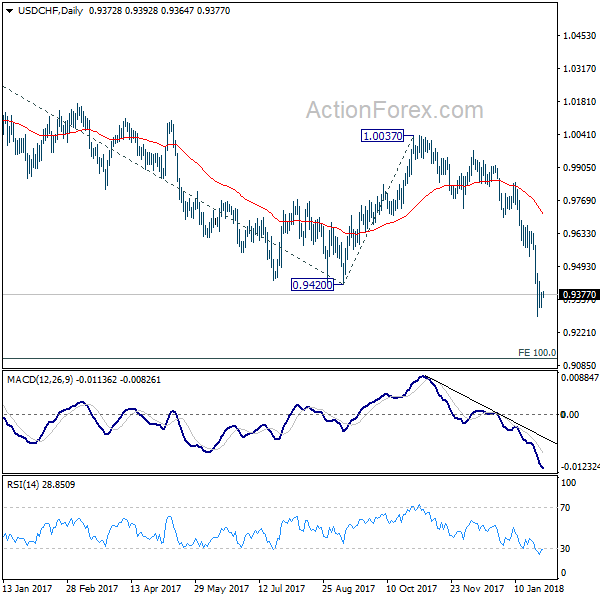
Intraday bias in USD/CHF remains neutral as consolidation from 0.9288 is extending. Near term outlook will remain bearish as long as 0.9536 support turned resistance holds. Break of 0.9288 will resume the larger down trend and target next key fibonacci level at 0.9115.
In the bigger picture, the strong break of 0.9420 support suggests that fall from 1.0342 is developing into a medium term down trend. Deeper fall should be seen to 100% projection of 1.0342 to 0.9420 from 1.0037 at 0.9115. Break will target 161.8% projection at 08545. In any case, break of 0.9640 resistance is needed to be the first sign of medium term bottoming. Otherwise, outlook will stay bearish even in case of strong rebound.
EUR/USD Daily Outlook
Daily Pivots: (S1) 1.2335; (P) 1.2383 (R1) 1.2431; More....
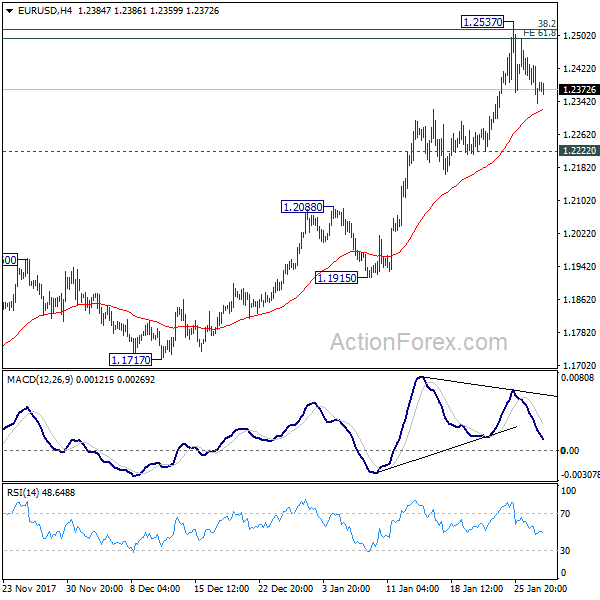
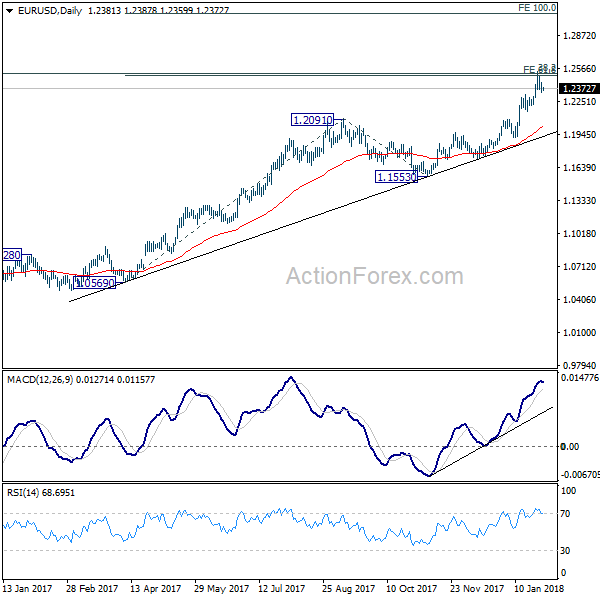
EUR/USD's consolidation from 1.2537 is still in progress and intraday bias remains neutral. As long as 1.2222 support holds, near term outlook remains bullish. On the upside, sustained break of 1.2494/2516 resistance zone will extend recent rally to 100% projection of 1.0569 to 1.2091 from 1.1553 at 1.3075 next. However, break of 1.2222 will indicate rejection from 1.2494/2516, on bearish divergence condition in 4 hour MACD, and turn near term outlook bearish for 1.1915 support first.
In the bigger picture, rise from 1.0339 medium term bottom is still seen as a corrective move for the moment. But key fibonacci level at 38.2% retracement of 1.6039 (2008 high) to 1.0339 (2017 low) at 1.2516 is looking vulnerable. Sustained break of 1.2516 will carry larger bullish implication and target 61.8% retracement of 1.6039 to 1.0339 at 1.3862. Nonetheless, rejection from 1.2516 will maintain long term bearish outlook and keep the case for retesting 1.0039 alive.
AUD/USD In Slow And Steady Uptrend
Key Highlights
- The Aussie Dollar moved higher this past week and broke the 0.8000 resistance against the US Dollar.
- There is a crucial ascending channel forming with current support at 0.8060 on the 4-hours chart of AUD/USD.
- The pair may continue to rise as long as it is above the 0.8000 support level.
- The US Personal Income rose 0.4% in Dec 2017, more than the forecast of +0.3%.
AUD/USD Technical Analysis
The Aussie Dollar made a nice upside move during the past few days and settled above 0.8000 against the US Dollar. The AUD/USD pair is now in a solid uptrend with supports at 0.8060 and 0.8000.
The 4-hours chart of AUD/USD clearly points to a major uptrend from the 0.7600 swing low. The pair climbed higher and broke many resistances such as 0.7800, 0.7880, 0.7900 and 0.8000.
The upside move was very strong as buyers were able to push the pair above the 0.8100 level. A new year high was formed at 0.8135 from where a downside correction was initiated. It broke the 23.6% Fib retracement level of the last wave from the 0.8004 low to 0.8135 high.
Looking at the chart, it seems like there is a crucial ascending channel forming with current support at 0.8060. On the downside, an initial support is around the 50% Fib retracement level of the last wave from the 0.8004 low to 0.8135 high at 0.8070.
Therefore, a strong support is forming around 0.8060-0.8070. Below the mentioned 0.8060, the pair may test the 0.8000 handle, which is the most important support and a buy zone.
On the upside, an initial hurdle for buyers is at 0.8135-40. Above 0.8140, the pair may accelerate towards the 0.8200 level. The overall price structure is bullish as long as AUD/USD is above 0.8000.
In general, the recent rise in AUD/USD is linked to the US Dollar weakness. Other major pairs such as EUR/USD and GBP/USD also gained heavily. However, there are now signs of trend exhaustion and traders need to be careful chasing this rally going forward.
GBP/USD Daily Outlook
Daily Pivots: (S1) 1.4015; (P) 1.4086; (R1) 1.4148; More.....
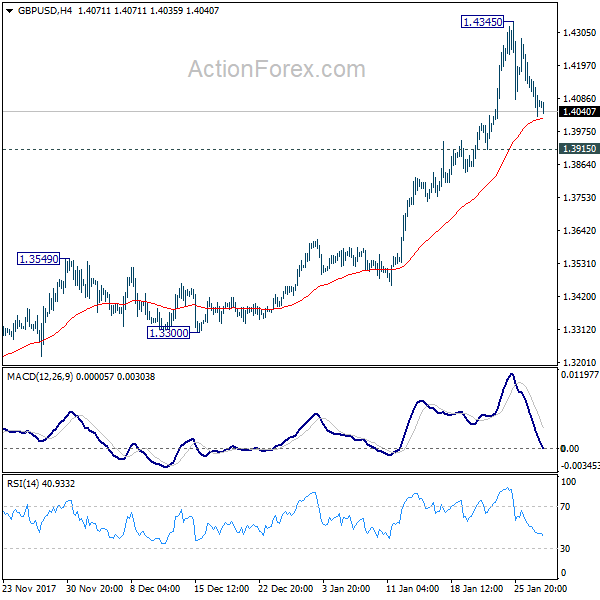
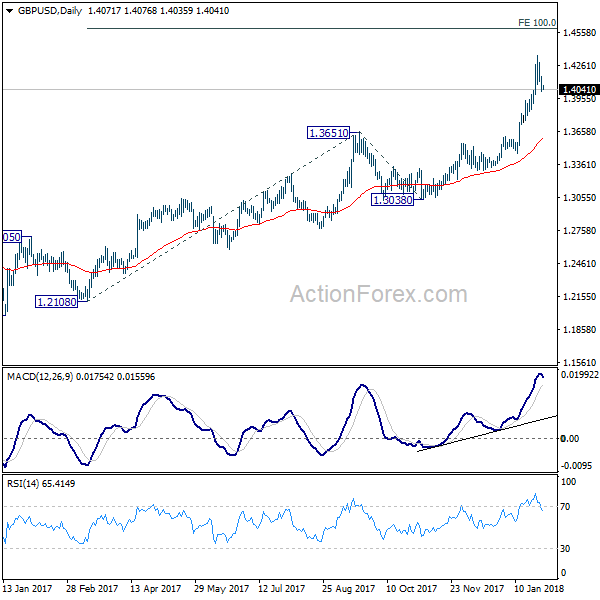
GBP/USD dips to as low as 1.4024 so far as retreat from 1.4345 extends. Intraday bias remains neutral as corrective trading would extend. But downside should be contained by 1.3915 support to bring rally resumption. On the upside, break of 1.4345 will resume medium term up trend to 100% projection of 1.2108 to 1.3651 from 1.3038 at 1.4581 next. However, break of 1.3915 will argue that, at least, deeper pull back in underway to 1.3651 resistance turned support.
In the bigger picture, sustained break of 1.3835 key resistance level indicates that rebound from 1.1946 is at least correcting the long term down from from 2007 high at 2.1161. Further rise should now be seen back to 38.2% retracement of 2.1161 (2007 high) to 1.1946 (2016 low) at 1.5466. Medium term outlook will stay bullish as long as 1.3038 support holds, in case of pull back.
Dollar Following Yields Higher Temporarily, Sterling Pullback in Progress
Dollar recovered overnight with the help of surging treasury yields. 10 year yield hit as high as 2.725 before paring gains to close at 2.696, up 0.034. That's also the highest level since April 2014. Nonetheless, the lift to the greenback would likely be temporary as Dollar and yields would likely go back to the "decoupled" relationship fairly quickly. British pound is trading as the weakest for the week. Renewed Brexit uncertainty is seen as a factor weighing on Sterling. But it's actually more about returning to reality after last week's utopic rally. For today, New Zealand Dollar is trading mildly higher after trade balance data.
Technically, weekly MACD suggests that 10 year yield is picking up momentum. TNX is on course for 61.8% projection of 1.336 to 2.621 from 2.034 at 2.827. The key resistance level, nonetheless, lies in 2013 high at 3.036.
Australia: Perplexing gap between business conditions and confidence narrowed
Australia NAB business conditions rose to 13 in December, up from 12 but missed expectation of 15. Nonetheless, that' still way above long run average of 5. Business confidence rose to 11, up from 7 but also missed expectation of 12. That's the highest reading since July. The strong bounce in confidence reading "helped to narrow the perplexing gap between business conditions and confidence evident over the past couple of years, and is an encouraging signal for investment," noted NAB group chief economist Alan Oster.
However, retail remained pressured at negative conditions at -2. Oster noted that "final retail prices also weakened sharply in December into negative territory, and are running at a slower rate than labour costs and purchases costs, pointing to margin compression." And the fall in prices is seen as a downside risk to Q4 CPI report due tomorrow.
New Zealand imports and exports hit records in 2017
New Zealand trade balance came in at strong surplus at NZD 640m in December, versus expectation of NZD -125m deficit. Exports surged 26% yoy to NZD 5.55b in the month while imports rose 11% to NZD 4.91b. Over the year, total exports hit NZD 53.7b in 2017, up 11% on 2016 and hit a new record. Imports also rose to NZD 56.5b, up 9.4% on 2016, and hit a record too. Exports to China jumped a strong 27% in 2017, hitting close to NZD 12b. Exports to Australia, however, grew a mere 6.5% to NZD 8.8b.
Abe's advisor Hamada: BoJ Governor should follow Abenomics
In Japan, an economic adviser to Prime Minister Shinzo Abe said the BoJ should stick with so called "Abenomics" no matter who the next Governor is. Koichi Hamada, an emeritus professor of economics at Yale University said that the next BoJ Governor should have "boldness and experience". He emphasized that "Abenomics is managed excellently by the BOJ policy. If you are winning in a sport, you don't change the strategy." For the moment, there is no decision on whether Haruhiko Kuroda would be given another term. Hamada commented that "there are many excellent people working at the BOJ and their morale will be reduced if someone outside of the central bank becomes governor so often, though I don't know if a BOJ official will become next governor this time."
Released from Japan, retails ales rose 3.6% yoy in December, household spending dropped -0.1% yoy. Unemployment rate rose to 2.8%.
Looking ahead
Eurozone GDP is a key focus in European session while confidence indicators will also be featured. Germany CPI is another data to watch. Swiss will release trade balance, KOF. UK will release mortgage approvals and M4. Later in the day, focus will be on US consumer confidence.
GBP/USD Daily Outlook
Daily Pivots: (S1) 1.4015; (P) 1.4086; (R1) 1.4148; More.....
GBP/USD dips to as low as 1.4024 so far as retreat from 1.4345 extends. Intraday bias remains neutral as corrective trading would extend. But downside should be contained by 1.3915 support to bring rally resumption. On the upside, break of 1.4345 will resume medium term up trend to 100% projection of 1.2108 to 1.3651 from 1.3038 at 1.4581 next. However, break of 1.3915 will argue that, at least, deeper pull back in underway to 1.3651 resistance turned support.
In the bigger picture, sustained break of 1.3835 key resistance level indicates that rebound from 1.1946 is at least correcting the long term down from from 2007 high at 2.1161. Further rise should now be seen back to 38.2% retracement of 2.1161 (2007 high) to 1.1946 (2016 low) at 1.5466. Medium term outlook will stay bullish as long as 1.3038 support holds, in case of pull back.
Economic Indicators Update
| GMT | Ccy | Events | Actual | Forecast | Previous | Revised |
|---|---|---|---|---|---|---|
| 21:45 | NZD | Trade Balance Dec | 640M | -125M | -1193M | -1233M |
| 23:30 | JPY | Jobless Rate Dec | 2.80% | 2.70% | 2.70% | |
| 23:30 | JPY | Household Spending Y/Y Dec | -0.10% | 1.50% | 1.70% | |
| 23:50 | JPY | Retail Trade Y/Y Dec | 3.60% | 2.10% | 2.20% | 2.10% |
| 0:30 | AUD | NAB Business Conditions Dec | 13 | 15 | 12 | |
| 0:30 | AUD | NAB Business Confidence Dec | 11 | 12 | 6 | 7 |
| 6:30 | EUR | French GDP Q/Q Q4 A | 0.60% | 0.60% | ||
| 7:00 | CHF | Trade Balance (CHF) Dec | 2.54B | 2.63B | ||
| 8:00 | CHF | KOF Leading Indicator Jan | 110.8 | 111.3 | ||
| 9:30 | GBP | Mortgage Approvals Dec | 63.5k | 65.1k | ||
| 9:30 | GBP | Money Supply M4 M/M Dec | 0.20% | 0.10% | ||
| 10:00 | EUR | Eurozone Business Climate Indicator Jan | 1.68 | 1.66 | ||
| 10:00 | EUR | Eurozone Economic Confidence Jan | 116.2 | 116 | ||
| 10:00 | EUR | Eurozone Industrial Confidence Jan | 8.9 | 9.1 | ||
| 10:00 | EUR | Eurozone Services Confidence Jan | 18.5 | 18.4 | ||
| 10:00 | EUR | Eurozone Consumer Confidence Jan F | 1.3 | 1.3 | ||
| 10:00 | EUR | Eurozone GDP Q/Q Q4 A | 0.60% | 0.60% | ||
| 13:00 | EUR | German CPI M/M Jan P | -0.60% | 0.60% | ||
| 13:00 | EUR | German CPI Y/Y Jan P | 1.70% | 1.70% | ||
| 14:00 | USD | S&P/Case-Shiller Composite-20 Y/Y Nov | 6.30% | 6.40% | ||
| 15:00 | USD | Consumer Confidence Jan | 123 | 122.1 |
Market Morning Briefing: Euro Could Find Immediate Support Near 1.24 On The Daily Candles For Now
STOCKS
Overall stock indices are mixed with the Nifty, Sensex and Dow looking bullish while Nikkei and Dax have come off slightly.
Dow (26439.48, -0.67%) is in a strong upward rally and we do not find any immediate resistance to limit further upside. The index looks bullish for the coming sessions.
Dax (13324.48, -0.12%) came off a bit towards 13300. While below 13400, it may test 13200 or lower on the downside for the coming sessions.
Nikkei (23477.26, -0.64%) is down from levels near 23700. Downside is open towards 23250-23000 for the near to medium term from where a bounce back towards current levels is possible.
Shanghai (3517.71, -0.15%) has come down to test interim support near 3500 and while that holds, another upleg is possible in the coming sessions. Else, the index if dips below 3500 could extend its fall further towards 3475-3450 levels.
Nifty (11130.40, +0.55%) and Sensex (36283.25, +0.65%) rose up yesterday also and could possibly be in the last leg of the rally that started In Dec’17 from levels near 10020. A few more sessions of upside is possible before the index pauses.
COMMODITIES
Strength in the US Dollar brings a pause to the rising commodity prices. While the Dollar strengthens, a short dip in commodities, especially Cruse and Gold is possible in the near term.
Brent (69.19) and WTI (65.17) have both come off a bit as expected and the fall may extend towards 68 and 65 respectively in the coming sessions. Need to see if support at 65 holds on WTI or if the price manages to break below 65 in the near term.
Gold (1335.88) has broken below 1340 and while the price trades below 1340, there is scope of further dip towards 1320 in the next few sessions. Near term looks bearish.
Copper (3.2045) is likely to trade within 3.12-3.25 region in the near term. A break on either side of these levels would indicate further course of movement.
FOREX
Dollar Index (89.283) might be on course to test support on daily and weekly line charts near 88.5-88.8 this week. On the daily candles, upside for the Dollar Index in the near term looks restricted to 89.5. With a further rise in bond yields (see Interest Rates below), it looks like higher yields are still not impacting the Dollar positively and it would be interesting to see how long this continues.
Euro (1.2401) could find immediate support near 1.24 on the daily candles for now. The ECB kept its rates constant in last Friday’s meeting in face of a robust Euro; however, markets seem to have expected an even more dovish stance, which wasn’t seen, thereby leading to continued strength in Euro. Euro could again test resistance near 1.25 on the weekly line charts if it stays above 1.24.
Dollar-Yen (108.91) continues to stay below 109, impacted by the Bank of Japan chief’s comment that inflation is finally nearing targets, thereby increasing the likelihood for raising of interest rates in future. There is support near 108.5-108.75 on the weekly line charts which should hold for now.
Euro-Yen (134.99) might well target levels near 134.5 if Dollar Yen comes down further to 108.5 and the Euro stays around 1.24. In case there is some weakening in the Euro towards 1.235, Euro-Yen might test support near 134 on the daily candles before moving up.
Pound (1.4117) is currently trading below resistance near 1.42 on the 3 day candles. In case it breaches this resistance again, there is higher resistance near 1.44 on the weekly candles which should hold in this week.
In case Dollar-Rupee (63.60) rises past 63.70, then we can look for 63.80-90. However a rise in the major currencies relative to the Dollar could pull Dollar Rupee down towards 63.40 as well.
INTEREST RATES
US 10 Yr (2.6842%), 30 Yr (2.9324%), 5 Yr (2.4920%) & 2 Yr (2.1283%) are again at record highs as they are seemingly impacted by low GDP numbers in USA.
The volatility in bond yields continues for now, with the 10 Yr- 5Yr spread (0.1922%) just below support on the short term charts and the 30 Yr-10 Yr spread (0.2482%) nearing support near 0.24% on the long term charts. There could be some pause in flattening though from these support levels.
Eurozone GDP Growth Set To Reach Fresh Highs, But Inflation Could Weaken
The euro had a crazy rally last week, posting a weekly gain of 2.5% versus the dollar and touching $1.25 for the first time since December 2014. While this initially seemed to mirror the dollar's, weakness emerging from US Treasury Secretary Steve Mnuchin's currency talk-down, the ECB chief, Mario Draghi, attributed the euro's strength partly to the block's bold performance. This week, Tuesday's preliminary GDP growth figures are said to highlight Eurozone's robust recovery, whereas a day after, flash CPI estimates might show that inflation still lacks momentum in the region.
Eurostat is scheduled to deliver Eurozone's preliminary GDP growth figures for the final quarter of 2017 at 1000 GMT. Analysts believe that the block's economic growth has risen by 0.1 percentage points to the highest in a decade of 2.7% on an annualized basis, while relative to the third quarter of 2017, they project the economy to keep growing by 0.6% for the third time in a row. Tomorrow's calendar will also see the release of the European Commission's economic and business surveys; economic sentiment is anticipated to improve even further as the composite index is said to climb by 0.3 points to hit a fresh 17-year peak at 116.3 in January.
But forecasts suggest that inflation might continue to bother ECB policymakers in 2018. Despite the central bank maintaining an easy monetary policy of low interest rates and asset purchases amounting to large sums, inflation surprisingly showed little reaction to reach the ECB's goal of 2.0%. While the measure managed to reach 2.0% y/y in the first three months of 2017, it then slowed down to 1.5% on average in the following months although the unemployment rate was on course to return to pre-crisis levels. For January, the unemployment rate is anticipated to remain flat at a nine-year trough of 8.7%, but preliminary CPI estimates call for inflation to start the year weaker at 1.3% y/y compared to 1.4% in the preceding month. The core equivalent, which excludes food and energy, is also expected to inch down to 1.0% y/y after rising by 1.1% for three straight months.
Euro/dollar could cheer if the data smash expectations, climbing back to the $1.24 key level. However as long as inflation shows little signs of approaching the desired level, euro gains are expected to remain restrained. Discouraging prints would also justify Draghi's argument that some degree of monetary stimulus is still necessary, saying recently that this would be provided from “net asset purchases, by the sizable stock of acquired assets, and the forthcoming reinvestments and by our forward guidance on interest rates”. On the flip side, a worse than expected outcome could push the euro down to the area between 1.23-1.22 where the pair has been recently consolidated.
Will Australia’s Inflation Data Nudge The RBA Out Of Its Lull?
Australia's inflation prints are due out on Wednesday at 00:30 GMT and expectations are for the CPI rate to re-enter the Reserve Bank of Australia's (RBA) target band. Will this be enough to trigger an optimistic response by the Bank when it meets again next week, or are there more hurdles to be overcome before that happens?
The Australian dollar has staged a spectacular run so far in 2018, gaining nearly 4% against its US counterpart, though the rally reflects more USD weakness than AUD strength – evident by the muted movements in other Aussie crosses. Whether the pair will continue to move higher in the near-term, or catch its breath by correcting lower, will probably depend on the quality of Australia's inflation data for the final quarter of 2017.
The forecast is for the headline CPI rate to rise to 2.0% in yearly terms, from 1.8% previously, while the trimmed mean rate is expected to tick up to 1.9% from 1.8%, staying just shy of the RBA's target band of 2-3%. Such prints would hardly be any surprise for policymakers however, considering that in its latest forecasts back in November, the RBA already anticipated the headline CPI to rest at 2% by year-end. Thus, even though an uptick in these rates would be a positive development, it is unlikely to trigger a significant change in the neutral tone the RBA has maintained in recent months.
For the RBA to really change tune, we would probably need to see the CPI rates beat their forecasts, perhaps with both rates coming higher than 2%. Something like that would be a major hawkish surprise for the Bank, which anticipates the CPI rate to reach 2.25% only in December 2018. That could lead the RBA to adopt a more optimistic tone, laying the groundwork for a rate hike sooner than previously signaled and thereby, leading to a surge in the AUD. In this scenario, aussie/dollar could surge and target its recent highs at 0.8135. An upside break of that territory would mark a 2½-year high for the pair, and could pave the way for the round figure of 0.8200.
On the other hand, a disappointment in these prints would likely keep the RBA sidelined for longer, leading market participants to price out expectations for a rate hike this year and causing the AUD to weaken. Such an outcome could see aussie/dollar correct lower towards the psychological territory of 0.8000, with a potential break below that level possible to open the way for the 0.7960 support. As always, the magnitude of any market reaction at the time of the release will depend on the deviation of the actual data prints from the forecasts.