Sample Category Title
EUR/CHF Stalling Below 1.1700
EUR/CHF continues to push towards resistance area above 1.17 and support given at 1.1610 (27/10/2017 low). Expected to show continued increase.
In the longer term, the technical structure has reversed. Strong resistance is given at 1.20 (level before the unpeg). Yet, the ECB's QE programme is likely to cause persistent selling pressures on the euro, which should weigh on EUR/CHF. Supports can be found at 1.0184 (28/01/2015 low) and 1.0082 (27/01/2015 low).
EUR/GBP Back Around 200-DMA
EUR/GBP is trading higher lower. The pair has failed to hold below broken support at 0.8791 (07/11/2017 low). Resistance is located at 0.8943 (27/11/2017 high). Expected to show further short-term increase.
In the long-term, the pair has largely recovered from recent lows in 2015. The technical structure suggests a growing upside momentum. The pair is trading above from its 200 DMA. Strong resistance can be found at 0.9500 (psychological level).
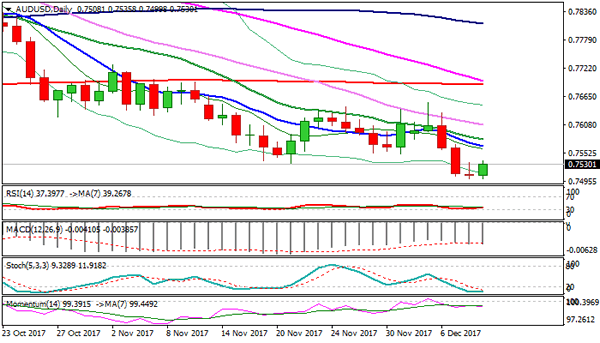
AUD/USD Weakness Set To Continue
AUD/USD's downside pressures continue to increase. Hourly resistance is given at a distance at 0.7897 (13/10/2017 high). Key support at 0.7535 (22/06/2017 low) has been broken. Expected to go even lower.
In the long-term, the trend is turning positive. Key supports stands at 0.6009 (31/10/2008 low) . A break of the key resistance at 0.8164 (14/05/2015 high) is needed to invalidate our long-term bearish view.
USD/CAD Strong Rebound
USD/CAD has bounced back after testing hourly support lies at 1.2667 (10/11/2017 low). Hourly resistance stands at 1.2917 ( 27/10/2017 high). Expected to show further bearish consolidation.
In the longer term, the pair has broken longterm support that can be found at 1.2461 (16/03/2015 low). Strong resistance is given at 1.4690 (22/01/2016 high). The pair is likely to head further lower.
USD/CHF Buying Demand
USD/CHF's volatility is lower. The pair lies in a short-term bullish momentum. Yet, the technical structure indicates further downside risks. The pair has failed to hold consistently above the parity.
In the long-term, the pair is still trading in range since 2011 despite some turmoil when the SNB unpegged the CHF. Key support can be found 0.8986 (30/01/2015 low). The technical structure favours nonetheless a long term bullish bias since the unpeg in January 2015.
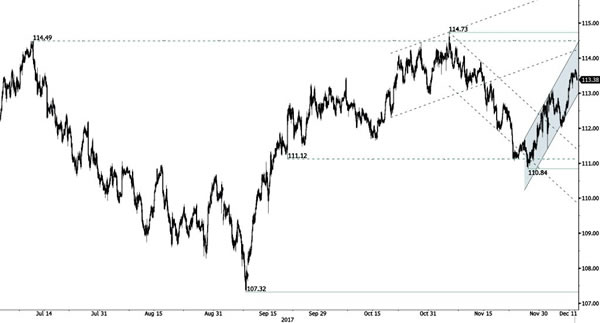
USD/JPY Short-Term Bullish Momentum
USD/JPY keeps on pushing higher. The pair has strongly bounced back. The pair is heading towards strong resistance at 114.73 (06/11/2017 high).
We favor a long-term bearish bias. Support is now given at 99.02 (10/08/2013 low). A gradual rise towards the major resistance at 125.86 (05/06/2015 high) seems unlikely. Expected to decline further support at 93.79 (13/06/2013 low).
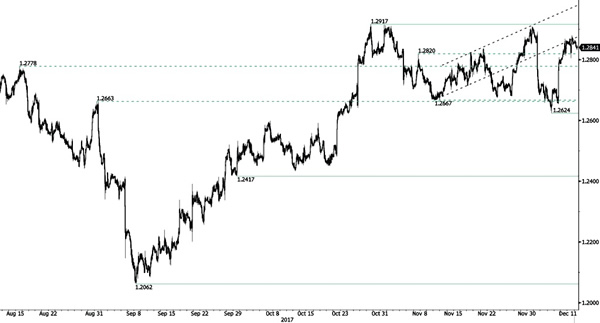
GBP/USD Double-Top At 1.3549
GBP/USD is bouncing back. The technical structure indicates an extension of bullish momentum. Support is given at a distance at 1.3320 (07/12/2017 low). Expected to show continued further monitoring of resistance at 1.3549.
The long-term technical pattern is reversing. The Brexit vote had paved the way for further decline. Long-term support can be found at 1.1841 (07/10/2017 low). Long-term resistance given around 1.35 is at stake and indicates a long-term reversal in the negative trend. Yet, it is very unlikely at the moment.
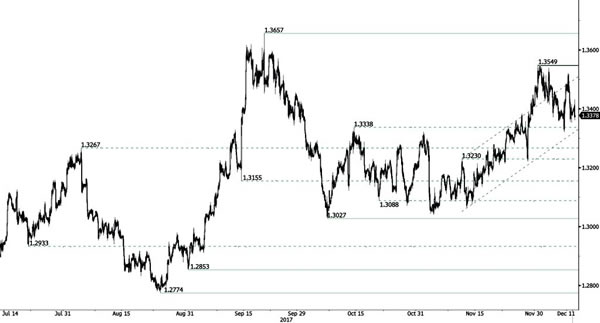
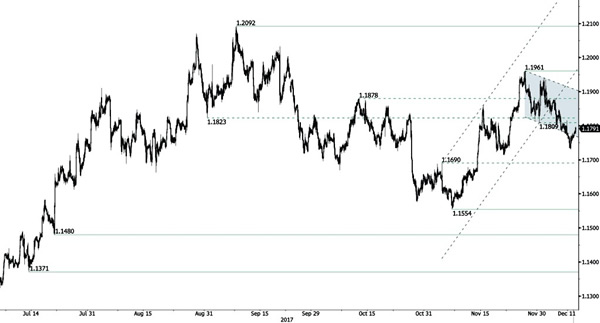
EUR/USD Short-Term Bullish Consolidation
EUR/USD's bearish momentum is very strong. Hourly resistance is given at 1.1961 (27/11/2017 high). Hourly support given at 1.1730 (08/12/2017 low). Expected to show continued decline.
In the longer term, the momentum is now turning largely positive. We favour a continued bullish bias. Key resistance is holding at 1.2252 (25/12/2014 high) while strong support lies at 1.0341 (03/01/2017 low).
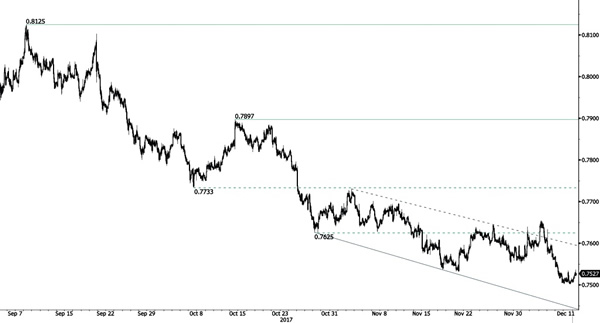
Technical Outlook: AUDUSD May Extend Correction On Completion Of Doji Reversal Pattern
The Aussie dollar bounces on Monday after repeatedly failing to clear 0.7500 support (lows of 7/8/11 Dec).
Support is reinforced by bull-trendline, drawn off 0.6825 (15 Jan 2016 low) which currently lies at 0.7480.
Fresh rally is forming Doji reversal pattern on daily chart, which requires confirmation on firm break above 0.7550/64 pivots (Fibo 38.2% of 0.7631/0.7499 downleg / falling 10SMA).
Strongly oversold slow stochastic on daily chart signals corrective action which could extend on lift above 0.7550/64 triggers.
Overall structure remains firmly bearish and favors fresh downside after correction, which should not exceed 0.7580 (20 SMA) to keep bearish setup intact.
However, sustained break below 0.7500 zone is needed to spark extension of larger downtrend from 0.8124 (08 Sep peak).
Meanwhile, the pair may hold in extended consolidation while trendline support holds.
Upper trigger lies at 0.7653 (05 Dec high) and only clear break here would signal stronger recovery.
Res: 0.7550, 0.7580, 0.7600, 0.7653
Sup: 0.7500, 0.7480, 0.7370, 0.7328
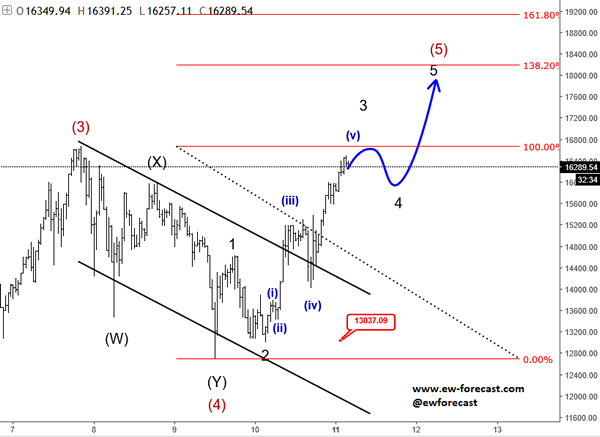
Elliott Wave Analysis: BTCUSD, EURUSD And DAX
The main story of the day are new lunched BitCoin futures on CBOE exchange, where we saw BTC futures moving up by 20% after the lunch, but there were a few halts already because of sharp moves. Because of more valid price data, we will continue to track spot market, where we still see room for 18k within wave (5).
BTCUSD, 45Min
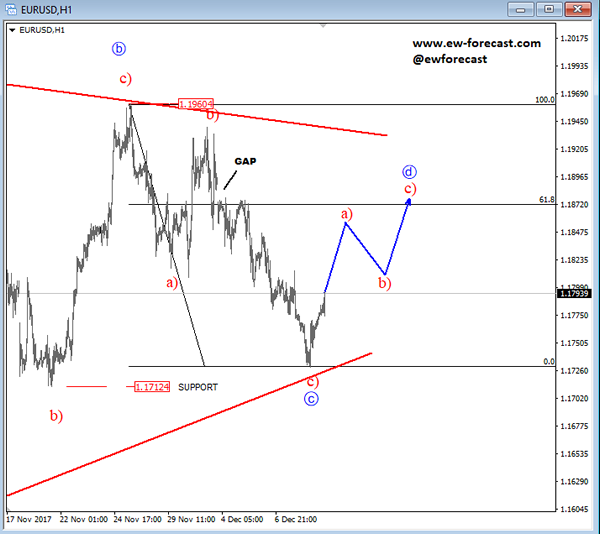
Regarding stock and USD we think it can be very volatile this week as FED is expected to increase rates. We have seen some USD gains lately, so that increase can already be priced in, which means we may in fact see lower USD. There is also EURUSD in a three wave decline and open gap near 1.1890, so clearly we expect a bounce on this pair.
EURUSD, 1h
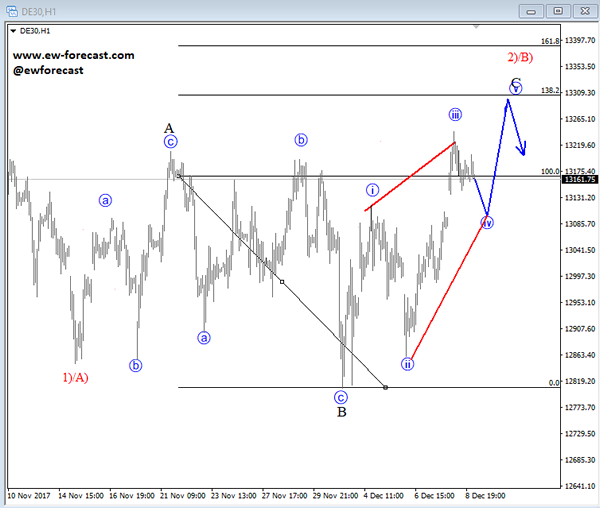
At the same time, there is a change for stocks weakness. Dax per example is seen in a very complex three wave pattern; a EW flat with subwave C) underway to around 13300 where we will expect a turn lower after a completed ending diagonal.
Dax, 1h