Sample Category Title
EUR/USD Bull Flag And Level To Watch
After benefiting from USD weakness and ripping higher though channel resistance, EUR/USD was unable to break the next level of higher time frame resistance and has started to slowly edge back down.
But in edging back down, the pair is starting to form what look awfully close to a bull flag on the higher time frame charts. Take a look at the weekly here below:
EUR/USD Weekly:
The single lower high and lower low that you can see connecting each trend line, has at least started to print the bull flag and given us at least some basis to start to look for longs.
As the above is forming on a weekly and still unfolding, I don’t want to zoom in too far, so I’m only going down to the daily. Check out the levels I’m looking at below:
EUR/USD Daily:
Mostly I want you to focus on the horizontal zone and then the short term (relatively) previous resistance level that we will be looking to act as support.
If it does in fact turn out this way, this is an excellent level to look at taking a long position off of, and most importantly allows you to manage your risk around the swing low just underneath.
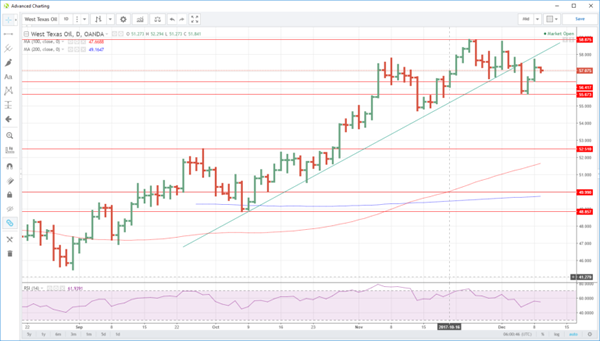
Oil’s Rally Falters After Kuwait Comments
Oil is under pressure in Asia after comments from Kuwait over the weekend.
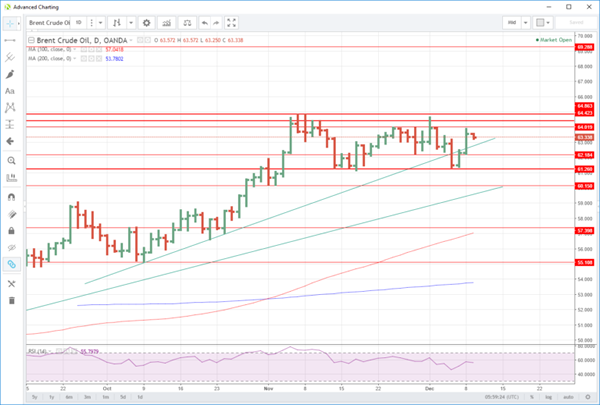
Oil continued its sideways consolidation on Friday, as both Brent and WTI rode the coattails of a general commodities rally to finish at 63.57 and 57.25 respectively. The picture has not been so bright this morning, as Kuwait's oil minister over the weekend said that OPEC and Non-OPEC would study exit strategies before the joint meeting in June.
Although wholly rational and logical in itself (you would sensibly plan these things far in advance of the end of 2018 expiry), it was enough to send traders scurrying from long positions in early Asia. Brent has fallen 0.46% or 30 cents to 63.50 with WTI falling 0.40% or 25 cents to 57.00.
The UAE energy minister has since bought some clarity and voice of reason to the previous comments with,
“UAE ENERGY MINISTER SAYS OPEC, NON-OPEC PLAN TO ANNOUNCE AN EXIT STRATEGY FROM SUPPLY CUTS IN JUNE, DOES NOT MEAN WE WILL EXIT IN JUNE” Source: Reuters
Brent has resistance at the multiple daily tops at 64.00 followed by 64.45 and 64.85. Support is at 62.20 and then the critical 61.25 numerous daily lows.
WTI spot has resistance at 58.00 and then 58.20, its trendline resistance ahead of the substantive 58.85 level, a daily triple top. Support is at 56.40 followed by 55.675.
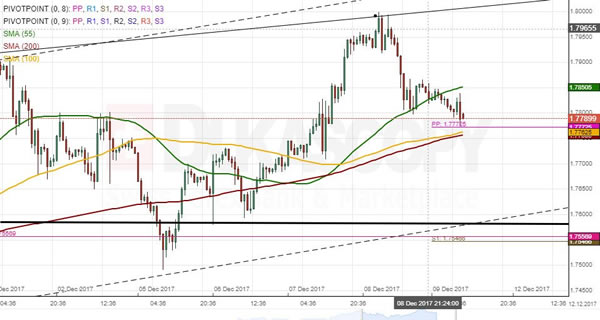
GBP/AUD 1H Chart: Breakout From Long-Term Triangle
GBP/AUD was trading in a symmetrical triangle since mid-2016. This long-term pattern was breached on November 28 when the bullish sentiment that had driven the pair for the last four months provided enough strength to edge even higher. The Pound has since made a retracement from the given triangle and was trading near the psychological 1.78 mark early on Monday. It is likely that the pair is delayed near the combined resistance of the 100– and 200-hour SMAs and the weekly PP circa 1.7770. This could result in a minor period of consolidation near this area. It is expected that the Sterling depreciates against the Australian Dollar during the second half of this week in line with the prevailing channel up. On the other hand, the upside target for this week could be the monthly R1 at 1.82.
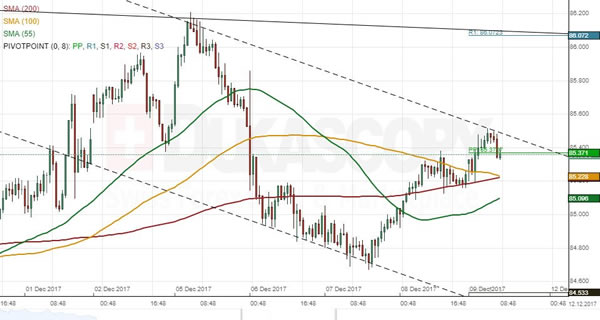
AUD/JPY 1H Chart: Short-Term Channel Could Prevail
The bearish sentiment has prevailed AUD/JPY since mid-September. This has sent the pair for a decline in a descending channel. The Aussie bounced off the upper boundary of this pattern on December 5 prior to initiating a new wave down. It seems that a short-term channel has formed; however, the rate should still provide another confirmation of its upper boundary by edging lower. Technical indicators suggest that it could be the most likely option in this session. In order to fulfill this assumption, the Aussie still needs to breach a significant support area set by the 200-, 100– and 55-hour SMAs circa 86.30. In general, a possible downside target during the first part of this week could be the 84.10 territory. In case the rate continues to fall even further, it might aim for the lower boundary of the senior channel circa 82.50.
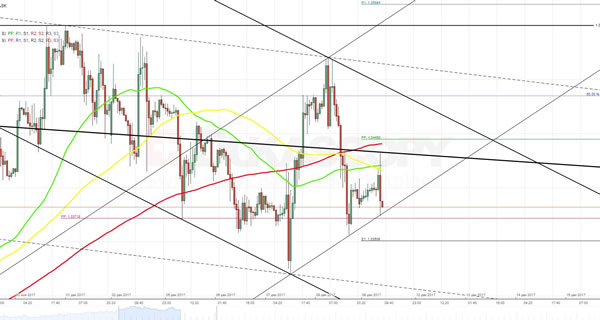
EUR/USD Analysis: Moves Towards 1.1795
New trading week the currency exchange rate started in a movement towards combined resistance level formed by the weekly PP and the slipping 100-hour SMA.
Such recovery of the Euro was triggered by a rebound from support zone located between the 1.1730 and 1.1722 levels. In addition to that, depreciation of the buck signified a breakout from the falling wedge formation. In first half of this trading session the pair is expected to continue moving upwards until it reaches an area near the 1.1795 mark. The further surge is unlikely due to additional resistance posed by the monthly PP at 1.1806 and the upper boundary of a junior descending channel.
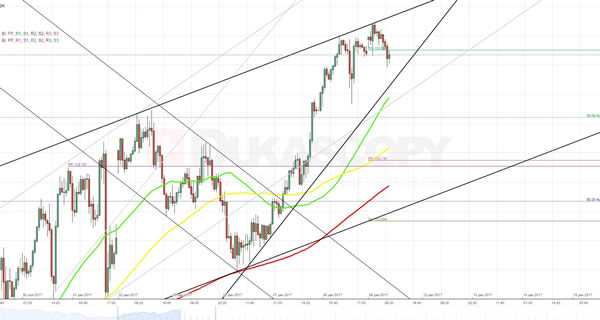
GBP/USD Analysis: Tests 1.3410
On Friday, the Pound was actively appreciating against the Dollar being fuelled by reports about progress made on Brexit divorce bill. However, once this anxiety ran out and the US posted another set of positive employment data the pair returned back to the monthly PP located at the 1.3372 mark. At the moment, the cable is testing combined resistance level set up by the 55-, 100- and 200-hour SMAs as well as the weekly PP at 1.3415. Unless the rate receives a proper impulse from some news, a rebound is expected to happen. Such scenario also looks more plausible from fundamental perspective due to expectations of the upcoming interest rate hike and adoption of tax bill. However, today a deep plunge is unlikely to happen, as the above monthly PP still represents strong support barrier.
USD/JPY Analysis: Fails To Bypass 113.68
Most of the previous trading session the currency rate spent moving towards the 23.6% Fibonacci retracement level located at 114.03. Nevertheless, this target was not achieved due to resistance area formed near the 113.70 mark.
As for today, a minor retreat back to 113.20 is possible. However, the Yen unlikely to gain much value due to pressure from the rising 55-, 100- and 200-hour SMAs. On the other hand, it looks like the pair is moving in a new rising wedge formation, which presupposes a breakout towards the 50% retracement level. In case of such mixed signals there is a need to turn to the overall fundamental picture, which is in favor of the buck, as markets anticipate the interest rate hike
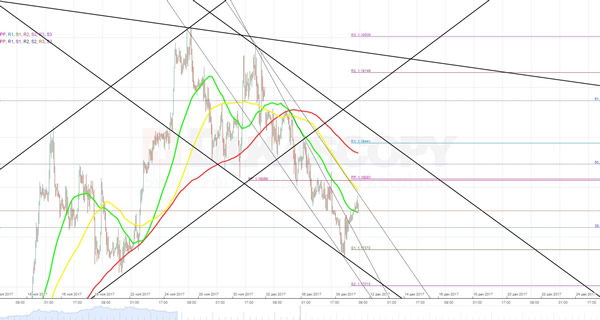
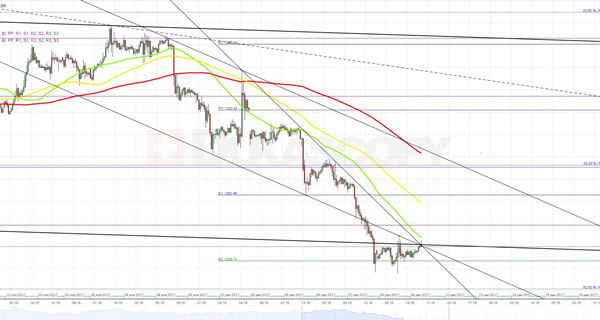
XAU/USD Analysis: Tries To Break Below Monthly S2
Previous trading session the exchange rate mostly spent in a horizontal movement between the monthly S2 from the bottom and the upper boundary of a medium-term descending channel from the top. As on daily chart the pair continues to fluctuate in a junior channel down, a little recovery of the yellow metal is expected to happen. On the other hand, on hourly chart the upward movement is likely to be neutralized by the falling 55- and 100-hour SMAs as well as the weekly PP and the monthly S1 located around them. Hence, in nearest perspective the rate most probably will continue moving in southern direction. Such scenario is supported by positive expectations of the upcoming adoption of the tax reform as well as interest rate hike.
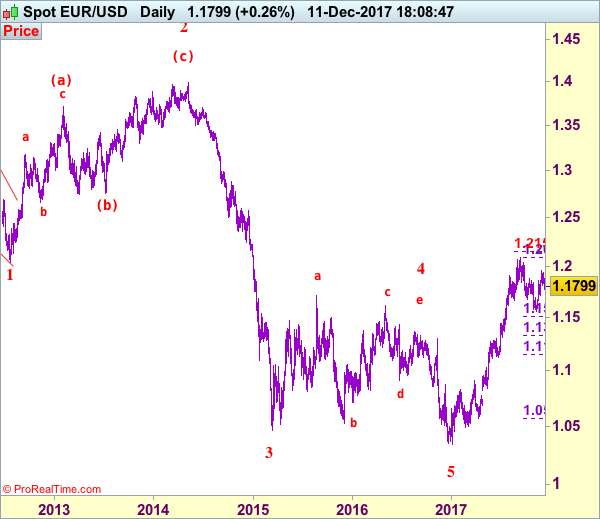
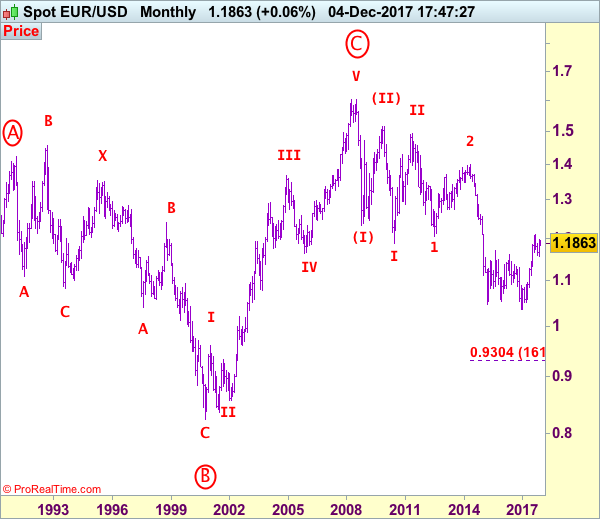
EUR/USD Elliott Wave Analysis
EUR/USD – 1.1798
EUR/USD: Wave (c) of 2 ended at 1.3993 and wave 3 of III has commenced for weakness to 1.0411 (1.236 of wave 1), then 1.0000.
The single currency dropped last week on dollar’s broad-based rebound and the pair fell to as low as 1.1730 late last week, suggesting top has possibly been formed at 1.1961, hence consolidation below this level would be seen and below said support at 1.1730 would bring test of support at 1.1713, a break there would suggest the rebound from 1.1554 has ended at 1.1961, bring further fall to 1.1660-65, then towards 1.1620-25 but said support at 1.1554 should remain intact. .
Our preferred count on the daily chart remains that a wave (II) from 1.2329 ended at 1.5145 with A-leg ended at 1.4720, followed by wave B at 1.2457, the wave C from there was also a 3 legged move and is labeled as (a): 1.3739, (b): 1.2885, the wave iii of the 5-waver (c) from 1.2885 has ended at 1.4339 and wave iv is a triangle ended at 1.3878 and wave v formed a top at 1.5145. The decline from there is a 5-waver (C) with minor wave (i) of I of (C) ended at 1.4218 with wave (ii) ended at 1.4580, wave (iii) ended at 1.3267 and wave (iv) ended at 1.3692 and wave (v) ended at 1.1876, this is also the low of wave I of (C) and wave II ended at 1.4940, hence wave III is now in progress with a diagonal wave 1 ended at 1.2042, the breach of previous support at 1.1876 (wave I trough) adds credence to our view that the wave 2 has ended at 1.3993, wave 3 has commenced for further weakness to 1.0411, then towards 1.0000.
On the upside, whilst initial recovery to 1.1845-50 cannot be ruled out, reckon upside would be limited to 1.1875-80 and bring another decline later. Only above 1.1940 would revive bullishness and signal the retreat from 1.1961 has ended, bring retest of said resistance, break there would extend the rise from 1.1554 to 1.2000. Looking ahead, only a break above resistance at 1.2035 would retain bullishness and signal early upmove has resumed for retest of 1.2093 first. A break of this resistance would confirm resumption of recent upmove from 1.0340 low for headway to 1.2150-55 (61.8% projection of 1.1119-1.1910 measuring from 1.1662), then 1.2200-10
Recommendation: Stand aside for this week.
Euro's long-term uptrend started from 0.8228 (26 Oct 2000) with an impulsive structure. The rise from 0.8228 to 0.9593 (5 Jan 2001) is labeled as wave I, the retreat to 0.8352 (6 Jul 2001) is wave II and the rally to 1.3670 (31 Dec 2004) is wave III. Wave IV from there ended at 1.1640 (15 Nov 2005), the subsequent upmove to 1.6040 (July 15, 2008) is treated as wave V, the major selloff from the record high of 1.6040 to 1.2329 (October 27, 2008) signals a reversal has taken place with (I) leg ended at 1.2329 and once (II) ended at 1.5145, wave (III) itself is an extended move with I: 1.1876 and complex wave II ended at 1.4902, wave III has commenced with wave 1 and 2 ended at 1.2042 and 1.3993 respectively, wave 3 of III is now unfolding for weakness towards parity.
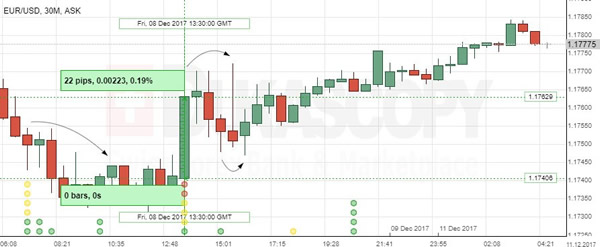
EUR/USD: US Non-Farm Employment Change
The Greenback weakened against the European single currency on the US data on Friday pointing to the healthy economic conditions. The EUR/USD jumped 22 base points to the 1.1760 mark, where the bullish sentiment was sustained, putting the pair higher to the 1.1780 level.
The US employment grew at a strong pace in November, confirming the country’s healthy economic state, which analysts see not requiring the Donald Trumps’ proposed fiscal stimulus, even with the moderate pay growth. The Labour Department showed that non-farm payrolls added 228K positions, while average hourly earnings increased 0.2% in the reported month, boosting the yearly rise in wages to 2.5%. Data also showed the jobless rate unaltered at a 17-year low of 4.1%.