Sample Category Title
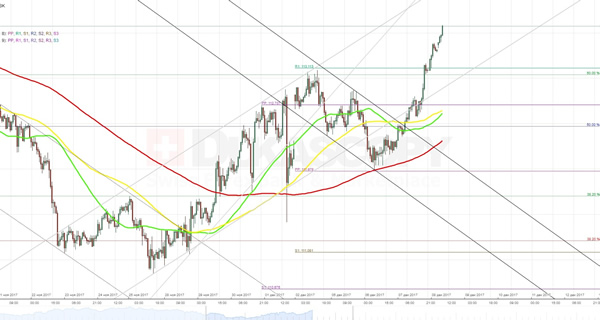
USDJPY Analysis: Tends To Reach 114.00
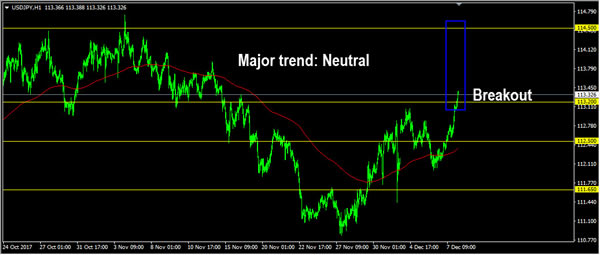
As the Congress managed to avoid government shutdown, the Dollar continued to gain value against the Yen, simultaneously passing the monthly PP and the 50% Fibonacci retracement level at 113.00. At the moment, the pair is facing no technical barriers on its way up until the weekly R2. On the other hand, there are two alleged resistance zones located between the 113.47 and 113.57 as well as 113.86 and 113.91 marks. Moreover, the pair might be stopped near the 113.75 level, as this area represents location of an upper boundary of an alleged junior ascending channel. There is also a need to take into account an effect from release of the US employment data, as it might either help to push the rate to the above weekly R2 or return it back to the above retracement level.
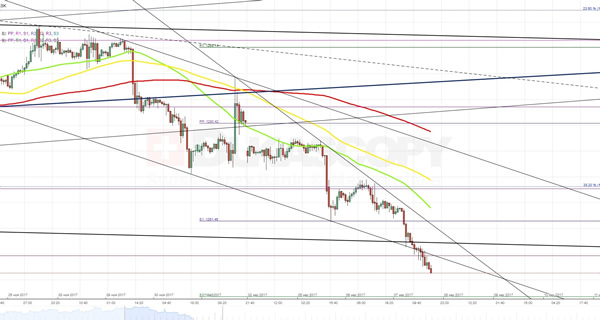
XAUUSD Analysis: Finds Support At 1,246.74
Even though the exchange rate was moving in a falling wedge formation and was about to reach the bottom trend-line of a medium-term descending channel, the rebound did not happen. Instead, the pair continued to fall to up until the monthly S2 located at 1,246.74. The drop was mainly based on funding bill that was sent to President Trump by the Congress in order to avoid government shutdown. After such rapid appreciation of the buck, in first half of this trading session the yellow metal is expected to recover some lost positions, tending to reach an area near the 1,252.00 mark. However, this recovery might be cancelled in case of release of the better than expected employment data. Moreover, there is a need to take into account an ongoing optimist related to progress on tax reform.
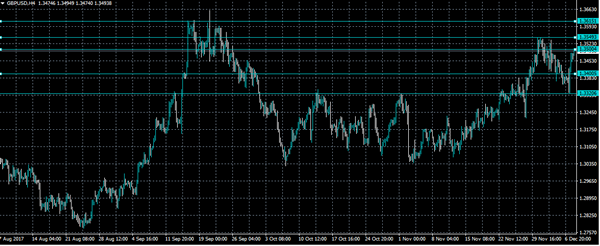
GBPUSD Bullish Turns Above 1.3400 Level
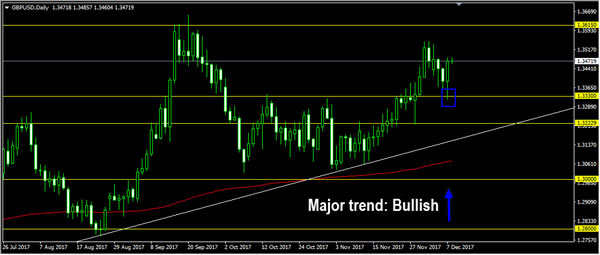
The British pound has moved towards the 1.3500 level against the U.S dollar, as speculation that a new border agreement is close to being reached, encouraged GBPUSD buying. A deal between the United Kingdom and Ireland on how to run their post-Brexit land border could remove the last obstacle to opening free-trade talks with the European Union. Traders now look to the release of the Non-farm payrolls job report on Friday, with many market participants expecting a solid increase in U.S jobs, and strong monthly wage growth from the American economy.
The GBPUSD pair is technically bullish while trading above the 1.3400 level, further upside towards 1.3549 and 1.3615 seems possible.
Should intraday sellers push price-action below the 1.3400 level, the GBPUSD pair may move back towards the 1.3320 and 1.3300 support levels.
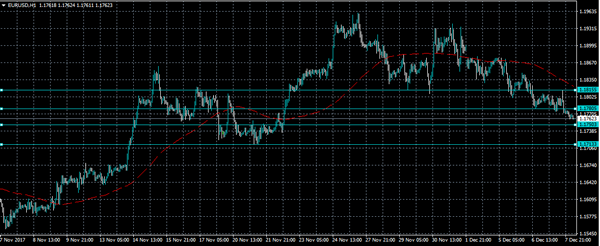
EURO Selling Below 1.1780 Level
The euro has continued to extend weekly losses against the U.S dollar overnight, with the pair now trading around the 1.1760 level. A clear break below the 1.1780 level intensified technical selling in the EURUSD in Asia, as the U.S dollar index moves towards the 94.00 mark. The move lower in the pair appears to be a U.S dollar driven more, as investors shift into greenbacks, ahead of the Federal Reserve interest rate decision next week. Traders now await the release of the U.S Non-farm payrolls job report later today, with the market expecting a solid 200,000 jobs figure and strong U.S wage growth during November.
The EURUSD pair is strongly bearish below the 1.1780 level, further downside selling towards the 1.1750 and 1.1713 technical levels now seems likely.
If the EURUSD pair moves back above the 1.1780 technical level, further upside towards the 1.1815 technical level appears possible. Extended intraday resistance is found at the 1.1845 level.
US Nofarm Payrolls Take Centre Stage
US economic data will be in the spotlight on Friday, as investors assess the latest nonfarm payrolls report. The data series is arguably the most closely watched calendar release of the month and has been known to induce heavy volatility in the market.
Action begins at 07:00 GMT with a monthly report on Germany’s trade balance. Europe’s largest economy is expected to show a surplus of €21.8 billion in October, unchanged from the previous. Exports are expected to grow 1% on month, slightly outpaced by a 1.1% increase in imports.
The United Kingdom’s statistical agency will report on industrial production, manufacturing production and trade at 09:00 GMT. The reports could stoke heavy volatility in the British pound.
The official nonfarm payrolls report is due for release at 13:30 GMT, and is expected to show the creation of 200,000 jobs for the month of November. That follows a gain of 261,000 in October.
The unemployment rate is forecast to hold steady at 4.1%. Average hourly earnings – a proxy for inflation – is expected to come in at 0.3% month-on-month. That followed a disappointing flat reading the previous month.
Earlier this week, the ADP Research Institute said private sector payrolls rose by 190,000 in November, which was slightly higher than expected.
Later in the session, the University of Michigan will unveil its latest consumer sentiment index for the month of December. The monthly gauge is expected to rise half a point to 99.0.
North of the border, the Canadian government will report on housing starts and capacity utilization on Friday.
Earlier in the day, China released its latest trade figures for the month of November. Beijing’s trade surplus expanded unexpectedly to $40.21 billion from $38.19 billion the previous month. Exports rose 12.3% year-on-year, while imports added 17.7%.
In yuan terms, China’s surplus amounted to 263.6 billion, up from 254.5 billion the previous month.
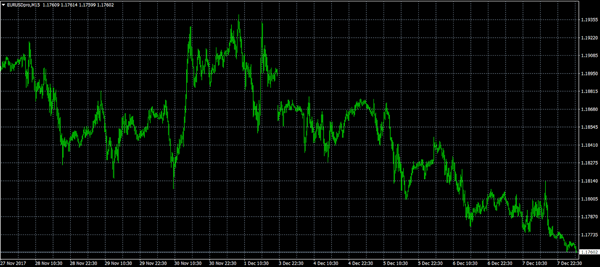
EUR/USD
The euro resumed its gradual descent on Friday, falling back toward the mid-1.17 US region. The EUR/USD exchange rate was last down 0.1% at 1.1762 following a series of declines. The current zone of support is located at 1.1657 after prices fell through the initial support level of 1.1777.
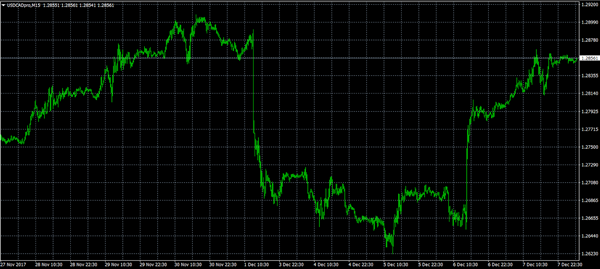
USD/CAD
The Canadian dollar has been backpedaling since Wednesday when the Bank of Canada kept monetary policy on hold. The USD/CAD was last seen trading at 1.2856 on Friday, little changed from the previous close. The North American cross could face strong price activity following the NFP report.
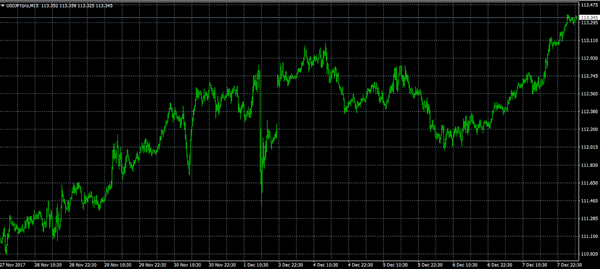
USD/JPY
Momentum for the USD/JPY is gradually building as the pair returned above 113.00. At press time, the USD/JPY was up 0.2% at 113.36, its highest in three weeks. The pair remains firmly anchored near the 6 December swing low of 111.99.
GBPJPY Turns Bullish Above 152 Level But Rally Stalls On Overbought Conditions
GBPJPY has firmed up and turned more bullish after breaking above the key 152 level on December 7. However, the rally off the 150 area has now stalled at 153.40 after the market became overextended.
On the 4-hour chart the RSI reached overbought levels at 70 and due to weaker momentum in the market, GBPJPY will likely consolidate in the near term or might even see a deeper pull back.
To the downside, strong support is now being provided at 152. If it fails to hold, then prices could fall to 150 and place the pair back into the medium-term range from late September. An extension below 150 would erase the near-term bullish bias.
For now, risk is still skewed to the upside. As long as GBPJPY can sustain trading above 152, then this could be the start of a new bullish phase, with scope to extend towards the 160 handle.
The bullish crossover of the 50 and 200-period moving averages are supporting the bullish outlook.
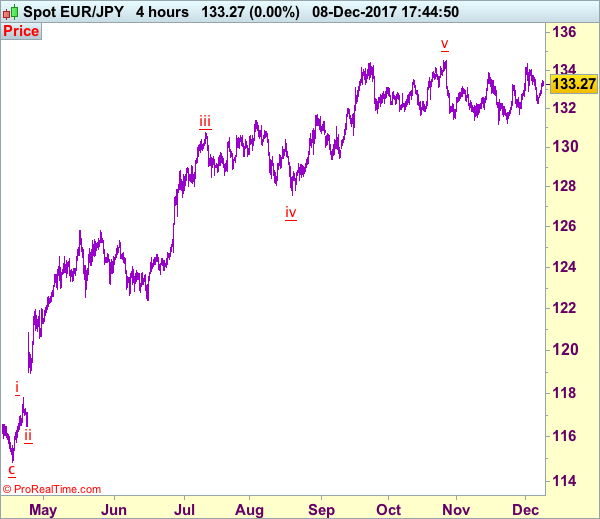
EUR/JPY Elliott Wave Analysis
EUR/JPY - 133.28
Although the single currency retreated after meeting resistance at 134.38 and further consolidation below recent high at 134.50 would be seen, as euro found renewed buying interest at 132.26 and has staged a rebound, retaining our bullishness and mild upside bias remains for another rebound to 134.00, then towards strong resistance area at 134.38-50. Looking ahead, break there is needed to confirm medium term upmove has resumed and extend gain to 135.00, and then 135.50-60. Having said that, loss of upward momentum should prevent sharp move beyond 136.00-10 and reckon 136.95-00 would hold, price should falter well below 138.45-50 (1.618 times extension of 109.49-124.10 measuring from 114.85), bring correction later.
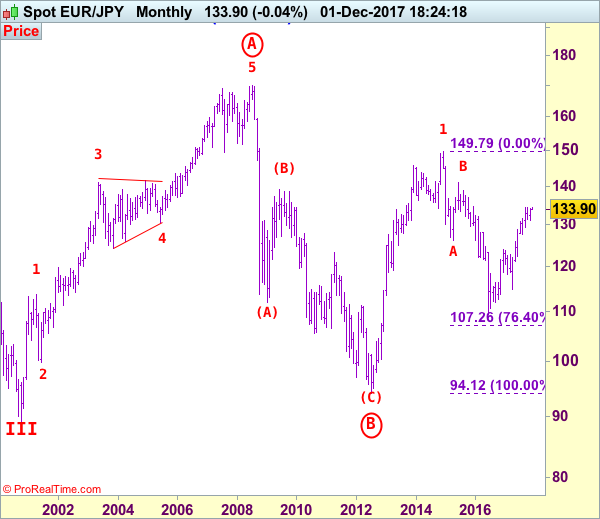
The daily chart is labeled as attached, early selloff from 169.97 (July 2008) to 112.08 is wave (A) of B instead of end of entire wave B and then the rebound from there to 139.26 is wave (B), hence, wave (C) has possibly ended at 94.12 with a diagonal triangle as labeled in the daily chart, hence upside bias is seen for further gain. Recent rally above indicated retracement level at 116.69 (50% Fibonacci retracement of the intermediate fall from 139.26-94.12) adds credence to this view and signal major reversal has commenced but first leg of this wave C has possibly ended at 149.79, hence wave 2 has commenced with wave A ended at 126.09, followed by wave B at 141.06, wave C commenced and could have ended at 109.49, indicated upside targets at 126.00 and 130.00 had been met and further gain to 135.00 would follow.
On the downside, whilst initial pullback to 132.90-00 cannot be ruled out, reckon 132.50-60 would limit downside and bring another rise later to aforesaid upside targets. Only below said support at 132.26 would abort and signal the rebound from 131.17 has ended, bring weakness to support at 131.72, then towards 131.17. Once this support is penetrated, this would suggest a temporary top is formed, bring retracement of recent rise to previous support at 130.62, then towards 130.00 later.
Recommendation: Hold long entered at 133.00 for 135.00 with stop below 132.20.
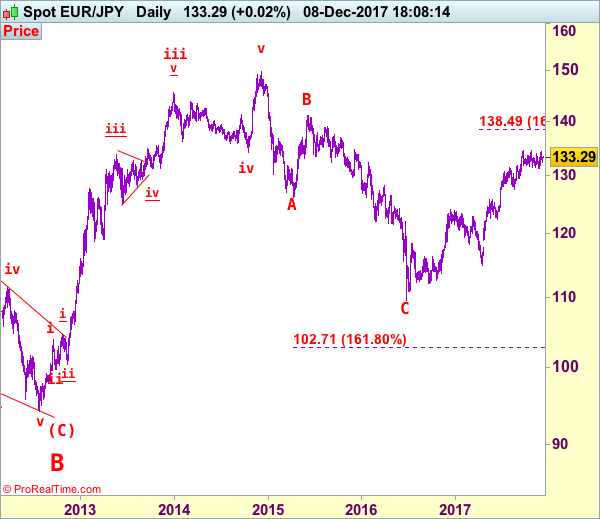
To re-cap the corrective upmove from the record low of 88.93 (18 Oct 2000), the wave A from there is subdivided as: 1:88.93-113.72, 2:99.88 (1 Jun 2001), 3:140.91 (30 May 2003), 4:124.17 (10 Nov 2003) and 5 ended at record high of 169.97 (21 Jul 2008). The brief but sharp selloff to 112.08 is viewed as a-b-c x a-b-c wave (A) of B. The subsequent rebound to 139.26 is (B) of B and (C) of (B) has possibly ended at 94.12 and in any case price should stay well above previous chart support at 88.93, bring rally in larger degree wave C towards 150.00.
US Non Farm No Longer A Weather Report
The political noise is still something which investors needed to be mindful
Friday's job number is going to significantly shape the expectations for the fourth quarter.
We expect the November payroll number to be at 198K
keep in mind that the 12 month average is at 167K
More and more eyes are going to be focused on one particular number which matters the most; the US Non-Farm payroll data. Perhaps, there is no economic data which commands more attention than this. It sets the tone for the way the interest rate hike expectations would be moving.
This month's non-farm payroll number has a particular importance, because for the last two months, the jobs numbers were all over the place due to the impact of hurricanes. Investors could not gauge the actual health of the US economy. This is something that the market has experienced over and over. Yes, the upcoming data would not be considered as a weather report, however the political noise is still something which investors needed to be mindful of due to the ongoing debate over in Washington about the US tax overhaul. This is because the US tax overhaul has the potential to cloud the judgement of many and we certainly do not want the Fed to be one of them.
Friday's job number is going to significantly shape the expectations for the fourth quarter. What we need to see in Friday's number is that the slack in the labour market is diminishing and wage growth has strengthened. This would force consumers to spend more. We expect the November payroll number to be at 198K, keep in mind that the 12 month average is at 167K, and we need to see the economic growth becoming more sustainable in order for the 12 month moving average to cross the 200K mark. The previous month's wage growth and average hourly numbers were distorted due to the elevated demand for construction and markets have overestimated its strength.
This is the last set of NFP numbers before the Fed would announce their interest rate decision this month. The upcoming Fed chairman is on the same page as Janet Yellen (the current Fed chairwomen) that the US economy appears to be improving because the GDP growth is accelerating. Last two quarters have seen the GDP growth of 3%, but the current quarter may not grow as strongly as the previous one. Especially, when you question the fact that if the 3% GDP growth in the previous quarter had any residual effects of the quarter before. We do think that the Fed is going to increase the interest rate coming next week. The only question is if Friday's number is going to create further friction among the policy members (in relation to the number of interest rate hikes in 2018).
Daily Technical Analysis: EURUSD, GBPUSD, USDJPY, USDCHF
EURUSD
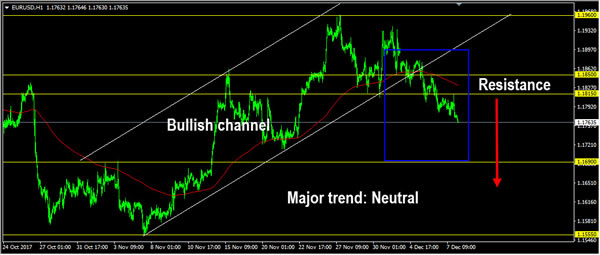
The EURUSD continued its bearish momentum yesterday bottomed at 1.1771 and hit 1.1761 earlier today in Asian session. The bias remains bearish in nearest term testing 1.1690 support area as a part of the bearish phase since broke below the bullish channel as you can see on my H1 chart below. Immediate resistance is seen around 1.1815 followed by 1.1850. On the downside, a clear break and daily/weekly close below 1.1690 would expose 1.1550 region next week. Fundamental focus today will be on the US NFP number. Overall I remain neutral.
GBPUSD
The GBPUSD attempted to push lower yesterday slipped below 1.3330 support area but whipsawed to the upside and closed higher at 1.3472. The bias is bullish in nearest term testing 1.3550 – 1.3615 region. Immediate support is seen around 1.3425. A clear break below that area could lead price to neutral zone in nearest term testing 1.3350/30 region. Overall I remain bullish and any downside pullback should be seen as a good opportunity to buy. Fundamental focus today will be on the US NFP number.
USDJPY
The USDJPY had a bullish momentum yesterday topped at 113.15 and broke above 113.20 resistance earlier today in Asian session, hit 113.38. The bias is bullish in nearest term testing 114.00/50 resistance area. Immediate support is seen around 113.00 – 112.85 area. A clear break back below that area could lead price to neutral zone in nearest term testing 112.35 area. Fundamental focus today will be on the US NFP number. Overall I remain neutral.
USDCHF
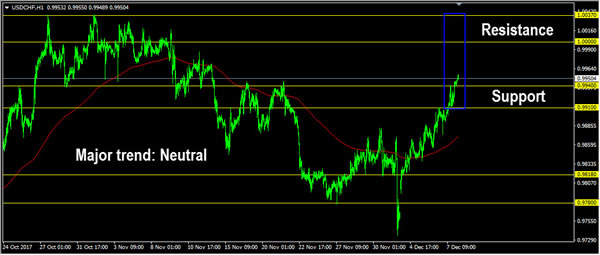
The USDCHF continued its bullish momentum yesterday broke above 0.9940 resistance and hit 0.9955 earlier today in Asian session. The bias is bullish in nearest term testing 1.0000 – 1.0037 resistance area. Immediate support is seen around 0.9910. A clear break back below that area could lead price to neutral zone in nearest term as direction would become unclear. Fundamental focus today will be on the US NFP number. Overall I remain neutral.
Trade Idea: EUR/JPY – Buy at 132.70
EUR/JPY - 133.27
New strategy :
Buy at 132.70, Target: 134.30, Stop: 132.20
Position: -
Target: -
Stop:-
Although the single currency fell to as low as 132.26, as euro found decent demand there and has staged a strong rebound, suggesting the pullback from 134.38 has possibly ended there and consolidation with mild upside bias is seen for gain to 134.00-05, however, break there is needed to add credence to this view and extend gain to said resistance. Looking ahead, only a break of recent high at 134.50 would retain bullishness and signal a resumption of early upturned has occurred, bring headway to 135.00-10 first.
In view of this, we are looking to buy euro again on dips. as 132.60-70 should limit downside. Only break of said support at 132.26 would abort and shift risk back to the downside for the fall from 134.38 towards 131.90-00, then test of support at 131.72 which is likely to hold on first testing.
Our latest preferred count is that wave (ii) is ABC-X-ABC which ended at 123.33 and wave (iii) is unfolding with wave iii ended at 100.77, followed by wave iv at 111.57 and wave v as well as the wave (iii) has ended at 97.04, followed by wave (iv) at 111.43 and wave (v) has ended at 94.12 which is also the end of the larger degree v, this also implied the major wave (C) has also ended there, hence major correction has commenced from there with (A) leg unfolding in its lower degree wave c which has possibly ended at 145.69. Under this count, A-B-C wave (B) has commenced with A leg ended at 136.23, wave B at 143.79 and wave C has possibly ended at 149.79.
Our larger degree count is that the decline from 139.26 is wave (C) and is sub-divided into a diagonal triangle i-ii-iii-iv-v with wave i - 105.44, wave ii- 123.33, wave iii - 97.03, wave iv - 111.43, followed by the final wave v as well as the end of wave (C) at 94.12, this also mark the bottom of larger degree wave B. Under this count, major rise in wave C has commenced as an impulsive wave with minor wave III ended at 145.69, wave V is still in progress for further gain to 150.00. Having said that, this so-called wave V could well be the first leg of larger degree 5-waver wave C and this wave C should bring at least a retest of wave A top at 169.97 (July 2008).