
Sample Category Title
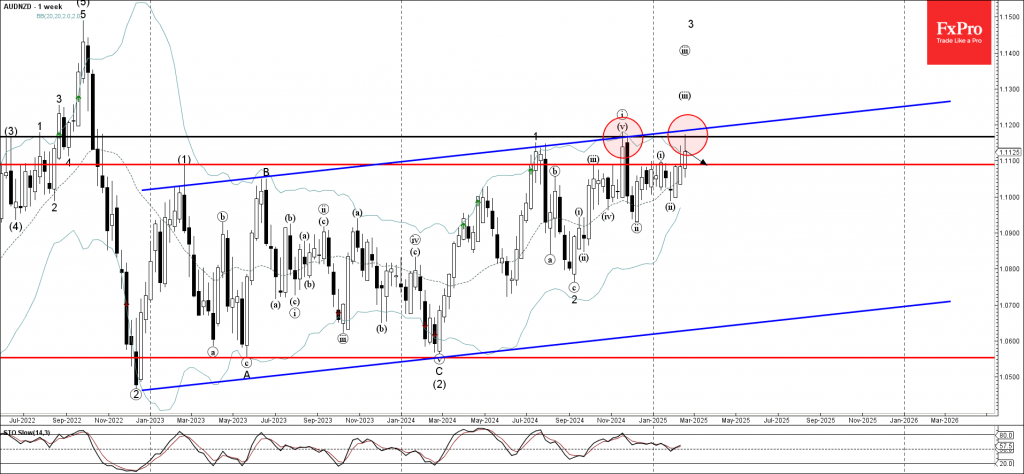
AUDNZD Wave Analysis
- AUDNZD reversed from the resistance zone
- Likely to fall to support level 1.1100
AUDNZD currency pair recently reversed from the resistance zone between the key resistance level 1.1165 (former monthly high from last November) and the resistance trendline of the wide weekly up channel from 2022.
This resistance zone was further strengthened by the upper daily and weekly Bollinger Bands.
Given the strength of the resistance level 1.1165, AUDNZD can be expected to fall to the next support level 1.1100.
Sunset Market Commentary
Markets
ECB executive board member Schnabel is the first to suggest that the direction of travel (of monetary policy) is not so clear anymore. She thinks that Frankfurt nears the point where it should start the discussion on pausing or halting rate cuts. Schnabel pointed out that an April rate cut is no longer fully priced in. Domestic inflation is still high and risks to the inflation outlook are somewhat skewed to the upside. She can’t say with confidence that monetary policy is still restrictive and suggests dropping that label from the policy statement at the March meeting. ECB president Lagarde hinted in the same direction at the January press conference. Schnabel downplayed the ECB study earlier this month on the level of neutral interest rates: “the ECB staff analysis that was published recently had one main message: we know that we know very little.” The theoretical concept of R* is therefore ill-suited to determine the appropriate policy stance. She also wanted to straighten out that the focus on the narrow 1.75%-2.25% outcome from the study was for models which estimated were available for Q4 2024. If you look at the R* estimates for the third quarter, you see that the range actually goes up all the way to 3%. Schnabel’s key message going forward is that maintaining price stability over the medium term is likely to require higher real rates in the future than before the pandemic. When talking about future ECB policy, she advocates one of the outcomes of the BoE’s Bernanke review: to make greater use of scenario analysis. Another key point is that the ECB should be more tolerate to both moderate downward and upward deviations from the 2% target and only act when there is a threat of de-anchoring. In between the lines, she suggests that the ECB might have overdone it in the past. Asset purchases for example have proven very effective in stabilizing markets, but haven been less beneficial and costlier than thought as a monetary policy instrument.
European bonds extend their underperformance today on the Schnabel comments. They add to the change of heart at ECB speak which based on language models examining policy statements, speeches,… started turning less dovish since the December policy meeting. EU swap rates add over 4 bps across the curve with German Bund yields climbing by up to 6 bps (5-yr). US Treasury yields on the contrary are broadly unchanged. The euro fails to profit from the yield differential with EUR/USD slipping from 1.0460 towards 1.0430 as European risk sentiment soured. Key European benchmarks drop over 1% after the EuroStoxx50 set a record high only last week. Tariff threats and disappointing earnings from a big US chemical player cause underperformance of industrials.
News & Views
The ECB today released EMU 2024 current account data. The euro zone current account surplus rose substantially last year to €419bn from €241bn. The rise in the nominal amount raised the surplus ratio in terms of GDP to 2.8% from 1.6% in 2023. The increase was mainly driven by a bigger surplus in the goods balance, rising from €256bn (1.6% of GDP) to €390bn (2.6% of GDP). The services balance showed a more modest rise from €123bn to €162bn (1.1% of GDP). The negative balance of the secondary income balance (redistribution of income via transfers for international aid and multilateral organizations, amongst others) declined slightly from -€170bn to -€165bn. The primary income balance was unchanged at €32bn. Regarding the financial account, EMU residents made net direct investments of €74bn. Non-residents divested net €102bn. Net purchases of non-euro area equity increased to €145bn, up from €89bn in 2023. Net purchases of non-euro area debt securities increased to €519bn, up from €380 bn. Non-residents’ net purchases of euro area equity increased to €350bn from €158bn in 2023. Over the same period, non-residents made net purchases of EMU debt securities amounting to €461bn, following net purchases of €398bn in 2023.
A survey of the Origo Group commissioned by the Swedish Riksbank mapping expectations among money market players, showed Swedish inflation expectations tentatively rising in February compared to January with the CPIF inflation at 1, 2 and 5 years rising to 1.9%, 2% and 2.2% respectively, all 0.1 ppt higher. Expectations for growth are also put higher at 2.2% for this year and 2.3% next year. Respondents anticipate the Riksbank policy rate to be higher in a medium term perspective (12 month 2.1% from 2%, 24 months 2.3% from 2% and 60 months 2.5% from 2.4%). The upward revision come as the Riksbank indicated that it could be at the end of its easing cycle.
UK Inflation Has Not Inspired Pound Buying
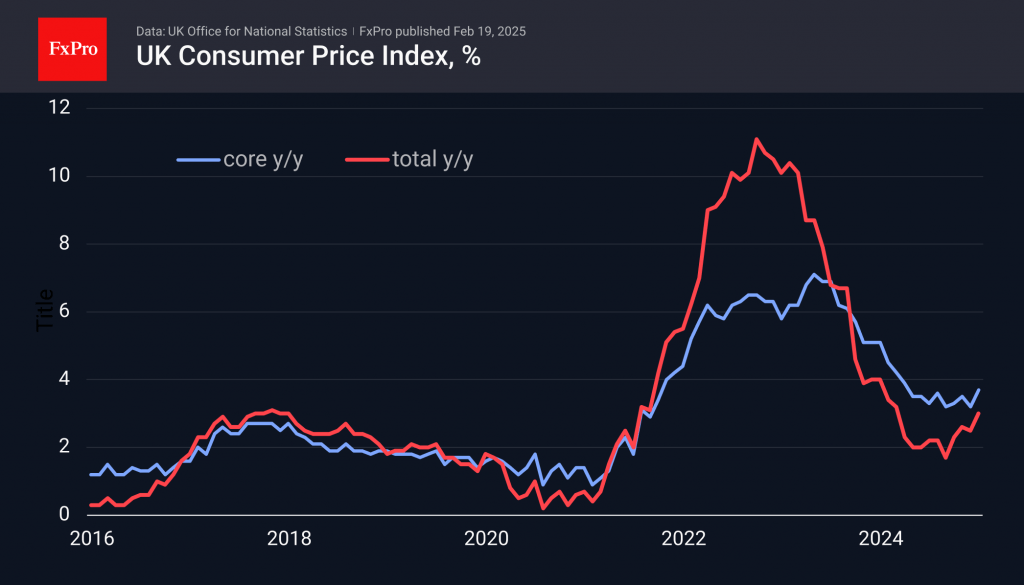
UK inflation is accelerating, reducing the scope for the Bank of England to ease monetary policy to support economic growth. Headline price growth accelerated to 3.0% in January, up from 2.5% at the end of last year and 1.7% in September – a couple of months after BoE’s rate cut kick-off. Even more striking was the acceleration in the core price index, which excludes volatile food and energy. Its annual rate of growth accelerated to 3.7% from 3.2% the previous month.
UK inflation has been above the 2% target for more than 40 months, which has entrenched elevated inflation expectations, and the monetary easing of recent months has added further fuel to the inflationary fire.
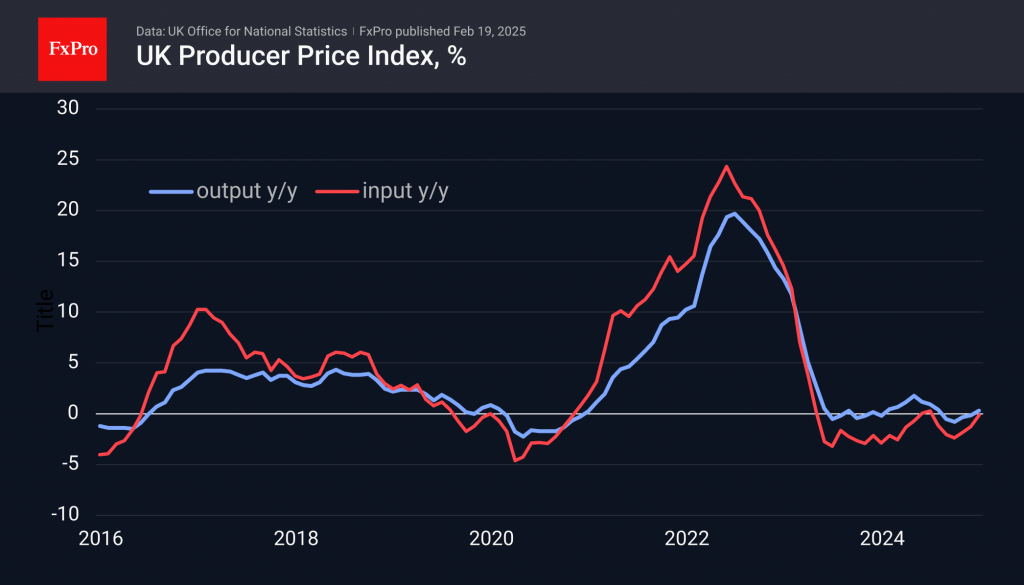
However, the acceleration in inflation has mainly been in final prices. The producer input price index has been in contractionary territory year-on-year in 19 of the last 20 months. Producer output prices are showing some increases but have also generally been barely above zero for a year and a half. They are clearly not the cause of the acceleration in final prices.
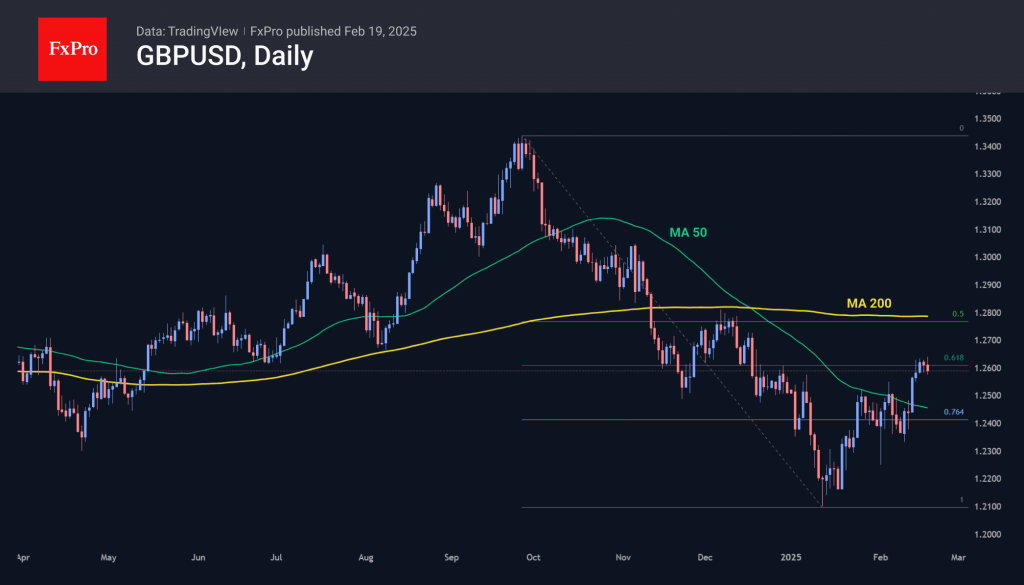
At first glance, the GBPUSD’s reaction to the better-than-expected data was unusual, with the pound falling below 1.2590 and testing the lows of this week’s range. But this dynamic is explained by the fact that the fresh data is unlikely to turn the Bank of England off the path of policy easing, as we can see in the US, where the Fed dramatically changed its rhetoric in response to signs of accelerating price growth. This means a reduction in the purchasing power of the pound, which hurts its exchange rate.
Technical factors are also working against the British currency these days. The 550 pips of appreciation in the GBPUSD over the past six weeks has resulted in a classic Fibonacci retracement of 61.8% of the decline since the end of September. A status quo in economic data increases the chances of a retest of the 1.2100 area in the coming weeks. Should the bears succeed, it opens the path to 1.13, where we have not seen the pound since late 2022.
USDJPY at Risk: Trend Reversal or Bearish Continuation?
Fundamental Analysis
Japanese Yen Strength
- The JPY remains supported by rising expectations that the Bank of Japan (BoJ) will continue its rate hike cycle.
- Recent statements from Governor Kazuo Ueda and Deputy Governor Himino reinforce the possibility of further adjustments if inflation and growth align with projections.
- The 10-year Japanese bond yield has reached levels not seen since 2010, reflecting expectations of a more restrictive monetary policy.
US Dollar Weakness & Policy Divergence
- The USD is under pressure due to expectations that the Federal Reserve (Fed) will maintain its current stance and eventually cut rates in 2025.
- The narrowing interest rate differential between Japan and the US has favoured capital flows into the JPY.
- The release of the FOMC minutes will be key in determining the USD/JPY direction, as they may provide clearer signals about the Fed’s future monetary policy.
Geopolitical Factors & Market Sentiment
- The recent meeting between US and Russian officials in Saudi Arabia to discuss the war in Ukraine could impact global risk perception.
- A delay in implementing new US tariffs has fueled a higher appetite for risk, limiting the JPY’s demand as a safe-haven asset.
- Despite these factors, the current USD/JPY trend suggests resistance to further upside while the BoJ continues tightening its policy.
Technical Analysis
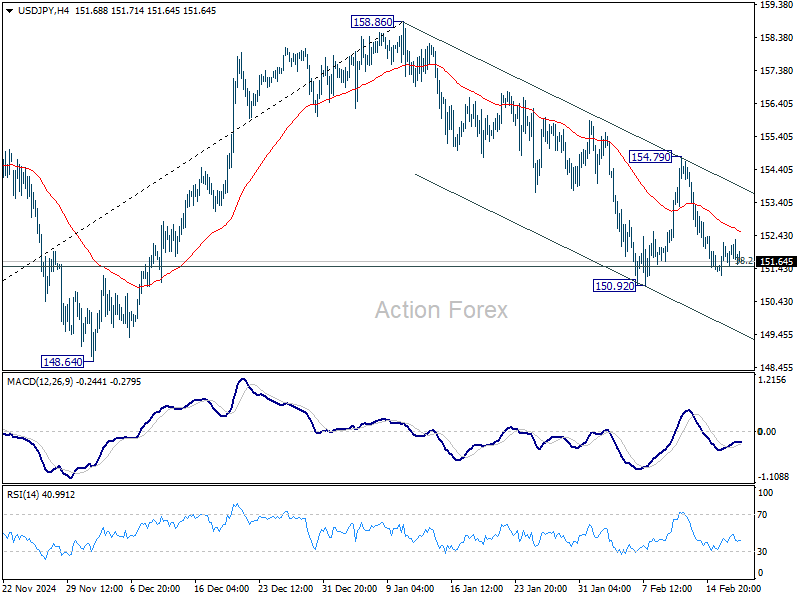
USD/JPY – H4
- Supply Zones (Sell): 152.64 // 154.22 // 155.25
- Demand Zones (Buy): 151.76
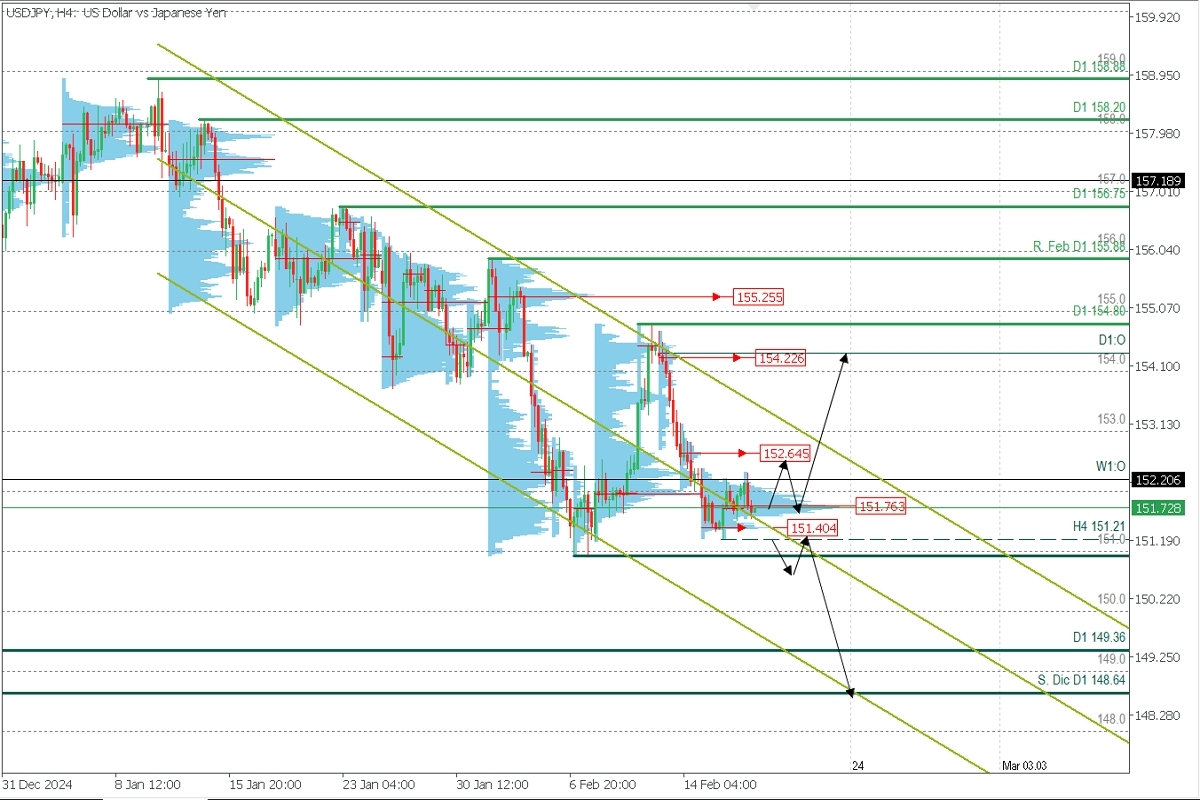
- The pair has been in a bearish phase since January, with the last validated daily resistance at the February high of 155.88.
- This structure is contained within a descending linear regression channel, with weekly volume concentrations at higher levels, confirming clear supply zones (sell).
- However, a moderate shift has been observed since last week when a lower POC formed around 151.96 and was slightly broken with minimal downside.
- Price consolidation around 151.76 suggests a potential reversal scenario.
- A decisive break above the upper channel limit would be the first sign of bullish exhaustion, confirmed by breaking the last validated daily resistance at 155.88.
- If the price drops below 151.00, the bullish scenario will be invalidated, and the 154.80 level (last validated daily resistance) will act as a reference for a potential trend shift.
Technical Summary
Bullish Scenario:
- Buy opportunities above the weekly volume concentration at 151.76, targeting the daily POC at 152.64, from where a pullback towards 151.76 may occur.
- A decisive break above 152.64 could extend the rally towards 154.00 and 154.22.
Bearish Continuation Scenario:
- A decisive break below 151.76 and 151.40 would signal stronger bearish control, confirmed by breaking the 151.21 support.
- In this case, selling pressure could extend towards 150.00 and 149.00, the December lows.
Always wait for the formation and confirmation of an Exhaustion/Reversal Pattern (ERP) on M5 before entering a trade in the key zones indicated.
Discovered POC:
- POC = Point of Control: The level or zone where the highest volume concentration occurred.
- If a bearish move originated from this level, it is considered a sell zone (resistance).
- If a bullish impulse originated from this level, it is considered a buy zone (support)
EUR/USD Mid-Day Outlook
Daily Pivots: (S1) 1.0425; (P) 1.0456; (R1) 1.0477; More...
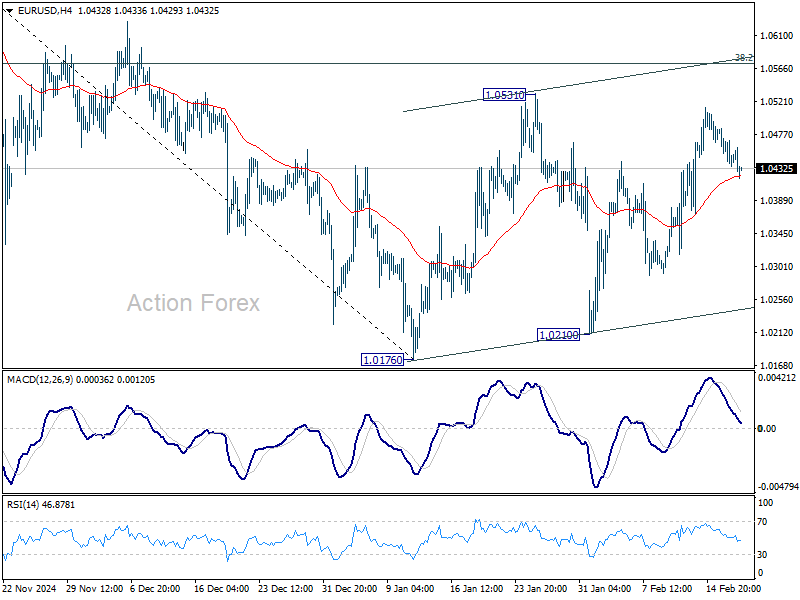
No change in EUR/USD's outlook as consolidation from 1.0176 is still extending. Intraday bias stays neutral for the moment. Stronger rebound might be seen but outlook will remain bearish as long as 38.2% retracement of 1.1213 to 1.0176 at 1.0572 holds. On the downside, break of 1.0176 will resume whole fall from 1.1213. However, decisive break of 1.0572 will raise the chance of reversal, and target 61.8% retracement at 1.0817.
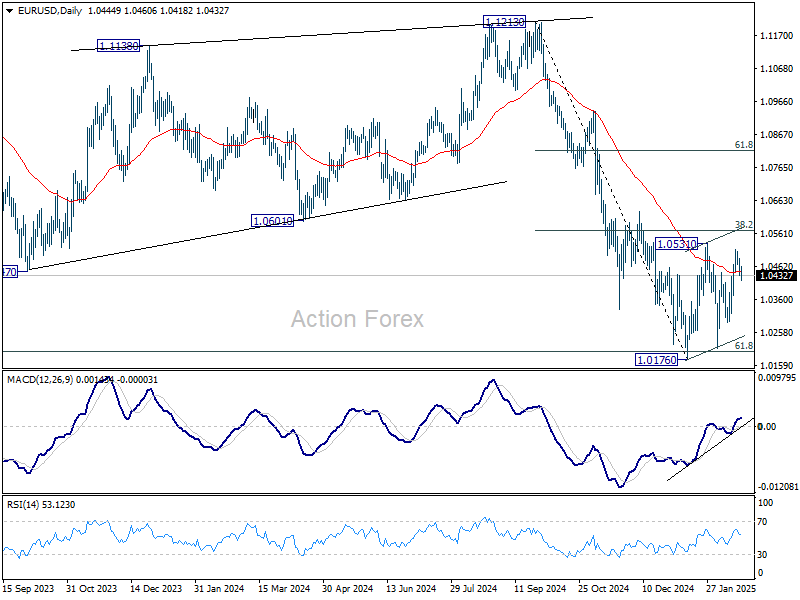
In the bigger picture, immediate focus is on 61.8 retracement of 0.9534 (2022 low) to 1.1274 (2024 high) at 1.0199. Sustained break there will solidify the case of medium term bearish trend reversal, and pave the way back to 0.9534. However, reversal from 1.0199 will argue that price actions from 1.1274 are merely a corrective pattern, and has already completed.
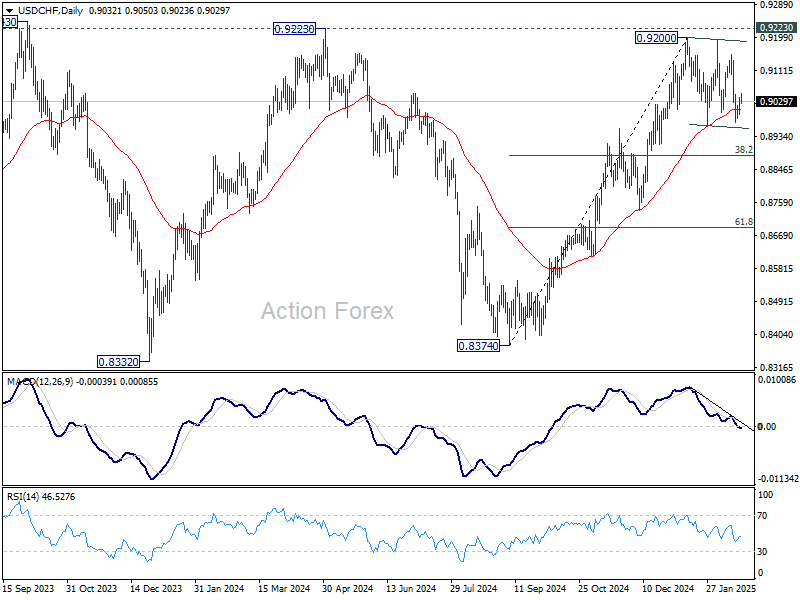
USD/CHF Mid-Day Outlook
Daily Pivots: (S1) 0.9006; (P) 0.9024; (R1) 0.9051; More…
No change in USD/CHF's outlook as consolidation from 0.9200 is still extending. While deeper pull back might be seen, outlook will stay mildly bullish as long as 38.2% retracement of 0.8374 to 0.9200 at 0.8884 holds. On the upside, firm break of 0.9223 key resistance will carry larger bullish implication. However, sustained break of 0.8884 will indicate bearish reversal, and target 61.8% retracement at 0.8690 instead.
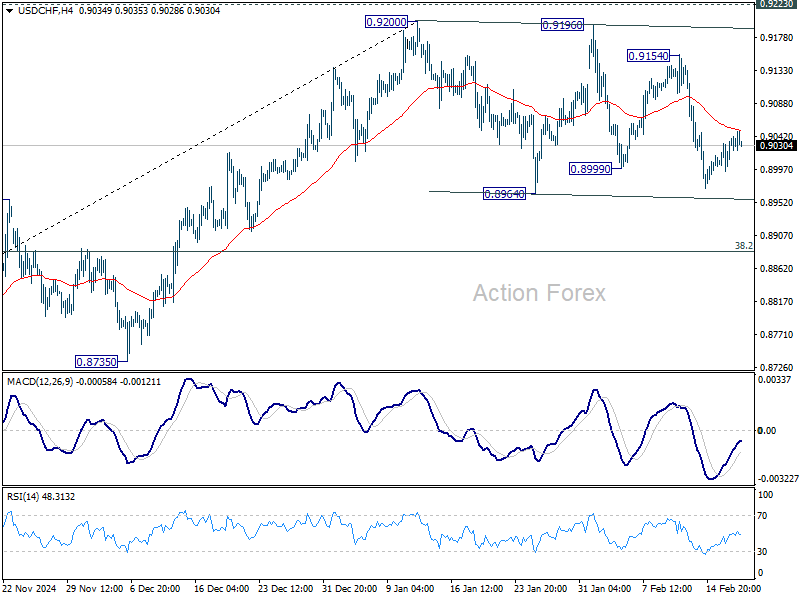
In the bigger picture, decisive break of 0.9223 resistance will argue that whole down trend from 1.0342 (2017 high) has completed with three waves down to 0.8332 (2023 low). Outlook will be turned bullish for 1.0146 resistance next. Nevertheless, rejection by 0.9223 will retain medium term bearishness for another decline through 0.8332 at a later stage.
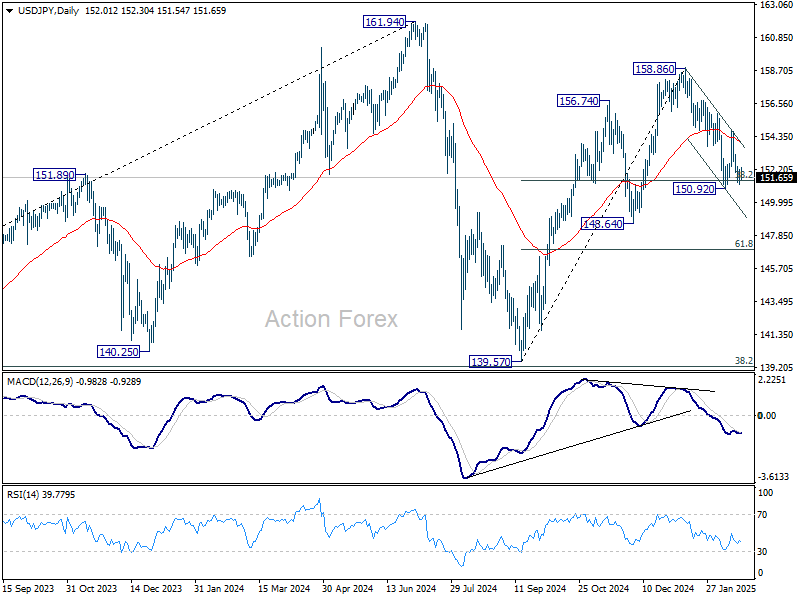
USD/JPY Mid-Day Outlook
Daily Pivots: (S1) 151.47; (P) 151.84; (R1) 152.45; More...
No change in USD/JPY's outlook and intraday bias stays neutral for the moment. Attention remains on 38.2% retracement of 139.57 to 158.86 at 151.4. Strong rebound from there will maintain near term bullishness. On the upside, break of 154.79 will revive the case that correction from 158.86 has completed at 150.29. Further rise should be seen to retest 158.86 high. However, break of 150.92 and sustained trading below 151.49 will raise the chance of trend reversal, and target 148.64 support instead.
In the bigger picture, price actions from 161.94 are seen as a corrective pattern to rise from 102.58 (2021 low). In case of another fall, strong support should be seen from 38.2% retracement of 102.58 to 161.94 at 139.26 to bring rebound. However, sustained break of 139.26 would open up deeper medium term decline to 61.8% retracement at 125.25.
GBP/USD Mid-Day Outlook
Daily Pivots: (S1) 1.2587; (P) 1.2609; (R1) 1.2637; More...
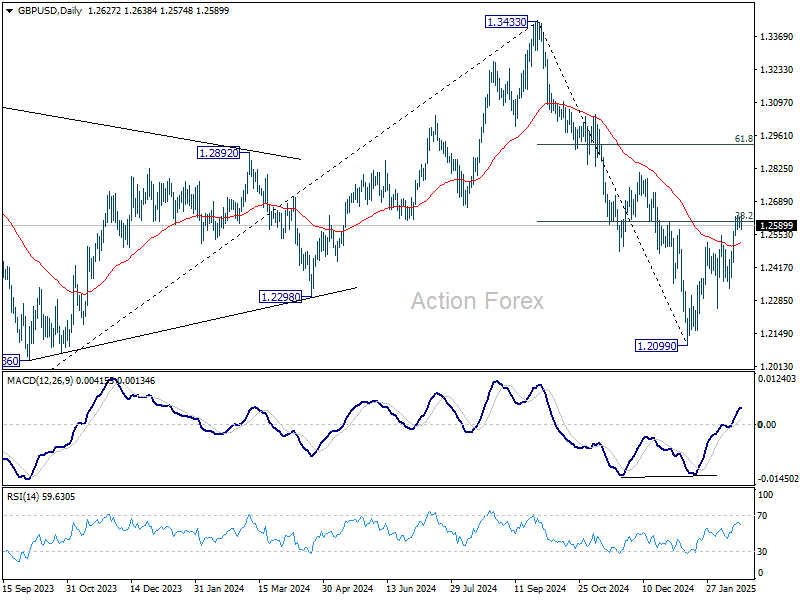
GBP/USD dips mildly today but stays in established tight range. Intraday bias remains neutral, and focus stays on 38.2% retracement of 1.3433 to 1.2099 at 1.2609. Rejection by this level will keep near term outlook bearish. Break of 1.2331 support will suggest that the rebound from 1.2099 has completed as a correction, and bring retest of 1.2099 low. However, firm break of 1.2609 will raise the chance of near term reversal, and target 61.8% retracement at 1.2923.
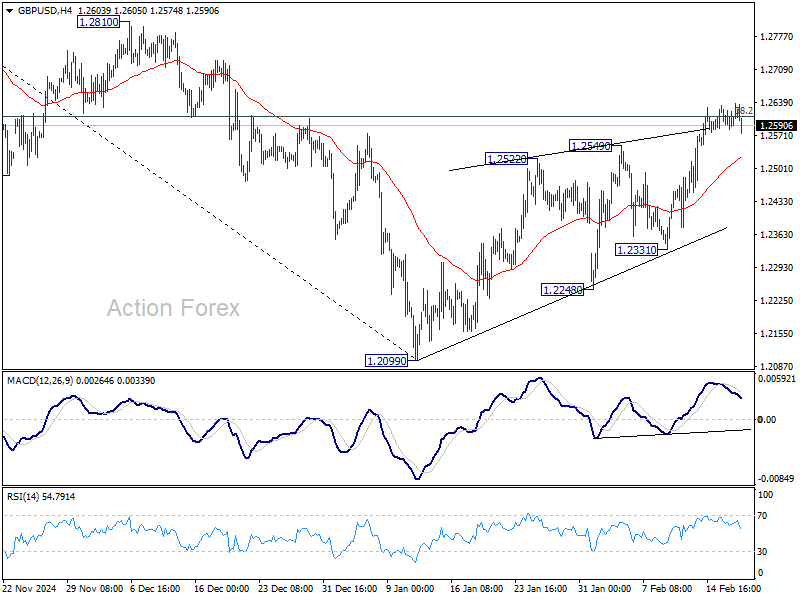
In the bigger picture, rise from 1.0351 (2022 low) should have already completed at 1.3433 (2024 high), and the trend has reversed. Further fall is now expected as long as 1.2810 resistance holds. Deeper decline should be seen to 61.8% retracement of 1.0351 to 1.3433 at 1.1528, even as a corrective move. However, firm break of 1.2810 will dampen this bearish view and bring retest of 1.3433 high instead.
Sterling Unmoved by CPI Surprise, Gold to Try 3000 Again ahead of FOMC Minutes
The forex markets remain rather indecisive today. Traders are paring back expectations for BoE rate cuts after UK inflation surged to a 10-month high. A March rate cut is now off the table, and markets are no longer fully pricing in two BoE cuts this year. However, this shift has provided only minimal support for the British pound, as broader market sentiment remains cautious.
Meanwhile, Dollar is mildly firmer but lacks strong upside momentum. Traders are now focused on FOMC minutes, which are expected to reaffirm that Fed is in no rush to cut rates. Current Fed funds futures show a 55% probability that rates will remain at 4.25-4.50% through the first half of 2025, a view that is unlikely to change much without further clarity on President Donald Trump’s fiscal and trade policies.
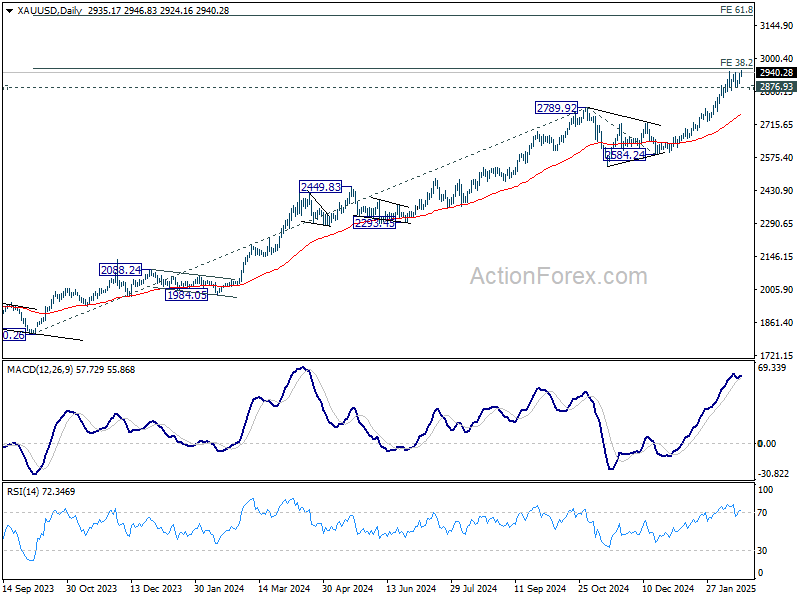
In the commodities market, Gold surged to a record high, approaching the critical 3000 psychological level for another attempt. This marks a key inflection point—a decisive break above 3,000 could pave the way to 61.8% projection of 1810.26 to 2789.92 from 2584.24 at 3189.66.
However, failure to sustain gains above 3000 could lead to deeper pullback. Firm break 2876.93 support should set up correction back towards 2789.92 resistance turned support instead.
In Europe, at the time of writing, FTSE is down -0.61%. DAX is down -1.16%. CAC is down -0.84%. UK 10-year yield is up 0.0696 at 4.629. Germany 10-year yield is up 0.058 at 2.558. Earlier in Asia, Nikkei fell -0.27%. Hong Kong HSI fell -0.14%. China Shanghai SSE rose 0.81%. Singapore Strait Times rose 0.22%. Japan 10-year JGB yield rose 0.0038 to 1.440.
ECB’s Schnabel: Rate Cut Pause May Be Approaching
ECB Executive Board member Isabel Schnabel suggested in an FT interview that the central bank is approaching a point where it “may have to pause or halt” rate cuts.
While she refrained from making a firm prediction for upcoming policy meetings, she acknowledged that the ECB needs to “start that discussion”.
Schnabel highlighted that the degree of monetary restriction "has come down significantly", to the extent that policymakers can “no longer say with confidence” that ECB’s stance remains restrictive.
She defended the ECB’s gradual and cautious approach, arguing that domestic inflation remains high, wage growth is still elevated, and energy price shocks continue to impact inflation expectations.
ECB's Panetta: Eurozone economic weakness more persistent than expected
Italian ECB Governing Council member Fabio Panetta acknowledged that economic weakness in the Eurozone is proving “more persistent than we expected”, as the long-anticipated consumption-driven recovery has yet to materialize.
After two consecutive quarters of stagnation, he noted that "tensions in the manufacturing sector, employment is giving signs of weakening"
Panetta also highlighted the downside risks to inflation stemming from weak growth. However, he also noted that upside inflation risks remain, primarily from energy costs.
UK CPI surges to 3.0%, highest since March 2024
UK headline CPI accelerated to 3.0% yoy in January, up from 2.5% yoy and exceeding market expectations of 2.8% yoy. This marks the highest inflation level since March 2024, reinforcing concerns that price pressures remain persistent.
Core inflation also surged, with CPI excluding energy, food, alcohol, and tobacco rising to 3.7% yoy, up from 3.2% yoy in December.
Meanwhile, CPI goods inflation edged higher from 0.7% yoy to 1.0% yoy, while CPI services inflation climbed from 4.4% yoy to 5.0% yoy.
RBNZ cuts by 50bps, signals further easing through 2025
RBNZ cut the Official Cash Rate (OCR) by 50bps to 3.75%, as widely expected, while maintaining a clear easing bias.
The central bank stated that "if economic conditions continue to evolve as projected, the Committee has scope to lower the OCR further through 2025." According to the latest projections, the OCR is expected to decline to 3.1% by year-end and remain at that level until early 2028.
RBNZ acknowledged that economic activity remains subdued, though it expects growth to recover in 2025, driven by lower interest rates encouraging spending. However, elevated global economic uncertainty is likely to weigh on business investment. The bank also noted that inflation is expected to be volatile in the near term, influenced by a weaker exchange rate and higher petrol prices.
Regarding global risks, the RBNZ flagged concerns and warned that higher global tariffs could slow growth in key trading partners, dampening demand for New Zealand exports and weakening domestic economic momentum over the medium term.
However, the impact on inflation is "ambiguous", depending on factors such as trade diversion, supply-chain adjustments, and financial market reactions.
Australian wages growth slow 0.7% qoq, pressures easing
Australia’s wage price index rose 0.7% qoq in Q4, marking a slowdown from 0.9% qoq and missing expectations of 0.8% qoq. This matches the lowest quarterly growth since March 2022, reinforcing signs that wage pressures are easing, albeit still elevated.
On an annual basis, wages increased 3.2% yoy, making it the slowest pace since Q3 2022. Private sector wage growth came in at 3.3% yoy, the weakest since Q2 2022. Public sector wages rose 2.8% yoy, falling below 3% for the first time since Q2 2023.
BoJ’s Takata: Gradual policy shifts should continue beyond January hike
BoJ Board Member Hajime Takata emphasized the need for the central bank to continue to "implement gear shifts gradually, even after the additional rate hike decided in January 2025", to mitigate the risk of rising prices and financial market overheating.
Takata noted in a speech today that as "positive corporate behavior" persists, BoJ should consider a “further gear shift” in policy.
He highlighted three key risks that could drive prices above BoJ’s baseline scenario: a stronger wage-price cycle, inflationary pressures from domestic factors, and market volatility, especially in the exchange rates, stemming from a recovery in the US economy.
Nevertheless, due to uncertainties surrounding the US economy and the challenge of identifying the neutral interest rate, Takata advocated for a “vigilant approach”.
Japan’s trade deficit widens as imports surge, exports to China drop
Japan’s trade deficit expanded sharply in January, reaching JPY -2.759T, the largest shortfall in two years, as imports surged 16.7% yoy, far exceeding the expected 9.3% yoy gain.
Meanwhile, exports rose 7.2% yoy, falling slightly short of the 7.7% yoy forecast, with strong shipments to the U.S. (+18.1% yoy) offset by a -6.2% yoy decline in exports to China.
On a seasonally adjusted basis, exports declined -2.0% mom to JPY 9.253T, while imports climbed 4.7% mom to JPY 10.109T, leading to a JPY -857B trade deficit.
GBP/USD Mid-Day Outlook
Daily Pivots: (S1) 1.2587; (P) 1.2609; (R1) 1.2637; More...
GBP/USD dips mildly today but stays in established tight range. Intraday bias remains neutral, and focus stays on 38.2% retracement of 1.3433 to 1.2099 at 1.2609. Rejection by this level will keep near term outlook bearish. Break of 1.2331 support will suggest that the rebound from 1.2099 has completed as a correction, and bring retest of 1.2099 low. However, firm break of 1.2609 will raise the chance of near term reversal, and target 61.8% retracement at 1.2923.
In the bigger picture, rise from 1.0351 (2022 low) should have already completed at 1.3433 (2024 high), and the trend has reversed. Further fall is now expected as long as 1.2810 resistance holds. Deeper decline should be seen to 61.8% retracement of 1.0351 to 1.3433 at 1.1528, even as a corrective move. However, firm break of 1.2810 will dampen this bearish view and bring retest of 1.3433 high instead.