
Sample Category Title
UK Inflation Jumps to 3%, Pound Eyes FOMC Minutes
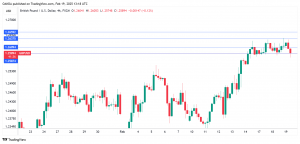
The British pound continues to have an uneventful week. In the European session, GBP/USD is trading at 1.2595, down 0.13% on the day.
UK inflation hits 3% in January
Consumer inflation in the UK rose to 3% y/y in January, a sharp rise from the 2.5% gain in December and higher than the market estimate of 2.8%. This was the highest level since March 2024 and was driven by price increases in transportation, fuel and food. Monthly, CPI decreased by 0.1%, following a 0.4% gain in December and above the market estimate of -0.3%.
It was a similar story for core CPI, which rose to 3.7% y/y from 3.2% in December, in line with expectations and its fastest pace since April 2024. Monthly, core CPI decreased 0.4%, down from a 0.3% gain in December but above the market estimate of -0.3%. Services inflation, which has been stubbornly high is carefully monitored by the Bank of England, rose to 5% from 4.4% but was below the Bank of England’s forecast of 5.2%.
The jump in headline and core inflation along with strong wage growth data earlier in this week will be a major headache for the BoE. Inflation is likely to accelerate, with an increase in employer taxes kicking in on April 1. The BoE meets next on March 20 and is unlikely to deliver a second straight rate cut. Governor Andrew Bailey said last week that the UK economy remains “quite static” and the BoE wants to continue lowering rates in order to boost the flagging economy, but containing inflation remains the central bank’s number one priority.
The Federal Reserve releases the minutes of the Jan. 29 in which the Fed maintained the benchmark rate. At the meeting, members reiterated that the Fed would remain patient in its rate path and make decisions based on the data.
GBP/USD Technical
- GBP/USD has pushed below support at 1.2609 and is testing support at 1.2587. Below, there is support at 1.2559
- 1.2637 and 1.2659 are the next resistance lines
Gold to Extend Rally as Market Conditions Remain Favourable
Gold remains steady at 2,930 USD per troy ounce on Wednesday, hovering near last week’s record high of 2,940 USD. Ongoing concerns over US trade tariffs and global uncertainties continue to drive demand for safe-haven assets.
Key factors driving Gold prices
- Escalating US trade tensions – On Tuesday, US President Donald Trump announced plans to impose 25% tariffs on automobiles, further escalating global trade disputes. Additional tariffs on semiconductors and pharmaceuticals have also been proposed, intensifying market concerns. Last week, Trump suggested these auto tariffs could take effect by 2 April.
- US foreign policy shifts – Reports indicate that the White House may be considering lifting sanctions on Russia as part of diplomatic negotiations, adding to global market uncertainty.
- Federal Reserve’s cautious stance – San Francisco Fed President Mary Daly reiterated that inflation remains uneven, supporting the Fed’s view that interest rates should remain unchanged for now. This aligns with the Fed’s earlier signals of maintaining a tight monetary policy, which could keep long-term inflation risks alive, indirectly supporting Gold prices.
- Increased bullion demand – Gold shipments from Singapore to the US surged to a three-year high in January, indicating potential disruptions in bullion trading due to price differentials. This signals strong demand and market inefficiencies, contributing to rising gold prices.
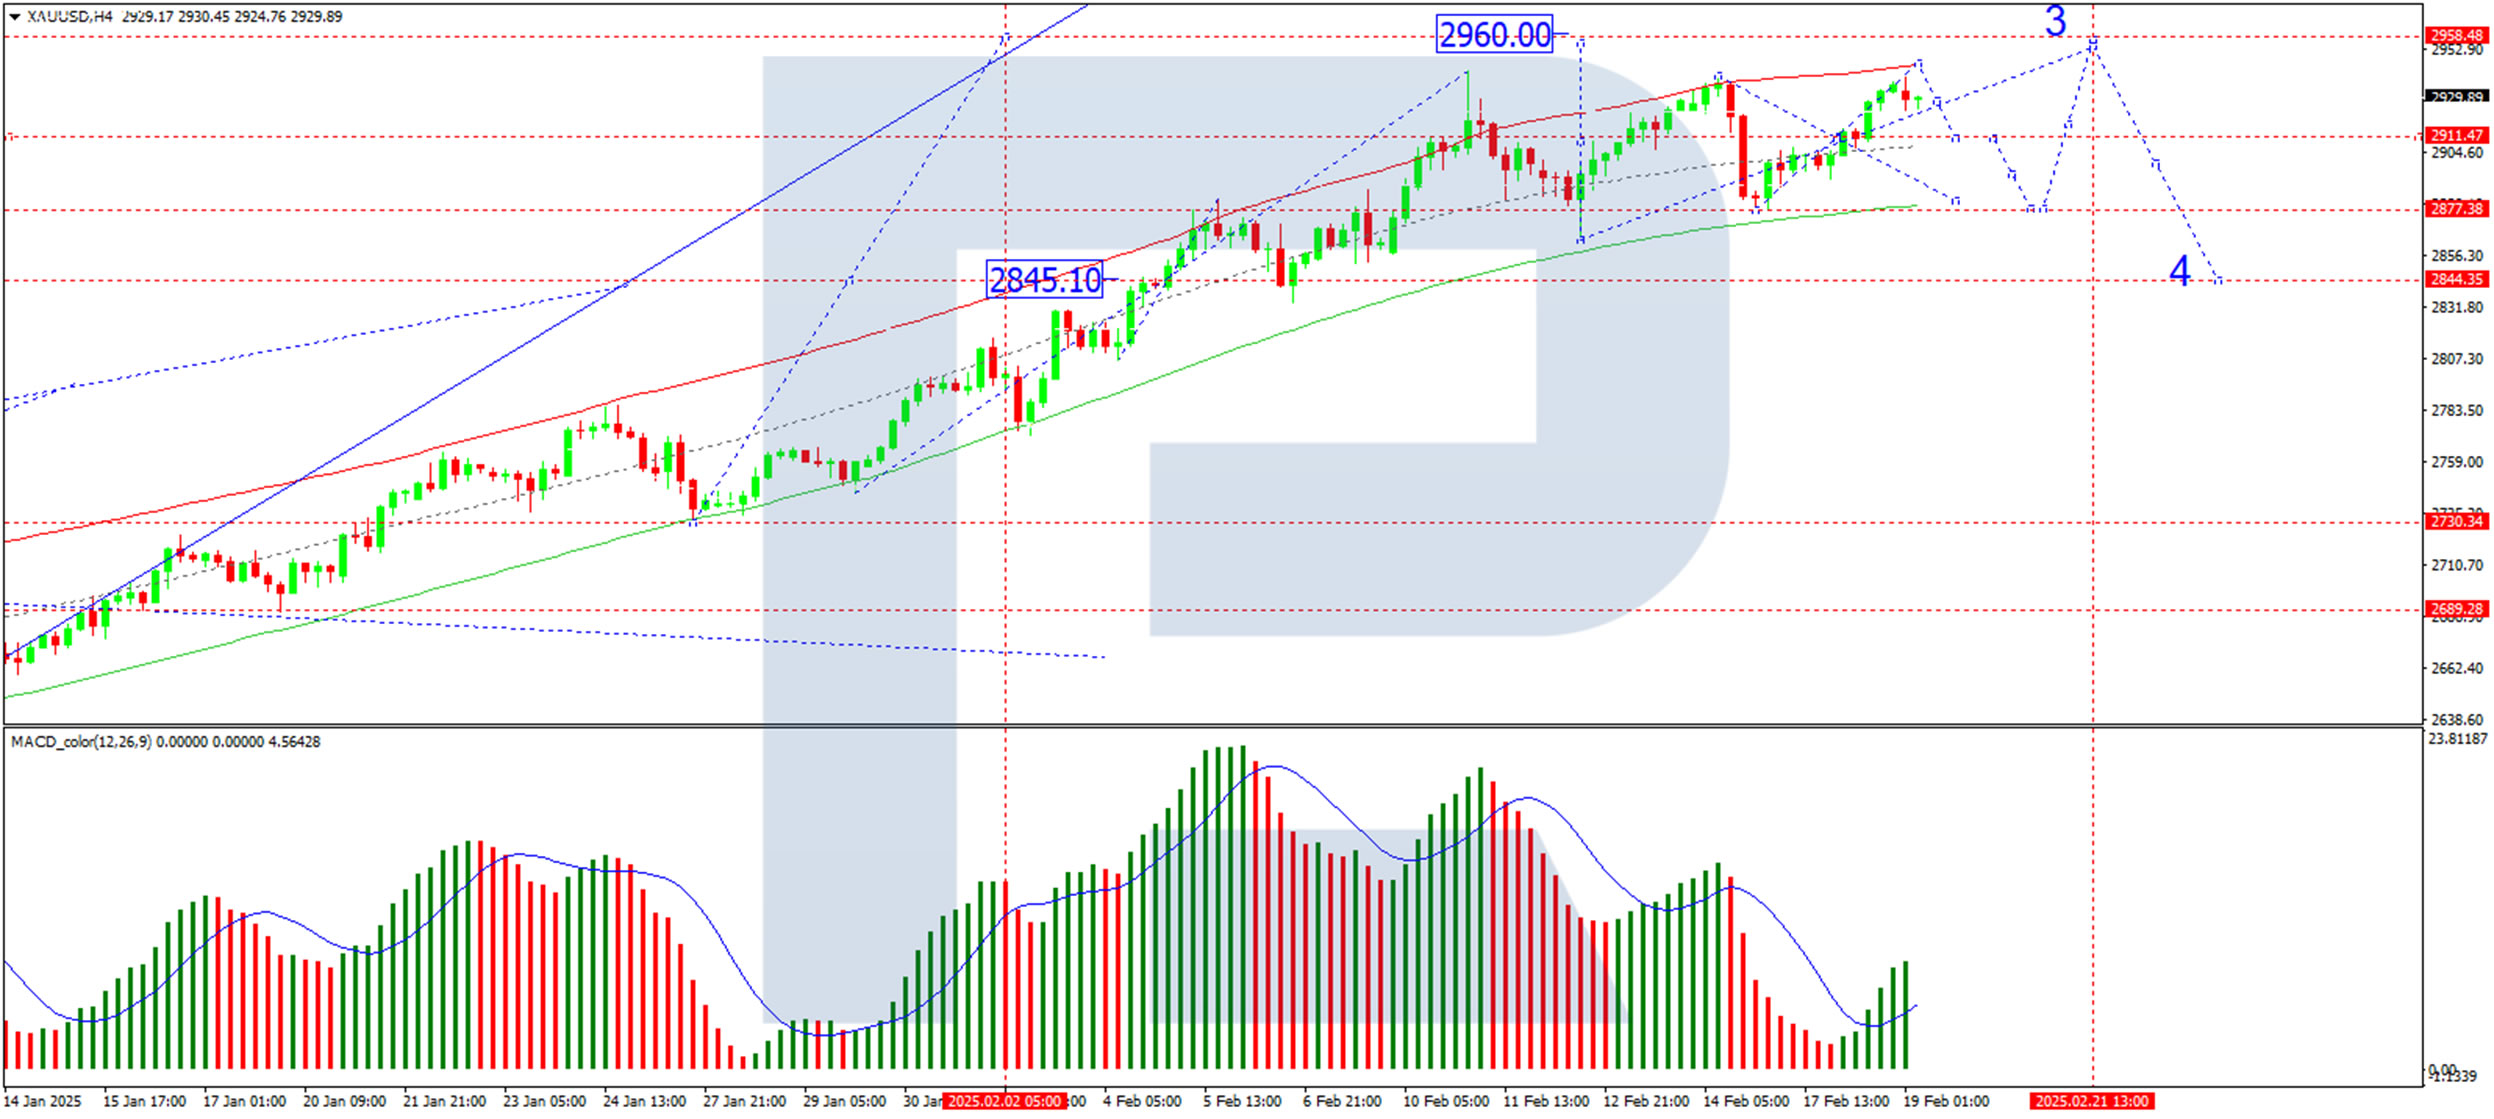
Technical analysis of XAU/USD
On the H4 chart, Gold has formed a consolidation range around 2,911 USD, extending its gains to 2,939 USD. A short-term pullback to 2,911 USD (testing support from above) is possible before the next rally. If Gold breaks higher, the next target will be 2,960 USD. After reaching this level, a correction towards 2,844 USD could follow. The MACD indicator supports this scenario, with its signal line above zero and sharply upwards, confirming strong bullish momentum.
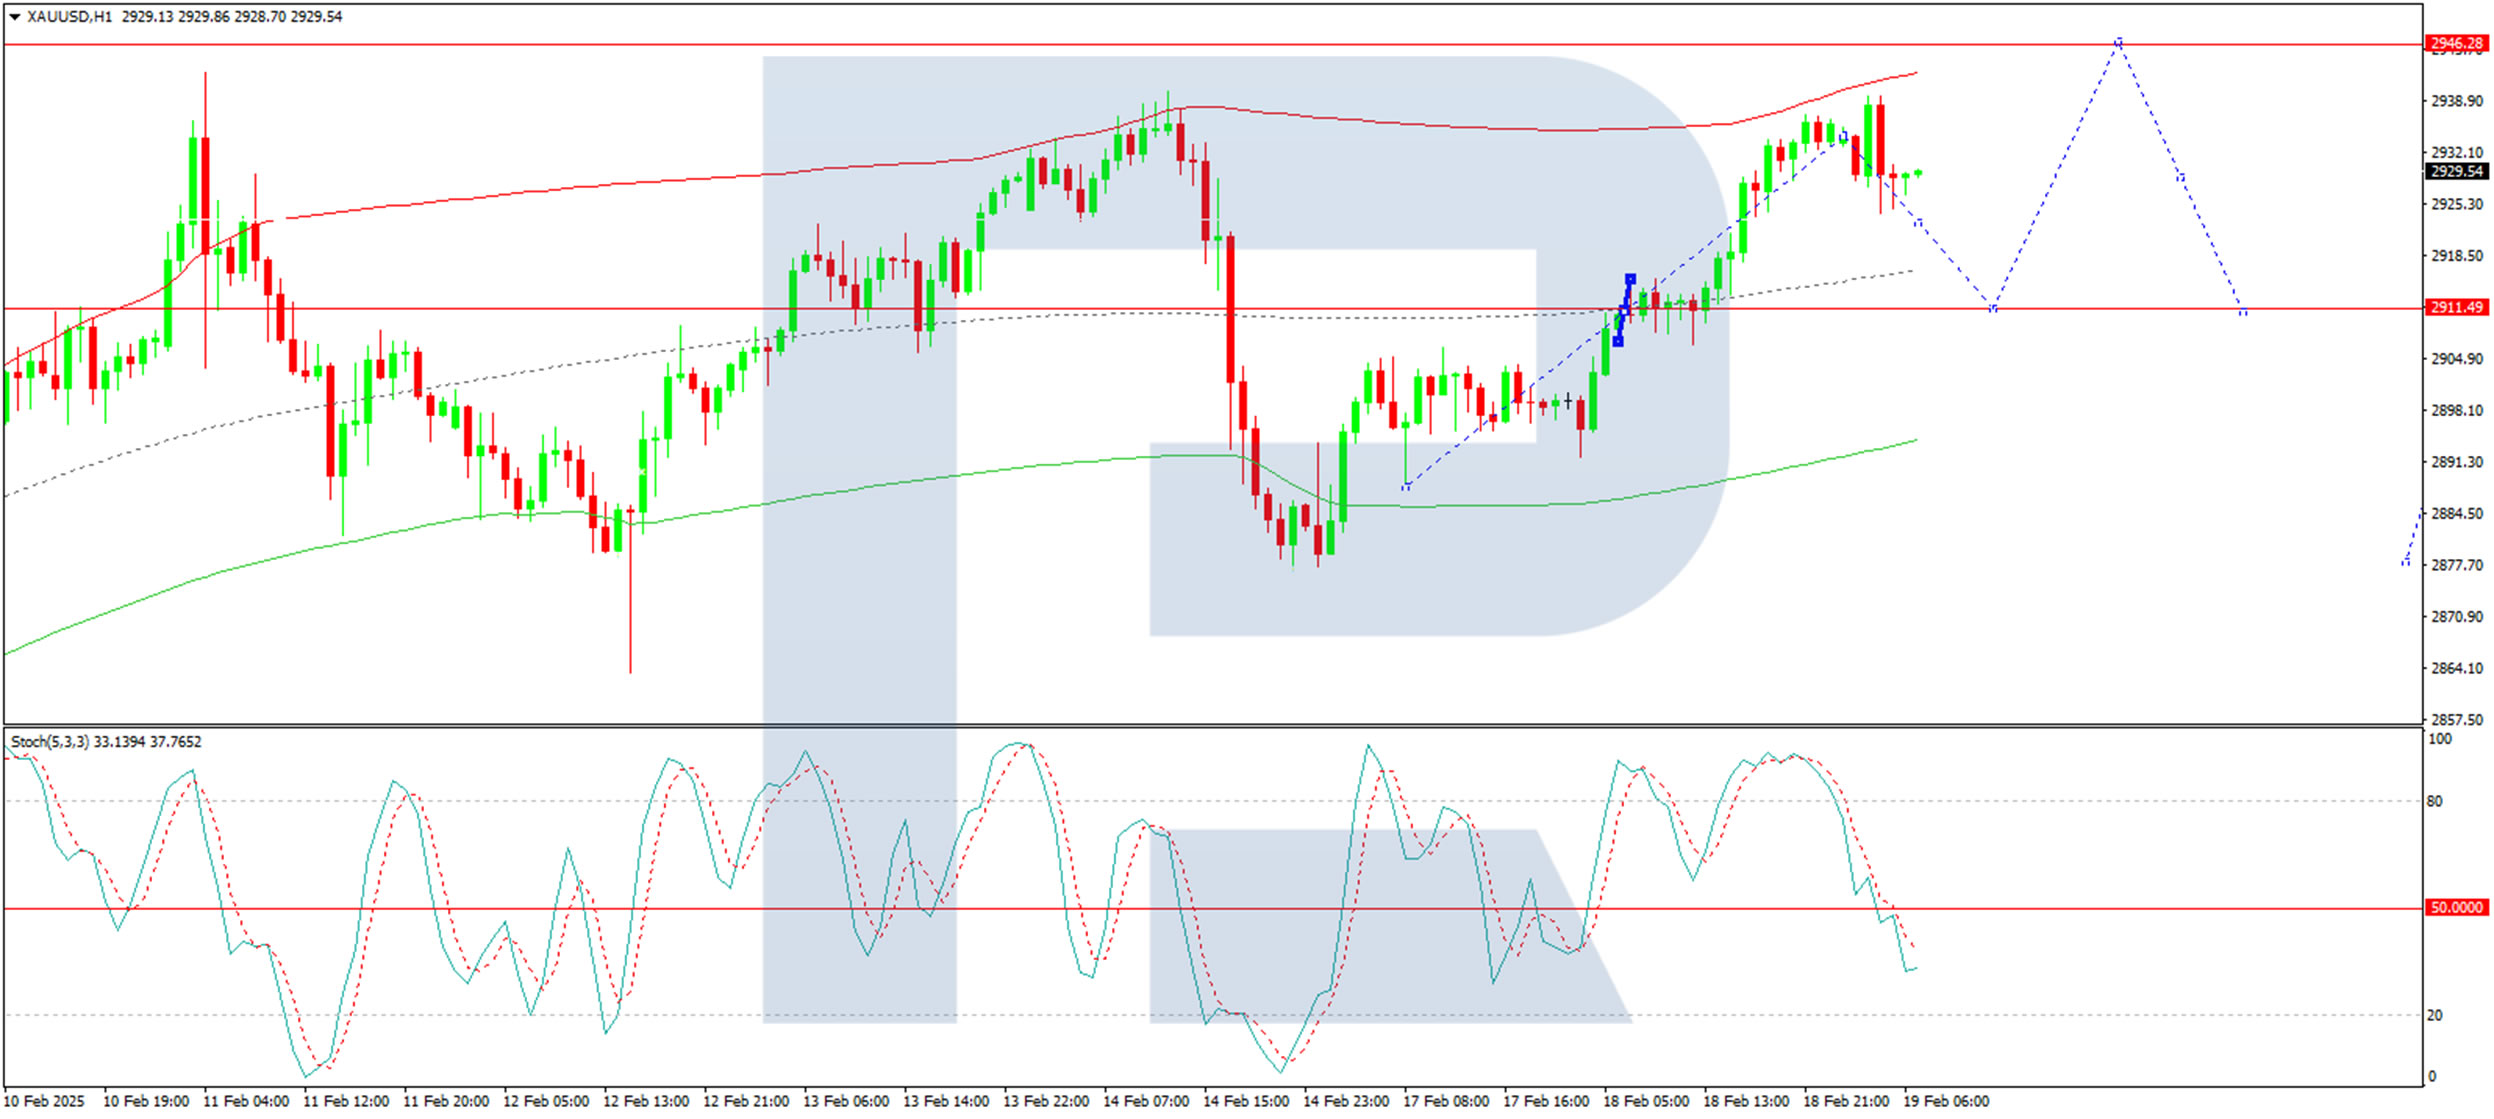
On the H1 chart, Gold is forming a growth wave towards 2,946 USD. After reaching this level, a minor correction to 2,911 USD could occur before a new bullish wave extends towards 2,960 USD. The Stochastic oscillator confirms this outlook, with its signal line below 50 and trending towards 20, indicating a potential correction before the next leg higher. A subsequent rebound towards 80 would confirm further upside potential.
Conclusion
Gold maintains a firmly bullish outlook, supported by geopolitical risks, trade war concerns, and strong demand. While short-term corrections are likely, technical indicators support a continued rally towards 2,960 USD. Traders will closely monitor further developments in US trade policy and Fed monetary signals, as these will shape the next move in Gold prices.
ECB’s Schnabel: Rate Cut Pause May Be Approaching
ECB Executive Board member Isabel Schnabel suggested in an FT interview that the central bank is approaching a point where it “may have to pause or halt” rate cuts.
While she refrained from making a firm prediction for upcoming policy meetings, she acknowledged that the ECB needs to “start that discussion”.
Schnabel highlighted that the degree of monetary restriction "has come down significantly", to the extent that policymakers can “no longer say with confidence” that ECB’s stance remains restrictive.
She defended the ECB’s gradual and cautious approach, arguing that domestic inflation remains high, wage growth is still elevated, and energy price shocks continue to impact inflation expectations.
RBNZ Lowers Rates by 50 bps, NZ Dollar Gains Ground
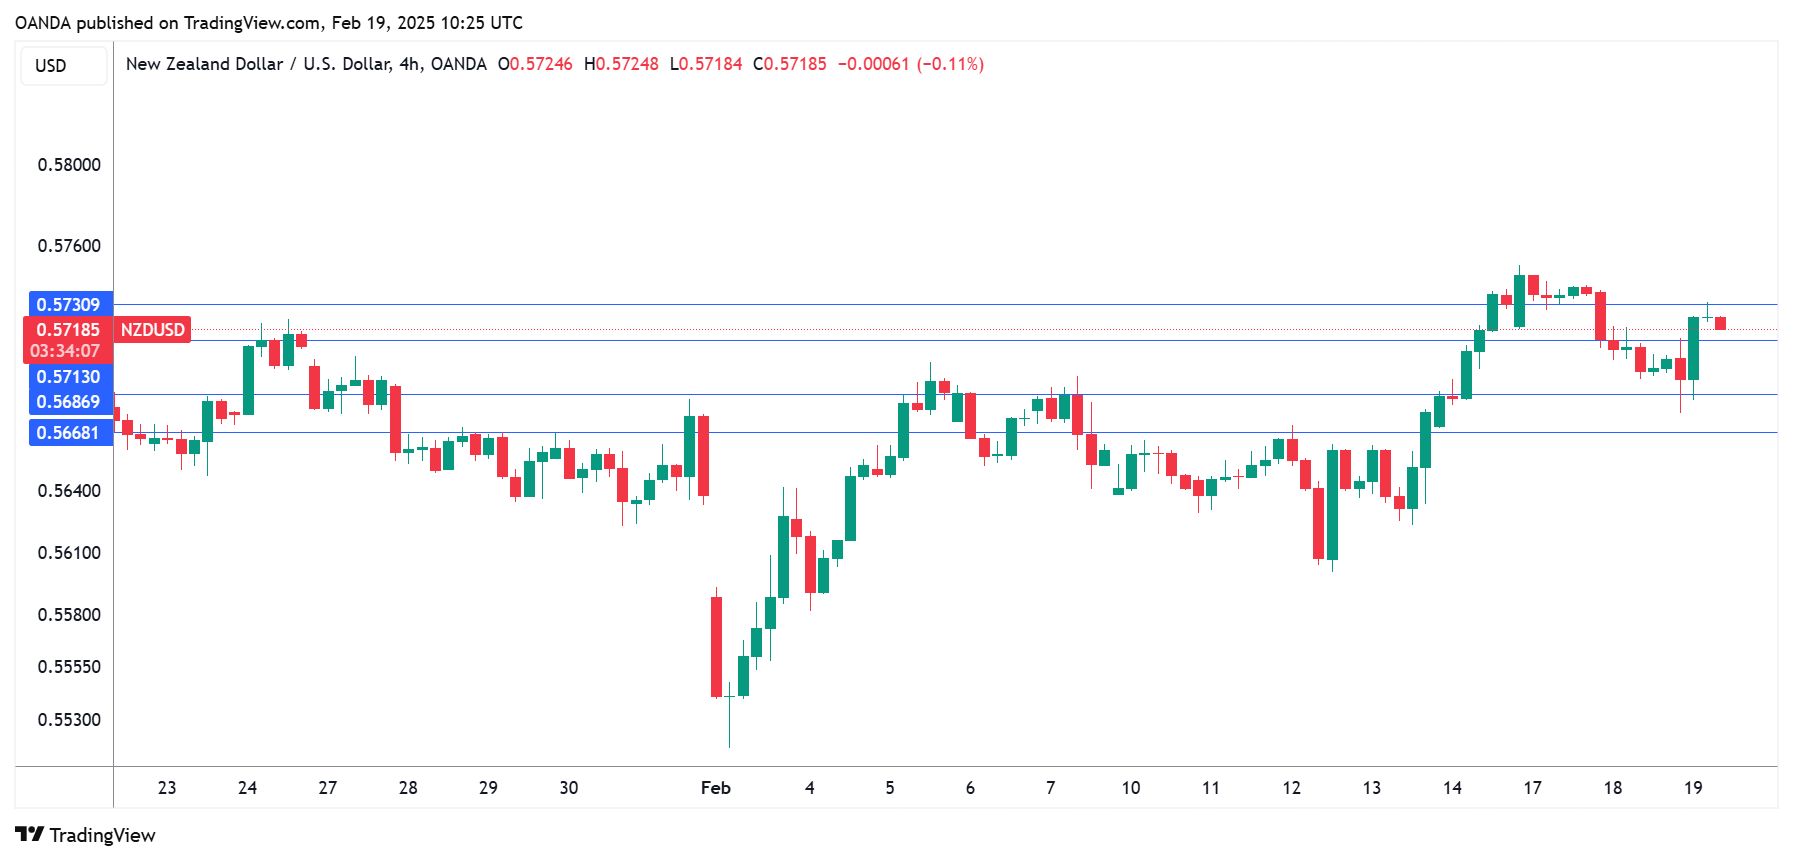
The New Zealand dollar has posted gains on Wednesday. NZD/USD is trading at 0.5721 in the European session, up 0.31% on the day.
RBNZ chops rates by 50 bps as expected
The Reserve Bank of New Zealand slashed the cash rate by 50 basis points, bringing the cash rate to 3.75%. The markets had priced in the cut at 90% so there was no surprise at the jumbo cut. This lowered the cash rate to its lowest level since Nov. 2o22. The RBNZ demonstrated again that it can be aggressive, as it has cut rates by 175 basis points since the easing cycle started last August.
The New Zealand dollar is stronger on Wednesday, which is somewhat surprising, given the jumbo rate cut and the RBNZ’s signal that further rate cuts are on the way in the coming months.
The rate statement noted that the members were confident lowering rates as CPI remained near the midpoint of the 1%-3% target band. At the same time, members expressed concern that economic activity in New Zealand and abroad were “subdued” which posed a risk to economic growth.
The statement also made a brief mention of “trade restrictions” which could dampen economic growth. No mention was made of US President Trump’s tariff threats but policymakers are clearly concerned that US tariffs, even if not aimed directly at New Zealand, could chill the global economy and hurt the country’s key export sector.
In a follow-up press conference, Governor Adrian Orr said that the Bank expected to lower the cash rate to 3% by the end of the year. This forecast was lower than the November projection of 3.2% by year’s end. The central bank is expected to deliver smaller rate cuts of 25-bps in the coming months.
NZD/USD Technical
- NZD/USD is testing resistance at 0.5713. Above, there is resistance at 0.5731
- 0.5686 and 0.5668 and the next support levels
USD/JPY: No Relief in Sight Yet
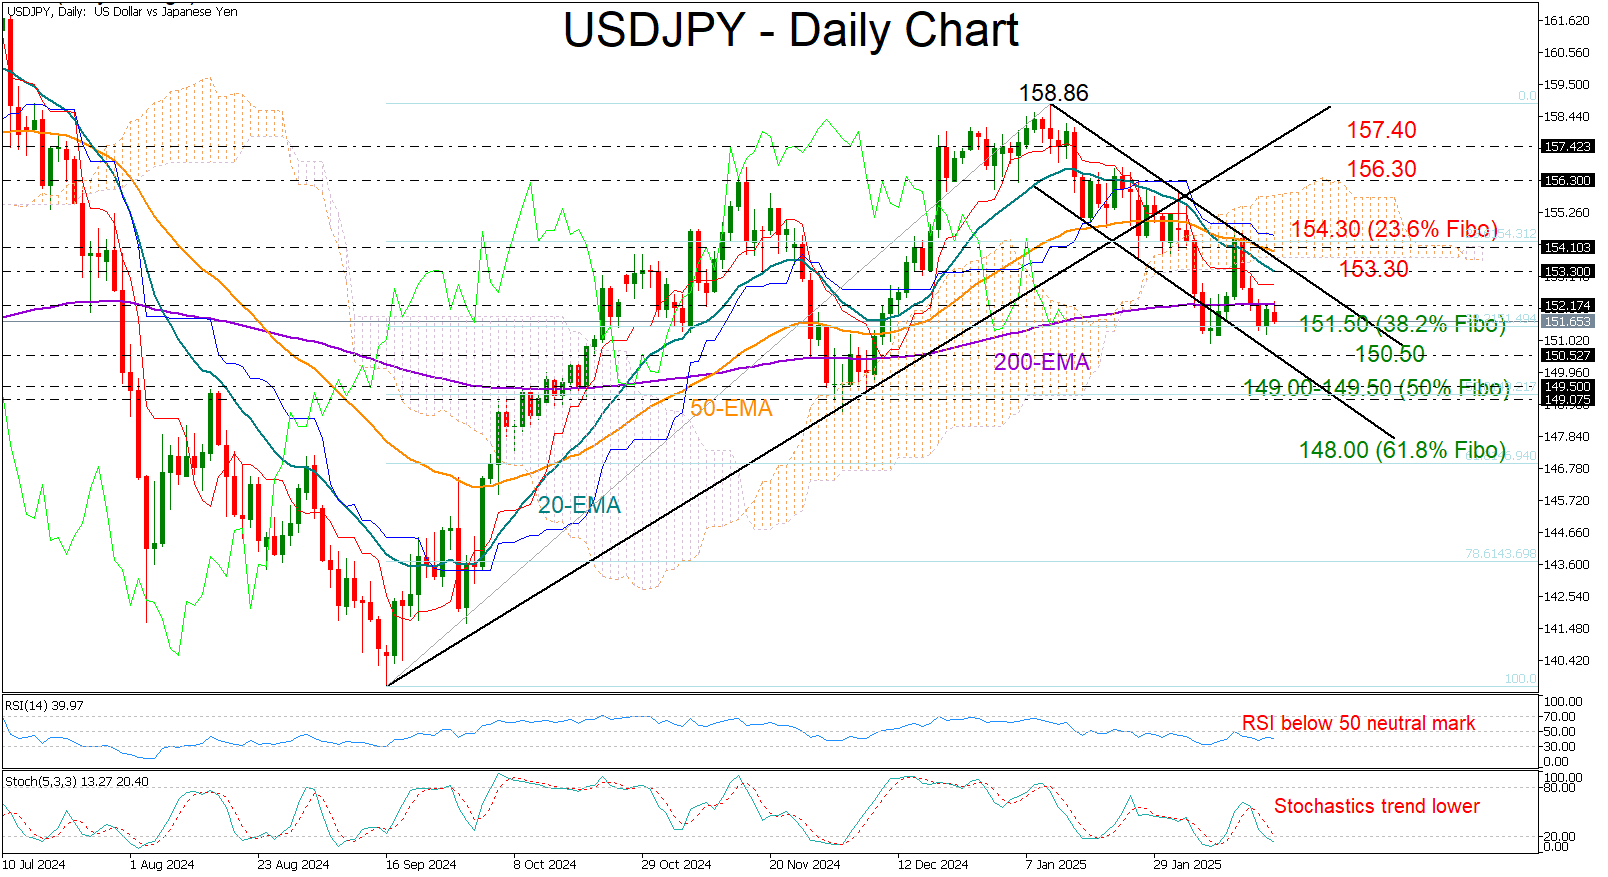
- USD/JPY stuck within 151.50-152.20 area.
- Technical signals suggest bearish risks are alive.
USD/JPY has been treading water in a tight range this week, holding between the 200-day exponential moving average (EMA) near 152.20 and the 151.50 support level after a sharp drop from the 154.30 resistance zone. The outlook remains fragile, with technical indicators signaling further downside risks.
At the moment, there’s little to get excited about from a technical perspective. The price has dipped below the Ichimoku cloud, and the 20- and 50-day EMAs are locked in a bearish crossover, endorsing the negative trajectory in the market. Additionally, the RSI remains clearly below its 50 neutral mark, while the stochastic oscillator is edging into oversold territory - both indicating that selling pressures could persist in the near term.
If the 151.50 level gives way – aligned with the 38.2% Fibonacci retracement of the September-January rally - the pair could quickly test the next line of defense around 150.50. Should that also fail to hold, the 149.00-149.50 area, where the pair staged a strong rebound in December, could become the next battleground. A break below this zone would open the door to a steeper drop towards the 61.8% Fibonacci retracement at 148.00.
On the flip side, a successful break above the 200-day EMA could re-challenge the resistance area of 153.30-154.30. This area is packed with obstacles, including the 20- and 50-day EMAs, the Ichimoku cloud’s lower band, the 23.6% Fibonacci level, and a downward-sloping trendline from January’s peak. Hence, a decisive close above this zone could reignite buying interest, propelling the pair to the next barrier near 156.40. Any further upside would face a tougher battle around the broken support trendline near 157.40.
In summary, USDJPY continues to have a bearish lean in the short term. If resistance around 152.20 holds firm, a resumption of the downtrend is likely. A move below 145.00 would signal a deeper, more sustained bearish reversal in the medium-term outlook.
Fading Crypto Market Enthusiasm
Market Picture
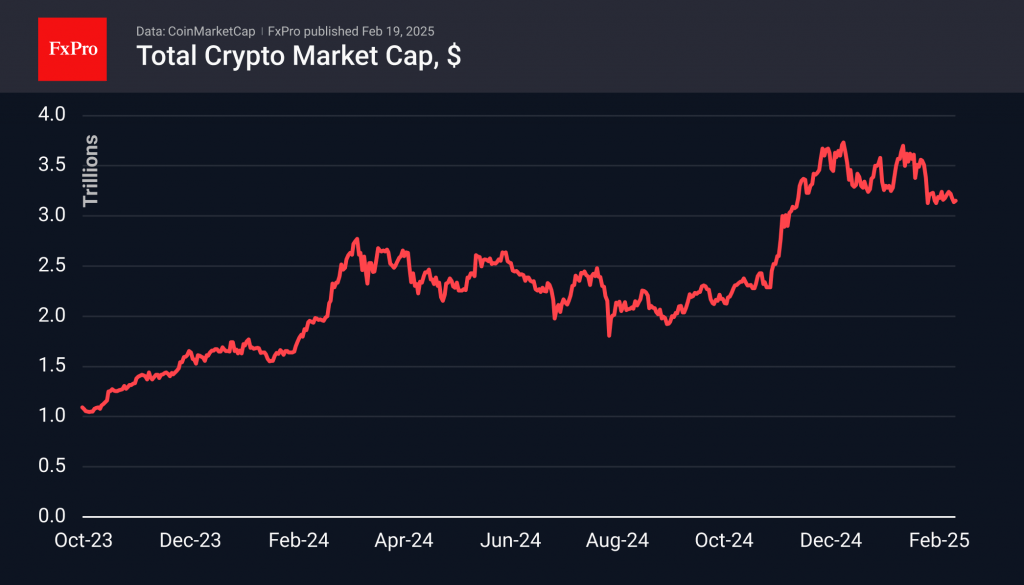
The crypto market lost ground late in the day on Tuesday, falling to $3.08 trillion, but managed to recoup the losses and get back to $3.15, where we saw it 24 hours ago. The market has traded mostly in the $3.10-3.30 range for the past two weeks. This sluggish trading pattern has had a negative impact on trading volumes and can be frustrating for cryptocurrency speculators in general.
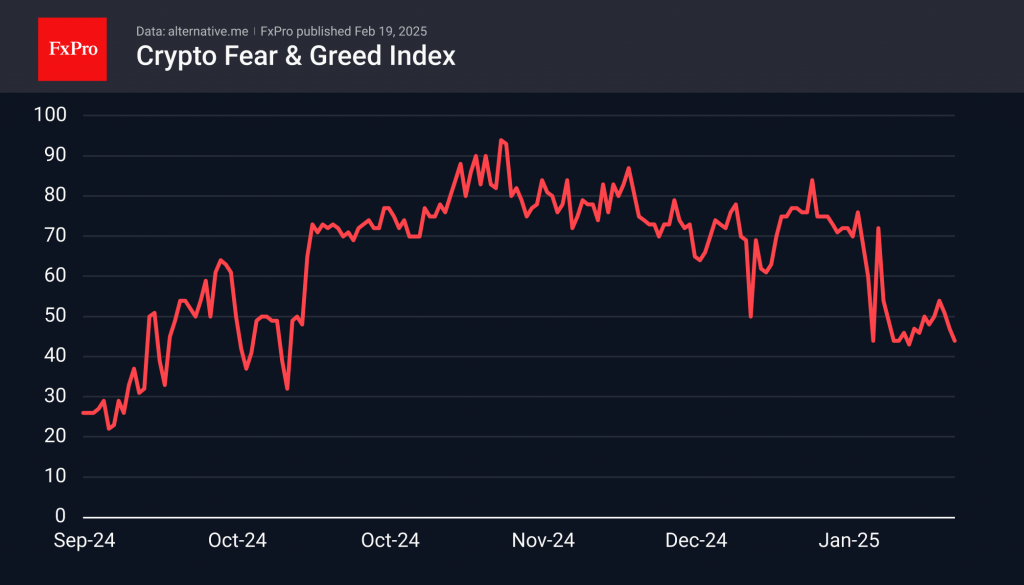
The Crypto Market Sentiment Index has fallen from 47 to 44 (Fear), its lowest level in the past 10 days. This is an indirect sign that even the market’s relative stability is dampening sentiment. Most worryingly, at current sentiment and capitalization levels, the markets have yet to attract sell-off hunters and counter-trend traders.
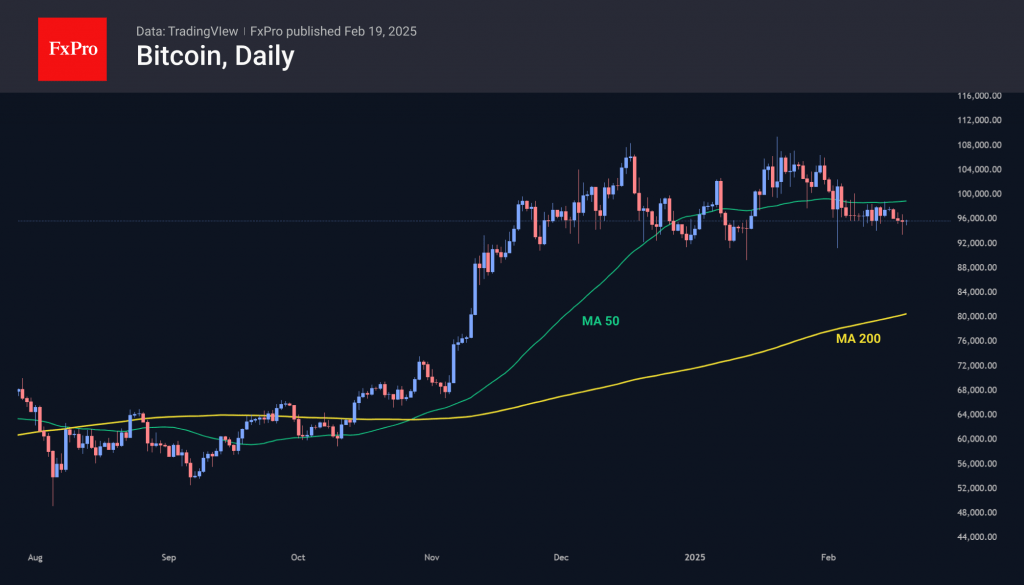
Bitcoin plunged towards 93,000 on Tuesday night but quickly returned to familiar levels above 95,000. Notably, it is off its highs and even below its 50-day moving average, while U.S. stock indices have already returned to renew their rallies.
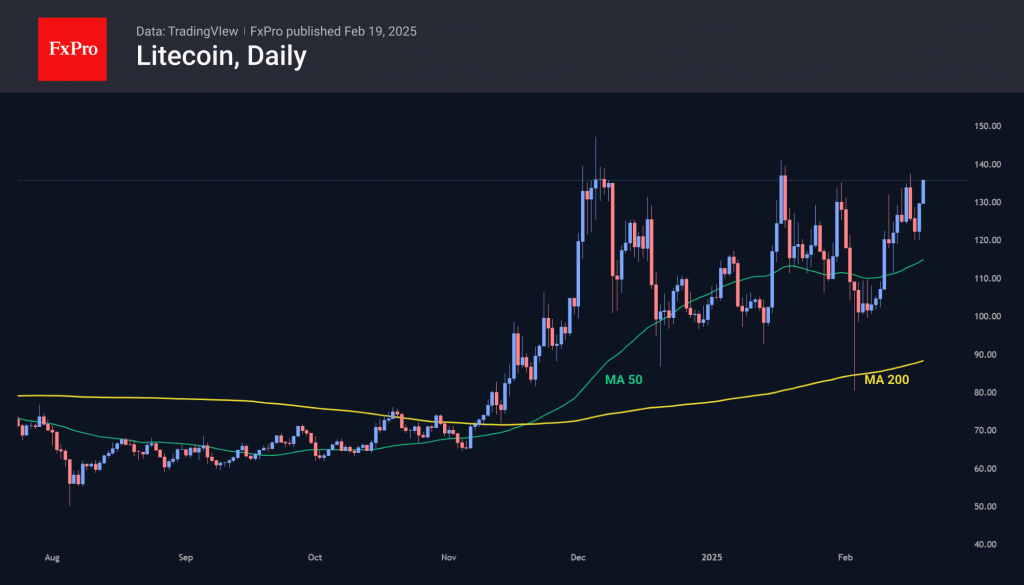
Litecoin is up about 10% in 24 hours, crossing the $135 level and returning to the area of active resistance since December. The dynamics in early February showed that this altcoin is still interesting to buy on dips, which increases its chances of storming the recent highs. Its upside potential is quite extensive: at the highs in 2017 and 2021, this old altcoin was above $350.
News Background
Bitcoin’s dominance has risen to 60% from 55% in early December, driven by institutional investors and low confidence in the rest of the cryptocurrencies.
Standard Chartered expects more sovereign wealth funds to start investing in Bitcoin. The Abu Dhabi sovereign fund’s investment in BlackRock’s Spot Bitcoin ETF is one of the first signals of the new trend. The bank’s forecast for BTC is still the same—$500,000 by 2028.
According to Santiment, the amount of available Ethereum supply on centralized crypto exchanges has fallen to a historic low of 6.38%, which usually shows that investors prefer a hold strategy and avoid a large-scale sell-off soon.
Jeffrey Kendrick, head of digital asset research at Standard Chartered, says government interest in cryptocurrency is becoming more visible. He says the Abu Dhabi sovereign wealth fund’s investment in BlackRock’s Spot Bitcoin ETF is one of the first signals of the new trend.
Binance CEO Richard Teng reported a “new scam” aimed at stealing users’ cryptocurrency. Attackers send fake wallet compromise notifications. The message suggests “securing” funds by transferring them to another wallet they control.
Former customers of the bankrupt FTX platform with assets of up to $50,000 have begun receiving their first payouts on the Kraken exchange and through the BitGo service at November 2022 rates. Many market participants may reinvest the funds received, affecting market liquidity and prices.
Natural Gas Price Hits Highest Level Since January 2023
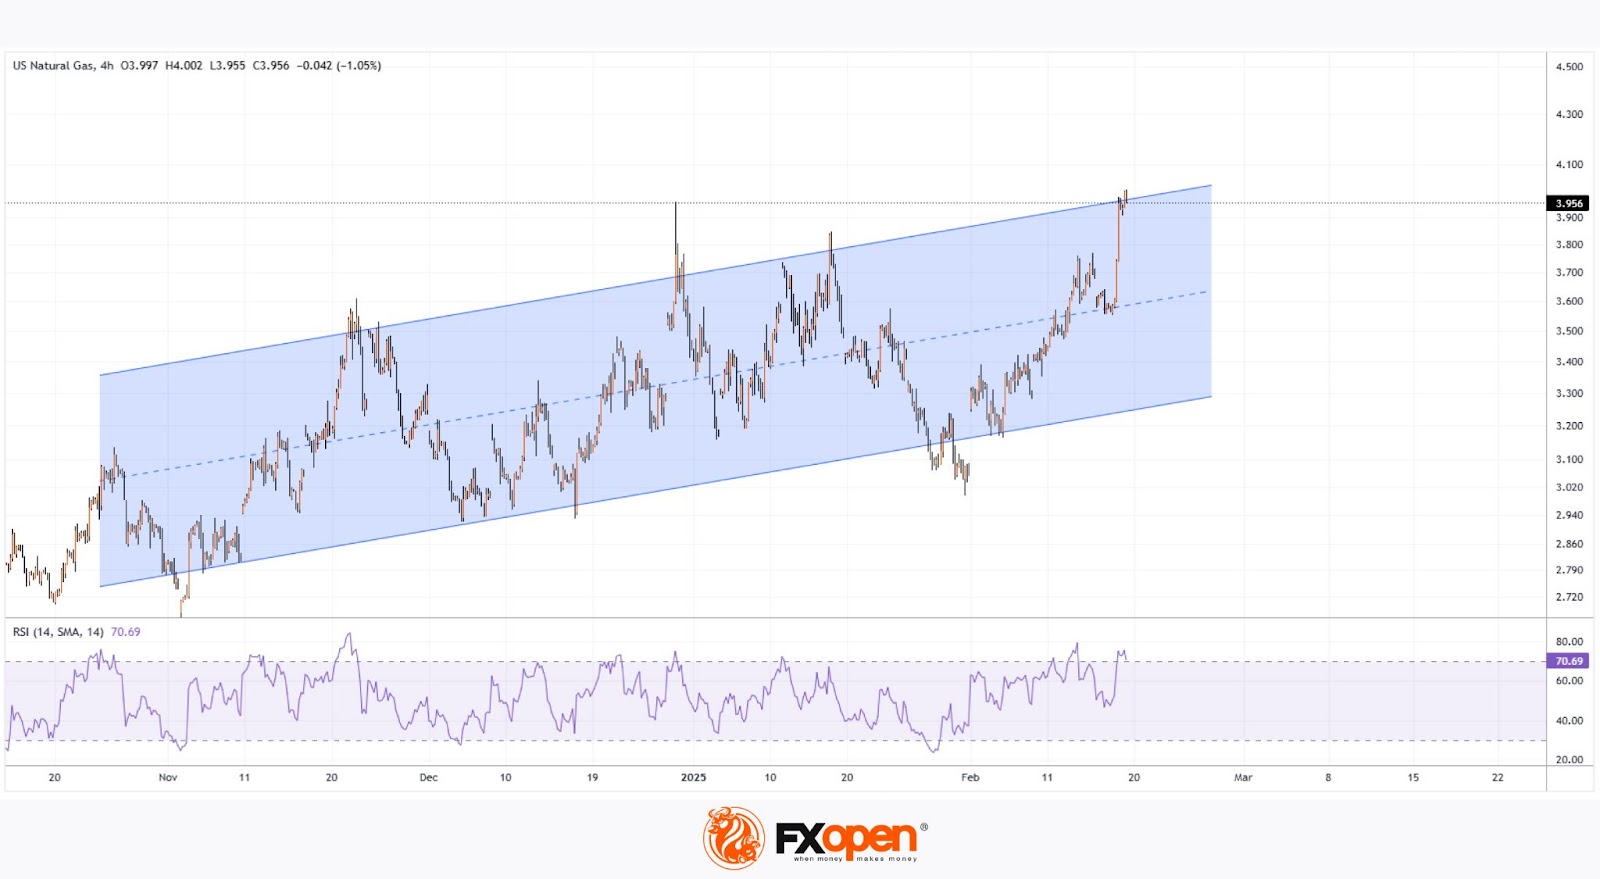
The XNG/USD chart today shows that natural gas prices have surpassed the December 2024 peak, breaking through the key psychological level of $4.000/MMBtu. Since early February, prices have surged by over 20%.
Why Is Natural Gas Price Rising?
According to The Wall Street Journal, the bullish sentiment is driven by:
→ Weather models confirming forecasts of a significant cold spell.
→ LNG exports remaining at record highs.
Additionally, US gas exports may increase further after President Trump lifted the pause imposed by the Biden administration on new LNG export projects. Bloomberg reports that Trump’s administration is close to approving its first LNG export project.
Technical Analysis of XNG/USD
The price movements are forming an upward channel (marked in blue) on the chart:
→ Prices are currently near the upper boundary of this channel.
→ The RSI indicator is in the overbought zone.
→ The price briefly exceeded the $4.000/MMBtu psychological level.
→ Buyers may look to secure profits after the recent sharp gains.
Given these factors, traders may anticipate a potential pullback, which—if it occurs—could bring natural gas prices back towards the channel’s median level.
Start trading commodity CFDs with tight spreads. Open your trading account now or learn more about trading commodity CFDs with FXOpen.
This article represents the opinion of the Companies operating under the FXOpen brand only. It is not to be construed as an offer, solicitation, or recommendation with respect to products and services provided by the Companies operating under the FXOpen brand, nor is it to be considered financial advice.
ECB’s Panetta: Eurozone economic weakness more persistent than expected
Italian ECB Governing Council member Fabio Panetta acknowledged that economic weakness in the Eurozone is proving “more persistent than we expected”, as the long-anticipated consumption-driven recovery has yet to materialize.
After two consecutive quarters of stagnation, he noted that "tensions in the manufacturing sector, employment is giving signs of weakening"
Panetta also highlighted the downside risks to inflation stemming from weak growth. However, he also noted that upside inflation risks remain, primarily from energy costs.
S&P 500 Records All-Time Highs Led by Chipmakers, Dow Jones (DJIA) Seesaw Continues
- The S&P 500 reached new all-time highs, driven by a late-session rally in chipmakers, while the Dow Jones Industrial Average showed mixed movements.
- President Trump has proposed new tariffs, potentially targeting the Pharmaceuticals and Automobiles sectors with a 25% tariff rate.
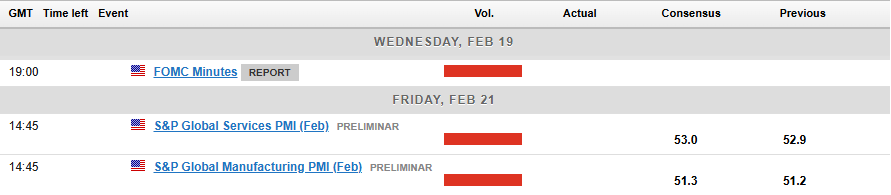
- The Federal Open Market Committee (FOMC) minutes and S&P PMI data releases are upcoming and expected to provide further insights into the Fed’s monetary policy stance.
The three major Wall Street indices fluctuated throughout the US session, shifting between gains and losses. A rise in chipmakers propelled the S&P 500 to fresh all-time highs late in the session despite a drop in technology stocks.
The S&P 500 edged up by 0.2%, while the Nasdaq 100 also posted a 0.2% gain. The Dow Jones Industrial Average showed mixed movements throughout the session. Meanwhile, the chipmakers index surged by 1.7%.
SPX 500 Top Movers
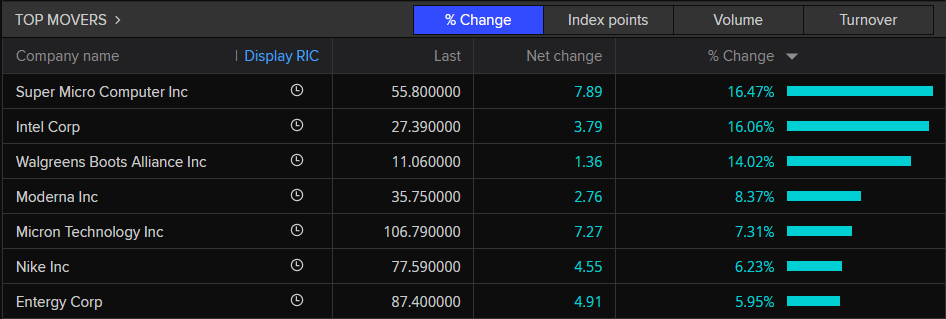
Source: TradingView
Intel’s stock climbed on rumors about a possible company breakup. Super Micro Computer saw a big jump thanks to a positive outlook. Walgreens Boots Alliance rose after CNBC reported that Sycamore Partners might still be planning a takeover. Meanwhile, Meta’s 20-day streak of gains came to an end.
More Tariffs Ahead?
Yesterday we heard more from President Trump on proposed tariffs that may be announced. President Trump said we should see some announcements in the coming week while once again lamenting that the EU has been an unfair trading partner.
The President touched on specific sectors with Pharmaceuticals and Automobiles both expected to get hit with tariffs of around 25%. Tuesday’s comments are his most detailed yet in specifying other sectors that would be hit with fresh barriers.
It will be interesting to see what effect such announcements may have on stock prices moving forward following what has been quite an impressive earning season for US companies.
FOMC Minute and PMI Data Ahead
It is fair to say that following last week’s uptick in US inflation and drop off in retail sales numbers, market participants are once more focused on the Fed’s next moves. The FOMC minutes will be released later today, these should provide further insights into how the Fed sees tariffs impacting their monetary policy course and objectives moving forward.
The week will wrap up with S&P PMI data which will give us another glimpse into the performance of the US economy from both a manufacturing and service perspective.
Technical Analysis
S&P 500
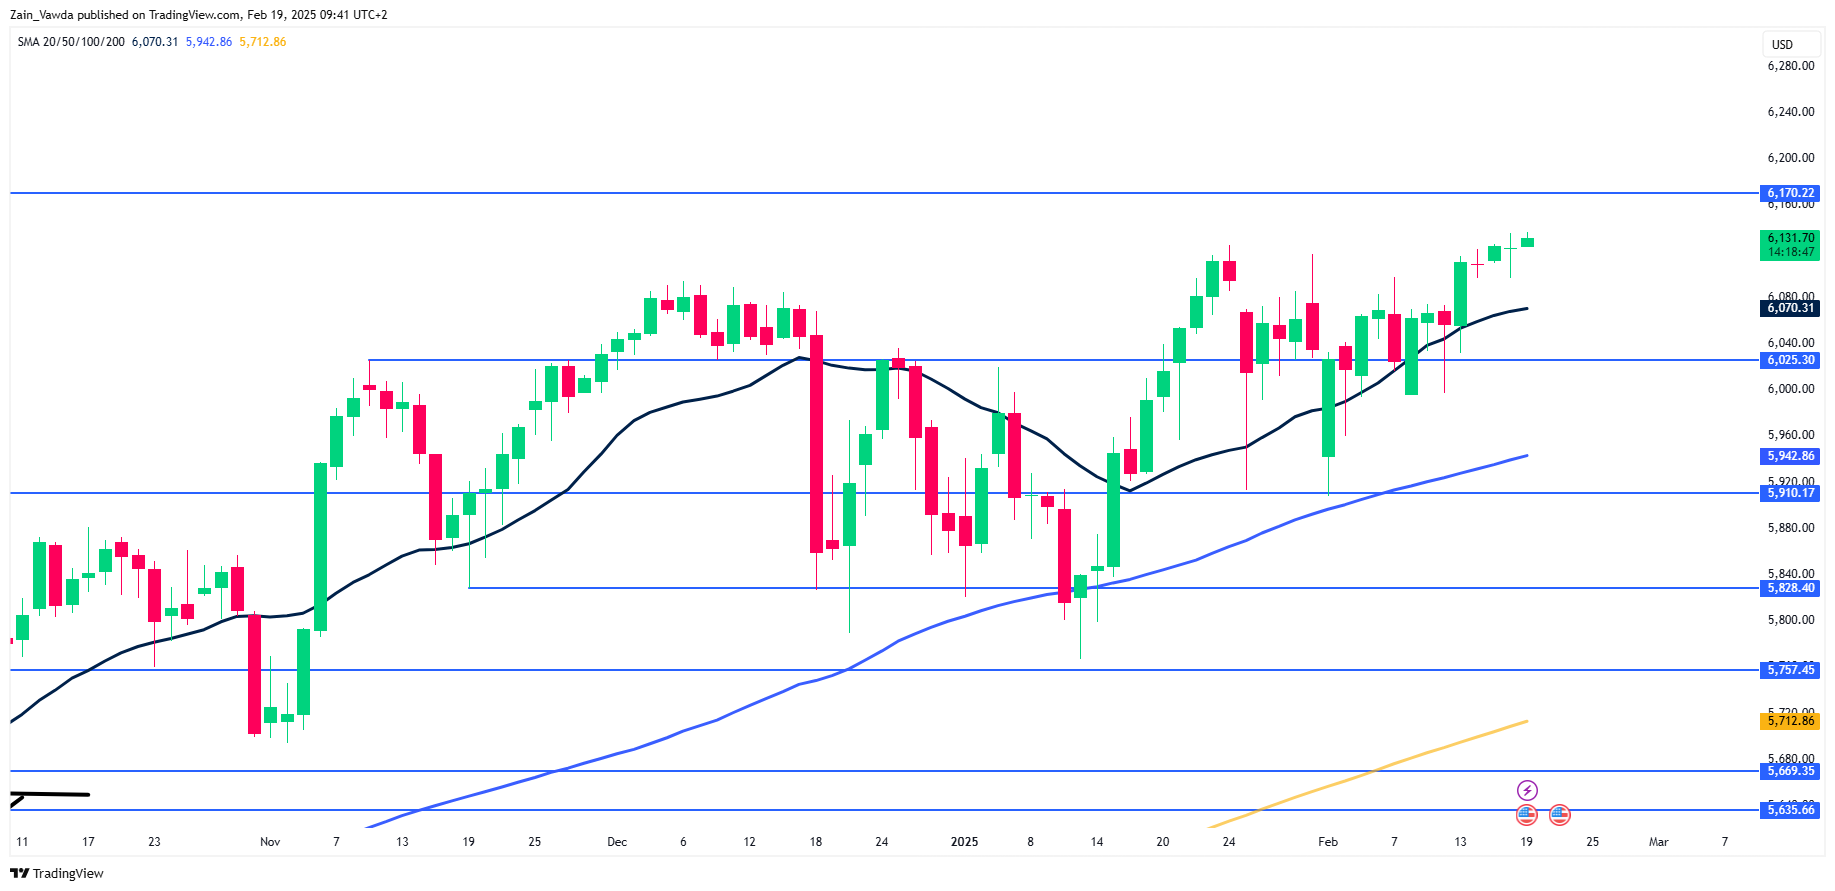
From a technical standpoint, the S&P has printed a fresh all-time high and could be due a pullback soon.
There was a triangle breakout which occurred as far back as September 19, with a target price of around 6170 which is now just 40 points away.
If we reach this level i do think we could be in for a short-term correction, however, i expect such a move to be met with buying pressure if the current status quo remains the same.
It is hard t find key levels as we continue to trade at fresh highs with no historical price action to serve as a guide.
However, immediate focus for me will be 6170 and 6200 on the upside.
If price pushes lower from here, support may be found at 6100, 6080 (20-day MA).
S&P 500 Daily Chart, February 19, 2025
Source: TradingView (click to enlarge)
Support
- 6100
- 6080
- 6050
Resistance
- 6170
- 6200
- 6250
EUR/USD Gains Pace While USD/JPY Turns Red
EUR/USD started a decent upward move above the 1.0460 resistance. USD/JPY declined below 153.00 and is currently consolidating losses.
Important Takeaways for EUR/USD and USD/JPY Analysis Today
- The Euro found support and started a recovery wave above the 1.0400 resistance zone.
- There is a connecting bearish trend line forming with resistance at 1.0460 on the hourly chart of EUR/USD at FXOpen.
- USD/JPY is trading in a bearish zone below the 153.00 and 152.50 levels.
- There is a short-term rising channel forming with support near 151.60 on the hourly chart at FXOpen.
EUR/USD Technical Analysis
On the hourly chart of EUR/USD at FXOpen, the pair started a fresh increase from the 1.0290 zone. The Euro climbed above the 1.0400 resistance zone against the US Dollar.
The pair even settled above the 1.0450 resistance and the 50-hour simple moving average. Finally, it tested the 1.0515 resistance. A high is formed near 1.0514 and the pair is now consolidating gains. There was a minor decline below the 23.6% Fib retracement level of the upward move from the 1.0292 swing low to the 1.0514 high.
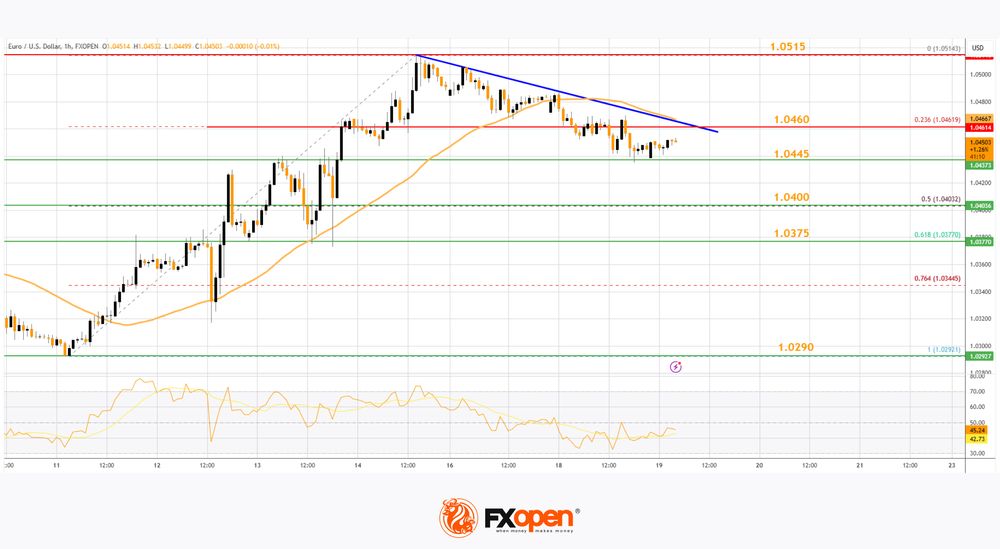
Immediate support is near the 1.0445 level. The next major support is at 1.0400 and the 50% Fib retracement level of the upward move from the 1.0292 swing low to the 1.0514 high.
If there is a downside break below 1.0400, the pair could drop toward the 1.0375 support. The main support on the EUR/USD chart is near 1.0290, below which the pair could start a major decline.
On the upside, the pair is now facing resistance near 1.0460. There is also a connecting bearish trend line forming with resistance at 1.0460. The next major resistance is near the 1.0515 level. An upside break above 1.0515 could set the pace for another increase. In the stated case, the pair might rise toward 1.0550.
USD/JPY Technical Analysis
On the hourly chart of USD/JPY at FXOpen, the pair started a steady decline from well above the 154.00 zone. The US Dollar gained bearish momentum below the 153.00 support against the Japanese Yen.
The pair even settled below the 152.50 level and the 50-hour simple moving average. There was a spike below 151.50 and the pair traded as low as 151.23. It is now correcting losses and trading above the 50-hour simple moving average.
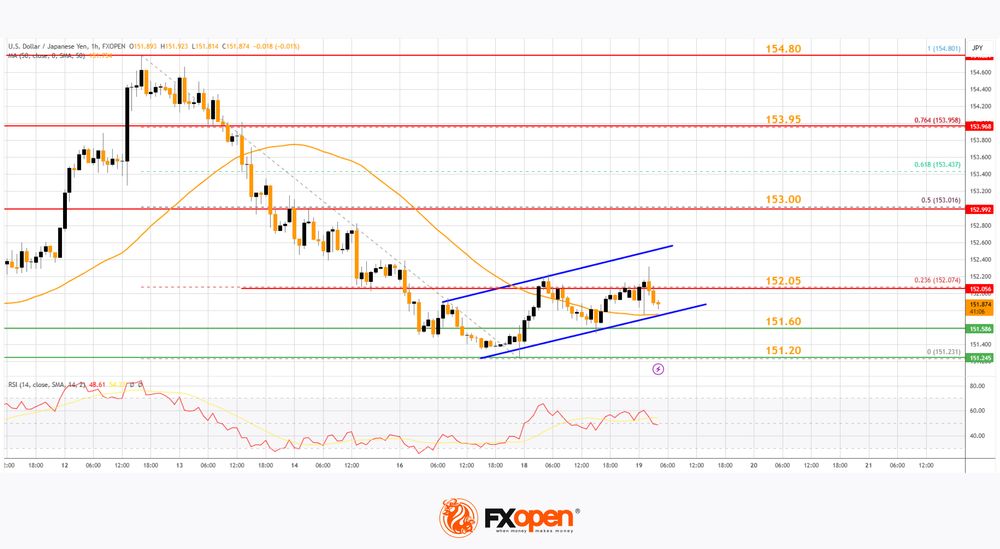
Immediate resistance on the USD/JPY chart is near the 23.6% Fib retracement level of the recent decline from the 154.80 swing high to the 151.23 low at 152.05.
The first major resistance is near the 153.00 zone and the 50% Fib retracement level of the recent decline from the 154.80 swing high to the 151.23 low. If there is a close above the 153.00 level and the hourly RSI moves above 60, the pair could rise toward 153.95.
The next major resistance is near 154.80, above which the pair could test 155.50 in the coming days. On the downside, the first major support is near 151.60. There is also a short-term rising channel forming with support near 151.60.
The next major support is near the 151.20 level. If there is a close below 151.20, the pair could decline steadily. In the stated case, the pair might drop toward the 150.00 support.
Trade over 50 forex markets 24 hours a day with FXOpen. Take advantage of low commissions, deep liquidity, and spreads from 0.0 pips. Open your FXOpen account now or learn more about trading forex with FXOpen.
This article represents the opinion of the Companies operating under the FXOpen brand only. It is not to be construed as an offer, solicitation, or recommendation with respect to products and services provided by the Companies operating under the FXOpen brand, nor is it to be considered financial advice.