
Sample Category Title
USD/CHF Daily Outlook
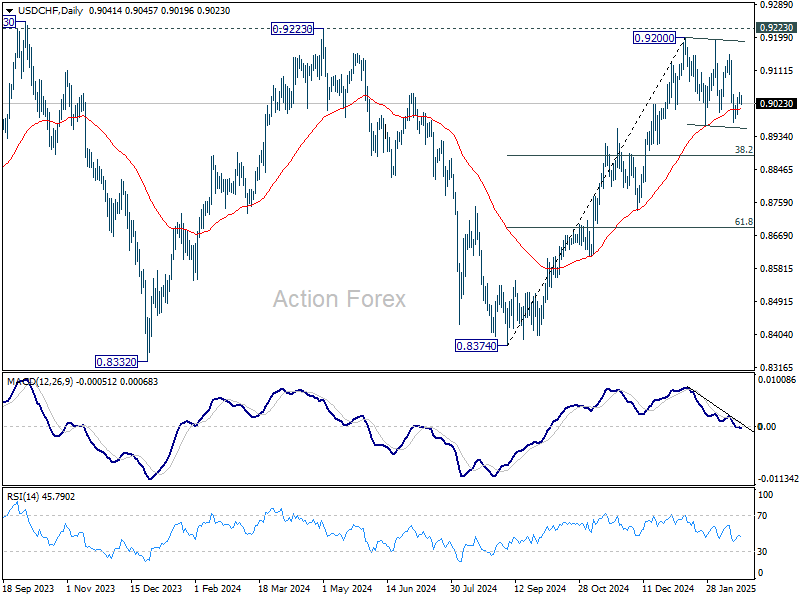
Daily Pivots: (S1) 0.9027; (P) 0.9041; (R1) 0.9060; More…
Current price actions in USD/CHF are seen as part of the consolidations pattern from 0.9200. Intraday bias stays neutral at this point. While deeper pull back might be seen, outlook will stay mildly bullish as long as 38.2% retracement of 0.8374 to 0.9200 at 0.8884 holds. On the upside, firm break of 0.9223 key resistance will carry larger bullish implication. However, sustained break of 0.8884 will indicate bearish reversal, and target 61.8% retracement at 0.8690 instead.
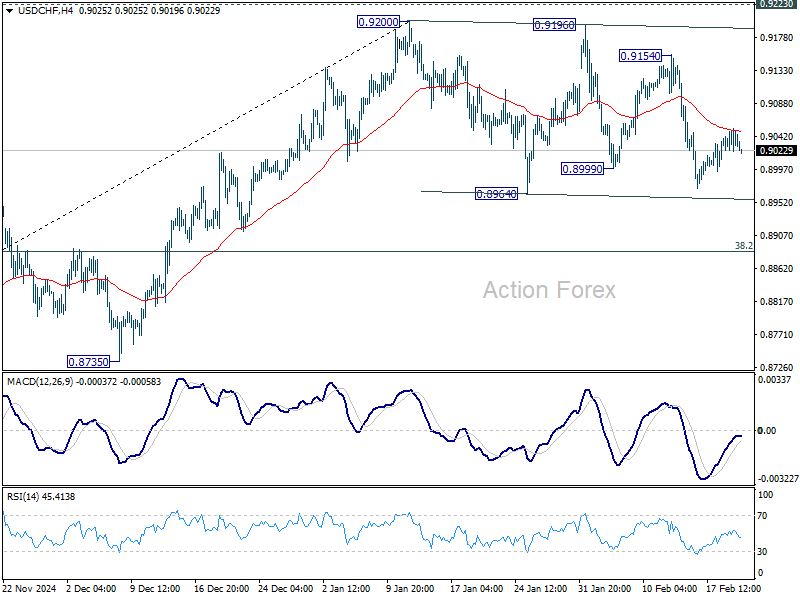
In the bigger picture, decisive break of 0.9223 resistance will argue that whole down trend from 1.0342 (2017 high) has completed with three waves down to 0.8332 (2023 low). Outlook will be turned bullish for 1.0146 resistance next. Nevertheless, rejection by 0.9223 will retain medium term bearishness for another decline through 0.8332 at a later stage.
USD/JPY Daily Outlook
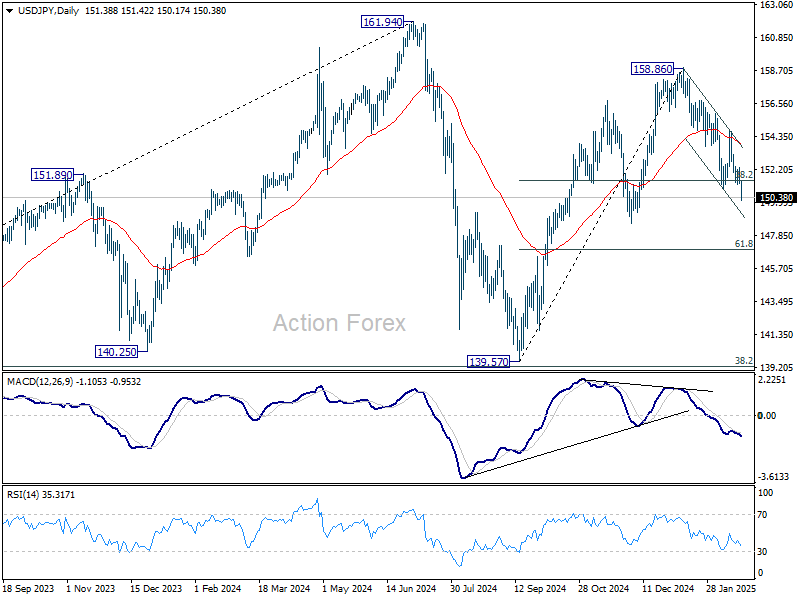
Daily Pivots: (S1) 151.06; (P) 151.68; (R1) 152.12; More...
USD/JPY's fall from 158.86 resumed by breaking through 150.92 support and intraday bias is back on the downside. The strong break of 38.2% retracement of 139.57 to 158.86 at 151.4 also argues that whole rise from 139.57 has completed at 158.86, on bearish divergence condition in D MACD. Fall from there is seen as the third leg of the pattern from 161.94, and should target 61.8% retracement at 146.32. On the upside, above 152.30 minor resistance will turn intraday bias neutral again first. But near term outlook will now stay bearish as long as 154.79 resistance holds.
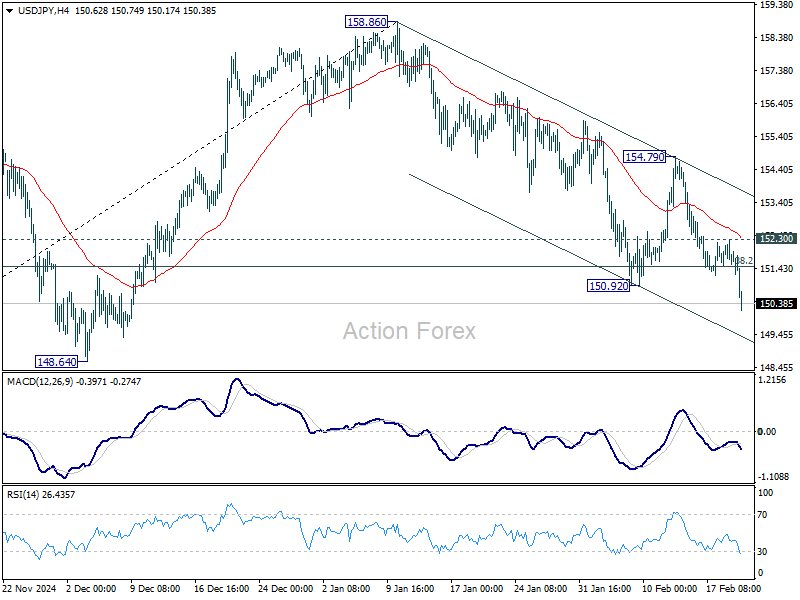
In the bigger picture, price actions from 161.94 are seen as a corrective pattern to rise from 102.58 (2021 low). In case of another fall, strong support should be seen from 38.2% retracement of 102.58 to 161.94 at 139.26 to bring rebound. However, sustained break of 139.26 would open up deeper medium term decline to 61.8% retracement at 125.25.
Dollar Slips as Markets Dismiss Tariff Talk, Yen and Aussie Firm Up
Dollar is broadly weaker in today’s Asian session, though losses remain contained outside of its sharper decline against Yen. US President Donald Trump reiterated his intention to impose 25% tariffs on cars, semiconductors, and pharmaceutical imports, but markets are showing growing indifference to these repeated trade threats. The lack of clarity on how these tariffs will be structured, their relationship to reciprocal duties, and any potential further escalation has left markets in a wait-and-see mode. Many Fed policymakers have noted that the uncertainty surrounding trade policy could keep Fed from easing further until the economic impact becomes clearer. This Fed rate outlook is keeping Dollar's losses limited for now.
Geopolitical concerns remain a significant factor in risk sentiment, particularly regarding the "peace negotiations" over Russia’s invasion of Ukraine. Trump’s latest remarks, where he referred to Ukrainian President Volodymyr Zelenskyy as a "dictator", have triggered sharp backlash from Ukraine and European leaders. Former US Vice President Mike Pence also criticized Trump, stating that Ukraine did not "start" the war, emphasizing that Russia launched an unprovoked attack that has claimed hundreds of thousands of lives. These developments cast doubts on Trump’s ability to fulfill his campaign promise of quickly brokering an end to the war. Market uncertainty around geopolitical risks remains elevated.
Meanwhile, Yen's near term rally is regaining strength, continuing to draw support from solid domestic economic data and rising speculation that BoJ may raise interest rates again sooner than expected. Optimism surrounding this year’s wage negotiations is also boosting sentiment, as higher wages could support domestic inflation, strengthening the case for policy normalization. Additionally, Japan’s 10-year JGB yield remains near 1.44%, its highest level in nearly 15 years, providing further tailwinds for Yen.
Australian Dollar is also gaining traction, supported by strong employment data, which reinforced RBA's careful approach to monetary easing. RBA Deputy Governor Andrew Hauser reinforced this stance, emphasizing that this week's 25bps rate cut was merely a slight relaxation of restrictive policy, "not whamming down on the accelerator.”
So far this week, Yen has been the strongest performer, followed by Aussie and Sterling. On the other end of the spectrum, Euro remains the weakest, with the Swiss Franc and Loonie also underperforming. Kiwi and Dollar are currently positioned in the middle.
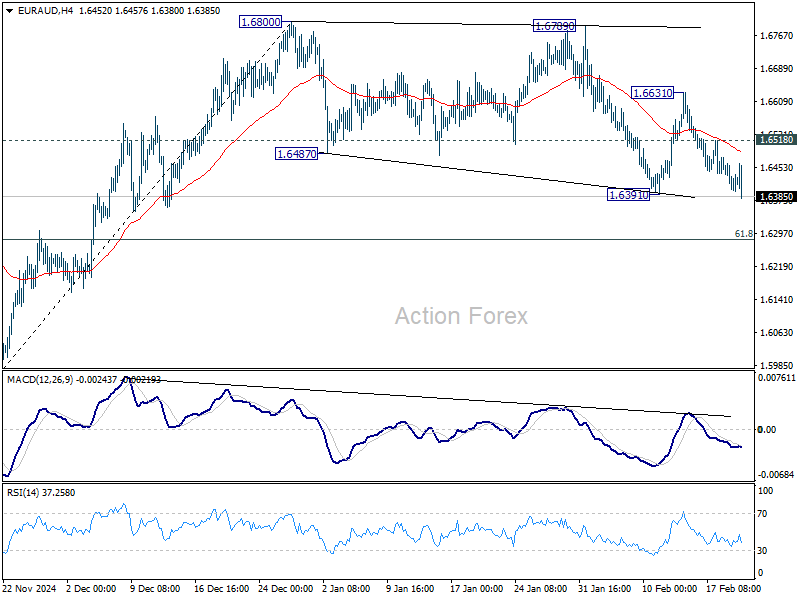
Technically, EUR/AUD's breach of 1.6391 support invalidated our original view, and suggests that correction from 1.6800 is still underway. Deeper fall is now expected as long as 1.6518 resistance holds, to 61.8% retracement of 1.5963 to 1.6800 at 1.6283. Break of 1.6518, however, will bring stronger rebound back to 1.6631 resistance instead.
In Asia, at the time of writing, Nikkei is down -1.28%. Hong Kong HSI is down -0.86%. China Shanghai SSE is up 0.06%. Singapore Strait Times is down -0.17%. Japan 10-year JGB yield is up 0.004 at 1.444. Overnight, DOW rose 0.16%. S&P 500 rose 0.24%. NASDAQ rose 0.07%. 10-year yield fell -0.009 to 4.535.
RBA’s Hauser: Rate cut justified, but inflation fight not a done deal
RBA Deputy Governor Andrew Hauser explained the 25bps rate cut to 4.10% earlier this week, highlighting that the decision was influenced by an “alternative version” of the inflation forecast. Under a scenario where rates remained unchanged, inflation would have undershot inflation target midpoint, albeit slightly. This factor played a key role in the board’s decision to ease policy.
However, Hauser struck a cautious tone on further cuts, emphasizing that core inflation at 3.2% remains above target. He reinforced that RBA’s remains “rigorously” focused on controlling price pressures, stating that the battle against inflation is “not a done deal” . He explained that RBA is not “whamming down on the accelerator”, but has simply “eased back on the brake a little bit”.
Regarding the strong January employment report release today, Hauser welcomed the figures, calling them part of a “striking employment growth” trend in Australia. He noted that Australia’s labor market performance stands out internationally, with strong participation rates and employment growth exceeding many other developed economies.
Australia’s employment grows 44k in Jan, outpacing population growth rate
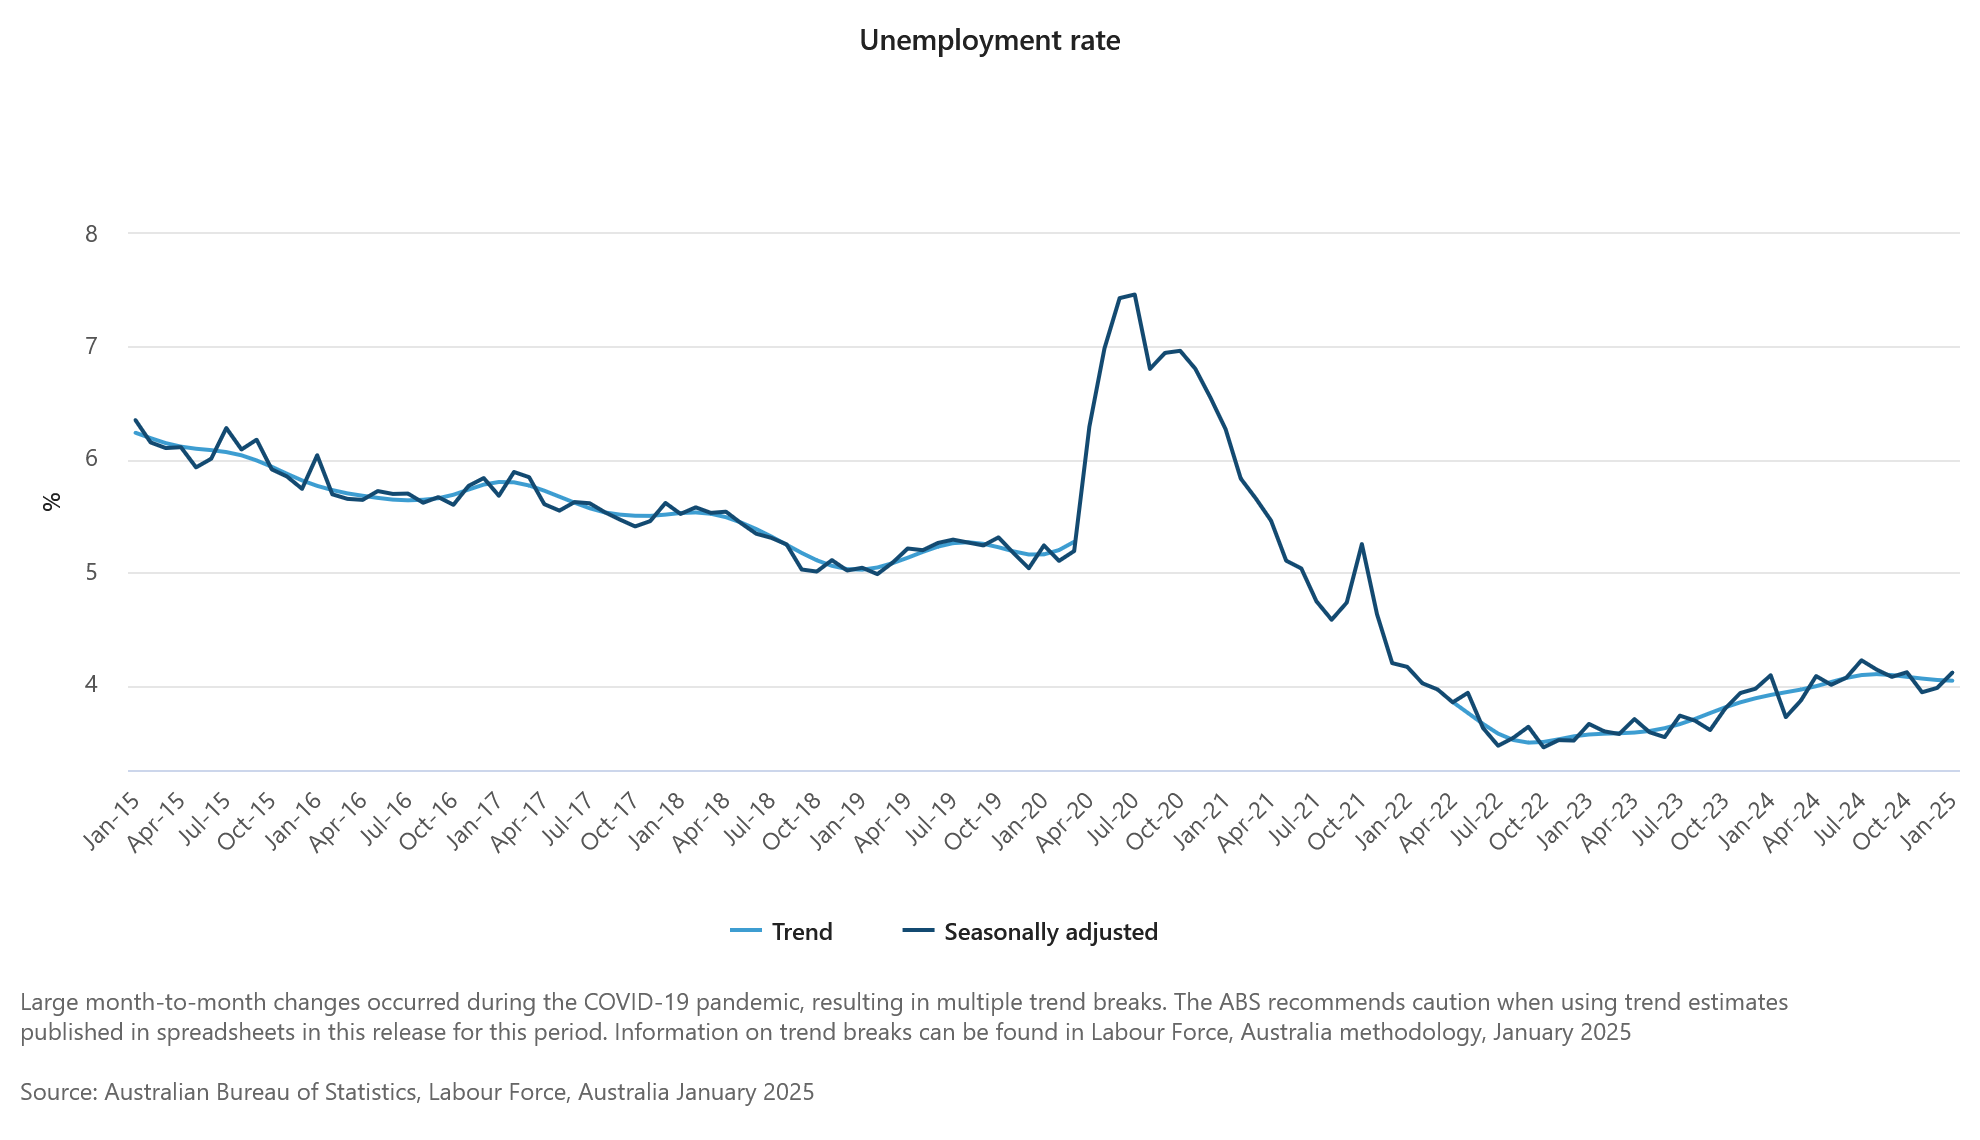
Australia’s employment surged by 44k in January, more than double the expected 20k gain. The increase was driven by a 54.1k rise in full-time jobs, while part-time employment declined by -10.1k. However, the number of unemployed people also grew by 23k.
Employment growth at 0.3% mom matched 2024 monthly average, but outpacing population growth of 0.2%.
Unemployment rate edged up from 4.0% to 4.1%, in line with expectations, as the participation rate hit a record high of 67.3%, up from 67.2% in December. Meanwhile, monthly hours worked fell by -0.4% mom.
RBNZ’s Orr: No more 50bps cuts without a shock, sees stable inflation ahead
RBNZ Governor Adrian Orr reaffirmed that a 50bps rate cut would only happen again in the event of an economic shock, reinforcing the central bank’s guidance for two 25bps cuts in the first half of 2025.
Speaking before a parliamentary committee today, Orr noted that New Zealand is now in an environment of low and stable inflation, though global uncertainty remains a key risk.
He expressed optimism, stating that “GDP growth, employment growth, and low and stable inflation” should support an improving economic environment throughout the year. However, he warned that “geoeconomic fragmentation” is weighing on global growth, leading to increased price volatility in international markets.
RBNZ Chief Economist Paul Conway told the committee that escalating trade tensions will contribute to higher inflation, weaker global growth, and reduced economic efficiency. He stressed that "The best thing we can do is have headline inflation at 2% so that we can sort of absorb that future volatility."
Fed minutes signal no rush to cut rates, inflation risks remain in focus
FOMC’s January meeting minutes reinforced Fed’s cautious stance, with policymakers emphasizing the need for “further progress on inflation” before considering any rate cuts. The officials acknowledged a “high degree of uncertainty” in the economic outlook, justifying a “careful approach” to policy adjustments.
While Fed remains confident that inflation will ease in the coming months, officials largely pointed to "upside risks to the inflation outlook", rather than concerns over the job market.
he minutes highlighted several factors that could disrupt the disinflation process, including shifts in trade and immigration policy, geopolitical disruptions to supply chains, and stronger-than-expected household spending. These risks suggest that inflationary pressures could remain stickier than anticipated, keeping the Fed on hold for longer.
Fed’s Jefferson: No rush to cut rates as economy remains strong
Fed Vice Chairman Philip Jefferson said in a speech overnight that the central bank can “take our time” in assessing economic data before making any changes. With the U.S. economy performing well and the labor market remaining solid, Jefferson indicated that there is no immediate urgency to ease policy further.
He acknowledged that progress toward the Fed’s 2% inflation target "has been slow in the past year." He added that the path of inflation will likely remain “bumpy”.
While the 100 basis points of cumulative rate cuts last year have moved policy closer to a neutral stance, he reiterated that monetary policy is still "restrictive".
Fed’s Bostic keeps rate cuts on the table but stresses need for more data
Atlanta Fed President Raphael Bostic reiterated in an interview that rate cuts remain a possibility this year, but emphasized the need for further data clarity before making any decisions.
He maintained a neutral stance, stating, “I am not taking anything off the table. I am not putting anything extra on the table.”
Bostic acknowledged that January’s hotter-than-expected inflation data raised questions about whether it represents "a new trend or just a bump in the road". He will be closely analyzing economic developments “over the next several months” to determine the correct policy response.
Bostic also defended Fed’s current position, insisting, “I don’t think we have cut too much. We are still in a restrictive posture and that’s what we need.” He reaffirmed that monetary policy remains tight enough to bring inflation down, arguing that waiting until inflation fully reaches 2% before easing would have been a mistake.
Looking ahead
Swiss trade balance and German PPI will be released in European session. Later in the day, Canada will release IPPI, RMPI and NHPI. US will release jobless claims and Philly Fed survey.
USD/JPY Daily Outlook
Daily Pivots: (S1) 151.06; (P) 151.68; (R1) 152.12; More...
USD/JPY's fall from 158.86 resumed by breaking through 150.92 support and intraday bias is back on the downside. The strong break of 38.2% retracement of 139.57 to 158.86 at 151.4 also argues that whole rise from 139.57 has completed at 158.86, on bearish divergence condition in D MACD. Fall from there is seen as the third leg of the pattern from 161.94, and should target 61.8% retracement at 146.32. On the upside, above 152.30 minor resistance will turn intraday bias neutral again first. But near term outlook will now stay bearish as long as 154.79 resistance holds.
In the bigger picture, price actions from 161.94 are seen as a corrective pattern to rise from 102.58 (2021 low). In case of another fall, strong support should be seen from 38.2% retracement of 102.58 to 161.94 at 139.26 to bring rebound. However, sustained break of 139.26 would open up deeper medium term decline to 61.8% retracement at 125.25.
RBA’s Hauser: Rate cut justified, but inflation fight not a done deal
RBA Deputy Governor Andrew Hauser explained the 25bps rate cut to 4.10% earlier this week, highlighting that the decision was influenced by an “alternative version” of the inflation forecast. Under a scenario where rates remained unchanged, inflation would have undershot inflation target midpoint, albeit slightly. This factor played a key role in the board’s decision to ease policy.
However, Hauser struck a cautious tone on further cuts, emphasizing that core inflation at 3.2% remains above target. He reinforced that RBA’s remains “rigorously” focused on controlling price pressures, stating that the battle against inflation is “not a done deal” . He explained that RBA is not “whamming down on the accelerator”, but has simply “eased back on the brake a little bit”.
Regarding the strong January employment report release today, Hauser welcomed the figures, calling them part of a “striking employment growth” trend in Australia. He noted that Australia’s labor market performance stands out internationally, with strong participation rates and employment growth exceeding many other developed economies.
NZD/USD Finds Stability—Will The Recovery Continue To 0.6000?
Key Highlights
- NZD/USD started a fresh increase above the 0.5620 resistance.
- A key bullish trend line is forming with support at 0.5670 on the 4-hour chart.
- EUR/USD is still struggling to clear the 1.0520 resistance zone.
- GBP/USD could extend gains if it settles above 1.2630.
NZD/USD Technical Analysis
The New Zealand Dollar formed a base and started a fresh increase against the US Dollar. NZD/USD surpassed the 0.5600 and 0.5650 resistance levels.
Looking at the 4-hour chart, the pair settled above the 0.5670 level, the 100 simple moving average (red, 4-hour), and the 200 simple moving average (green, 4-hour). The pair even tested the 0.5750 zone before there was a minor pullback.
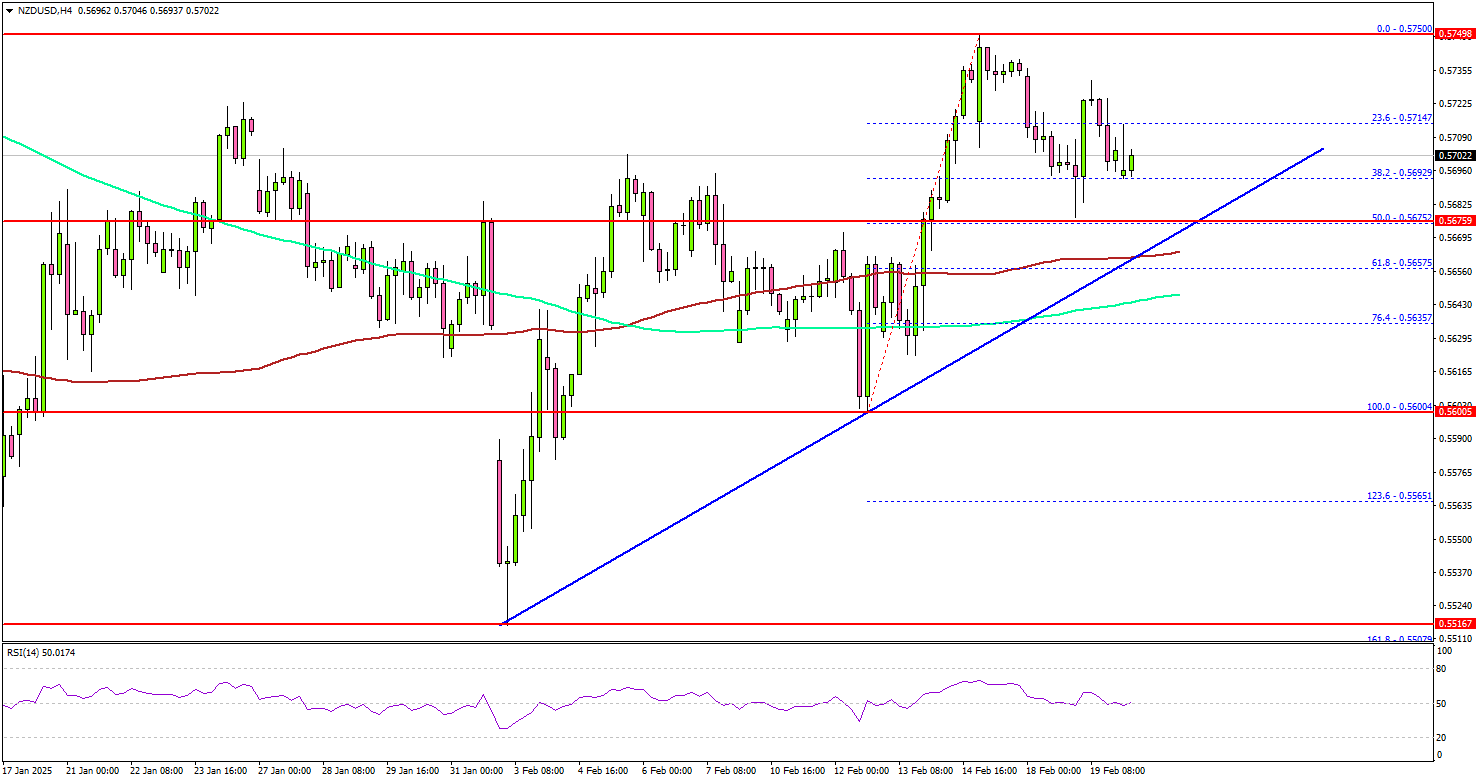
The pair dipped and tested the 50% Fib retracement level of the upward move from the 0.5600 swing low to the 0.5750 high. On the downside, immediate support sits near the 0.5690 level.
The next key support sits near the 0.5670 level. There is also a key bullish trend line forming with support at 0.5670 on the same chart. The main support could be 0.5655 and the 61.8% Fib retracement level of the upward move from the 0.5600 swing low to the 0.5750 high.
Any more losses could send the pair toward the 0.5600 level. On the upside, the pair seems to be facing hurdles near the 0.5750 level. The next major resistance is near the 0.5800 level. The main resistance is now forming near the 0.5840 zone.
A close above the 0.5840 level could set the tone for another increase. In the stated case, the pair could even clear the 0.6000 resistance.
Looking at EUR/USD, the pair remained stable above 1.0450 but the bears are still active near the 1.0520 resistance.
Upcoming Economic Events:
- US Initial Jobless Claims - Forecast 215K, versus 213K previous.
- Philadelphia Fed Manufacturing Index for Feb 2025 – Forecast 20, versus 44.3 previous.
Australia’s employment grows 44k in Jan, outpacing population growth rate
Australia’s employment surged by 44k in January, more than double the expected 20k gain. The increase was driven by a 54.1k rise in full-time jobs, while part-time employment declined by -10.1k. However, the number of unemployed people also grew by 23k.
Employment growth at 0.3% mom matched 2024 monthly average, but outpacing population growth of 0.2%.
Unemployment rate edged up from 4.0% to 4.1%, in line with expectations, as the participation rate hit a record high of 67.3%, up from 67.2% in December. Meanwhile, monthly hours worked fell by -0.4% mom.
RBNZ’s Orr: No more 50bps cuts without a shock, sees stable inflation ahead
RBNZ Governor Adrian Orr reaffirmed that a 50bps rate cut would only happen again in the event of an economic shock, reinforcing the central bank’s guidance for two 25bps cuts in the first half of 2025.
Speaking before a parliamentary committee today, Orr noted that New Zealand is now in an environment of low and stable inflation, though global uncertainty remains a key risk.
He expressed optimism, stating that “GDP growth, employment growth, and low and stable inflation” should support an improving economic environment throughout the year. However, he warned that “geoeconomic fragmentation” is weighing on global growth, leading to increased price volatility in international markets.
RBNZ Chief Economist Paul Conway told the committee that escalating trade tensions will contribute to higher inflation, weaker global growth, and reduced economic efficiency. He stressed that "The best thing we can do is have headline inflation at 2% so that we can sort of absorb that future volatility."
Fed’s Jefferson: No rush to cut rates as economy remains strong
Fed Vice Chairman Philip Jefferson said in a speech overnight that the central bank can “take our time” in assessing economic data before making any changes. With the U.S. economy performing well and the labor market remaining solid, Jefferson indicated that there is no immediate urgency to ease policy further.
He acknowledged that progress toward the Fed’s 2% inflation target "has been slow in the past year." He added that the path of inflation will likely remain “bumpy”.
While the 100 basis points of cumulative rate cuts last year have moved policy closer to a neutral stance, he reiterated that monetary policy is still "restrictive".
Fed’s Bostic keeps rate cuts on the table but stresses need for more data
Atlanta Fed President Raphael Bostic reiterated in an interview that rate cuts remain a possibility this year, but emphasized the need for further data clarity before making any decisions.
He maintained a neutral stance, stating, “I am not taking anything off the table. I am not putting anything extra on the table.”
Bostic acknowledged that January’s hotter-than-expected inflation data raised questions about whether it represents "a new trend or just a bump in the road". He will be closely analyzing economic developments “over the next several months” to determine the correct policy response.
Bostic also defended Fed’s current position, insisting, “I don’t think we have cut too much. We are still in a restrictive posture and that’s what we need.” He reaffirmed that monetary policy remains tight enough to bring inflation down, arguing that waiting until inflation fully reaches 2% before easing would have been a mistake.
Fed minutes signal no rush to cut rates, inflation risks remain in focus
FOMC’s January meeting minutes reinforced Fed’s cautious stance, with policymakers emphasizing the need for “further progress on inflation” before considering any rate cuts. The officials acknowledged a “high degree of uncertainty” in the economic outlook, justifying a “careful approach” to policy adjustments.
While Fed remains confident that inflation will ease in the coming months, officials largely pointed to "upside risks to the inflation outlook", rather than concerns over the job market.
he minutes highlighted several factors that could disrupt the disinflation process, including shifts in trade and immigration policy, geopolitical disruptions to supply chains, and stronger-than-expected household spending. These risks suggest that inflationary pressures could remain stickier than anticipated, keeping the Fed on hold for longer.