
Sample Category Title
CADJPY Technical Analysis
The Japanese Yen (JPY) is trading weakly in the European session but is not falling sharply because many traders believe that the Bank of Japan (BoJ) will raise interest rates again. Additionally, the gap between Japanese and US bond yields is narrowing as investors expect the US Federal Reserve (Fed) to cut interest rates soon. This has helped to limit losses for the Yen.
On the other hand, positive news about a delay in US President Donald Trump's reciprocal tariffs and ongoing peace talks between Russia and Ukraine are reducing demand for the safe-haven JPY. At the same time, rising US Treasury bond yields support the US Dollar (USD), helping it recover from a three-day losing streak and keeping the USDJPY pair positive.
CADJPY – H4 Timeframe
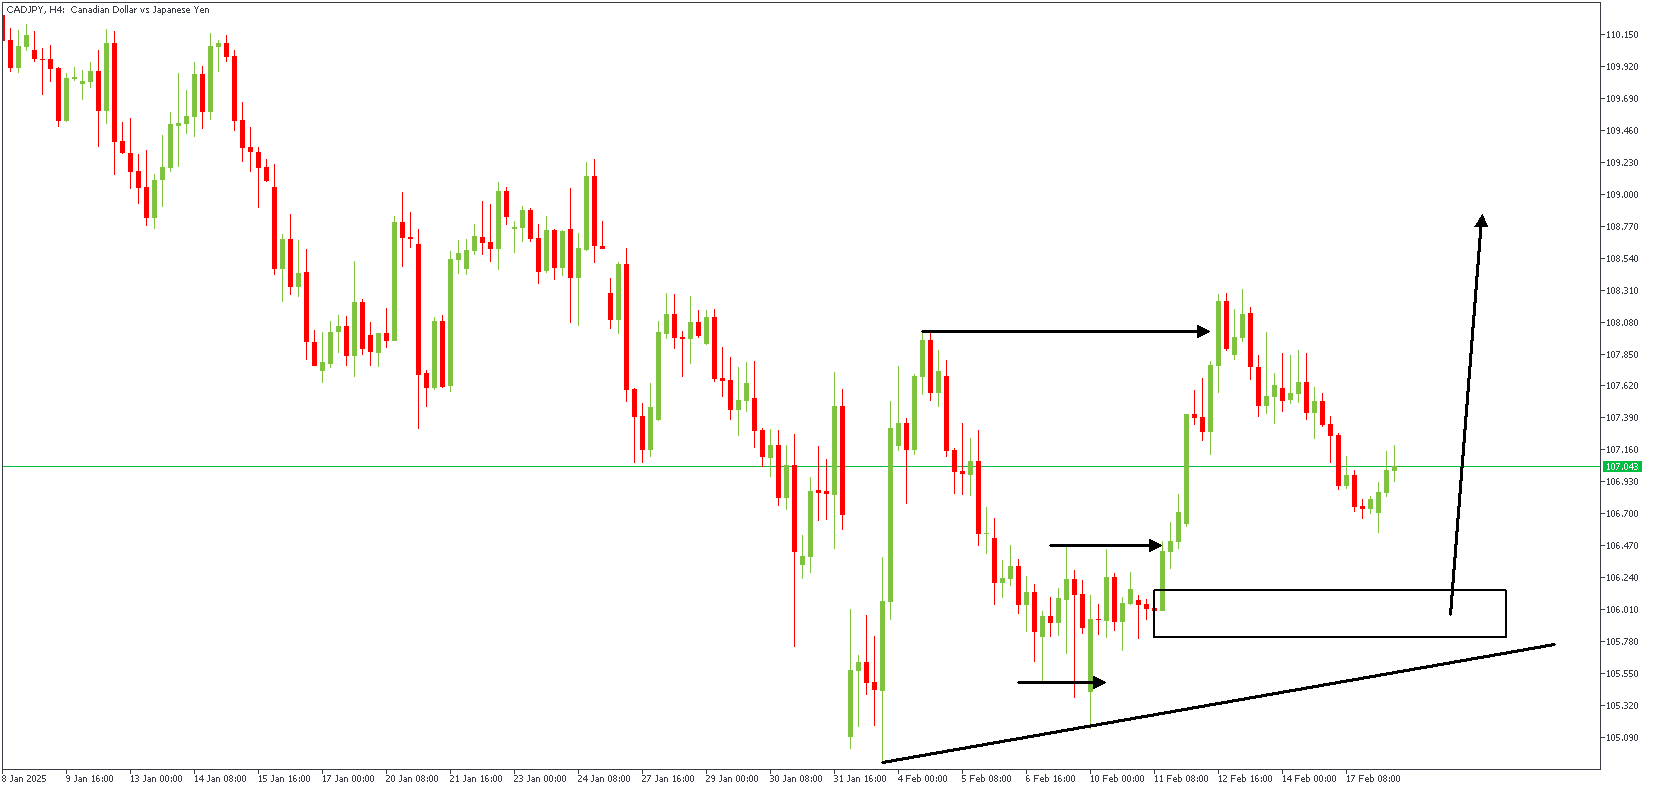
CADJPY has recently broken above the previous high on the 4-hour timeframe chart, leaving an FVG (Fair Value Gap) and a drop-base-rally demand zone behind, near the origin of the bullish momentum. The presence of a trendline support further affirms the bullish sentiment.
CADJPY – H3 Timeframe
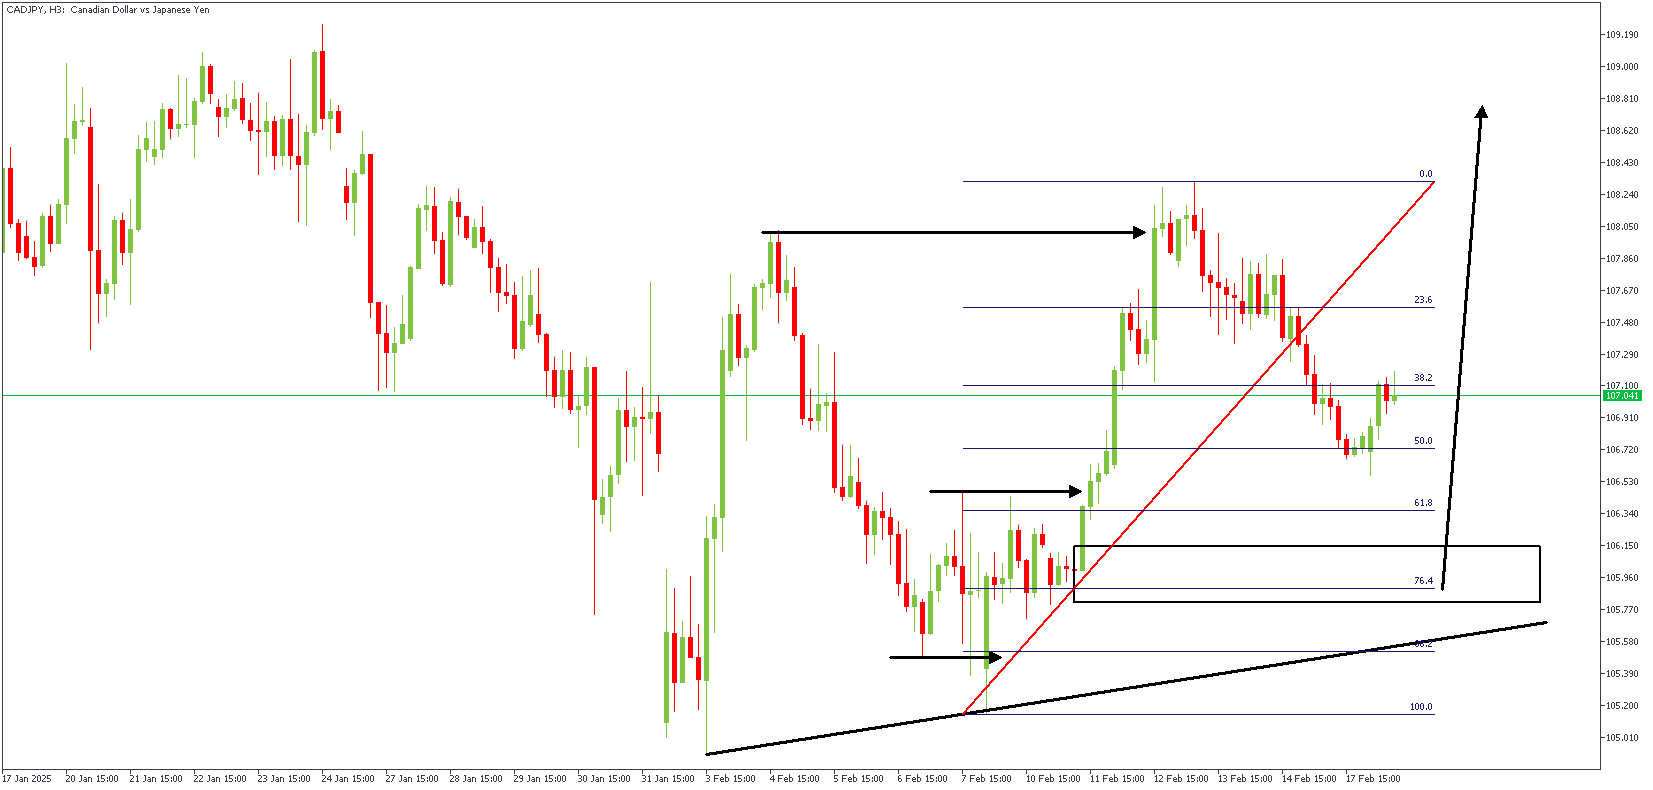
The 3-hour timeframe chart of CADJPY shows the price retracing towards the demand zone at the base of the bullish break. This demand also serves as the order block from the SBR (Sweep Break Retest) pattern and overlaps the 76% Fibonacci retracement level. Considering the trendline support's presence, the price is expected to bounce off the demand to resume the bullish impulse.
Analyst's Expectations:
- Direction: Bullish
- Target- 108.667
- Invalidation- 105.088
GBPAUD Technical Analysis
The British Pound (GBP) is slightly weaker than the US Dollar (USD), down by about 0.2%, while the USD remains strong. According to Shaun Osborne, Chief FX Strategist at Scotiabank, the Pound is struggling to keep its gains despite positive news about wages and jobs in the UK.
Recent data showed that wages in the UK grew by 6.0% for the three months ending in December, which was better than expected. Additionally, more people found jobs than analysts had predicted. This has reduced expectations of interest rate cuts from the Bank of England (BoE), aligning with the BoE’s cautious approach to lowering rates.
Even though the Pound gained some strength last week, it struggled to surpass the 1.2610 level against the USD, a key resistance point. The Pound has been moving around the 1.26 mark for the past two days without making significant progress. If it drops below 1.2580, it could fall further to the 1.2525/30 range.
GBPAUD – H4 Timeframe
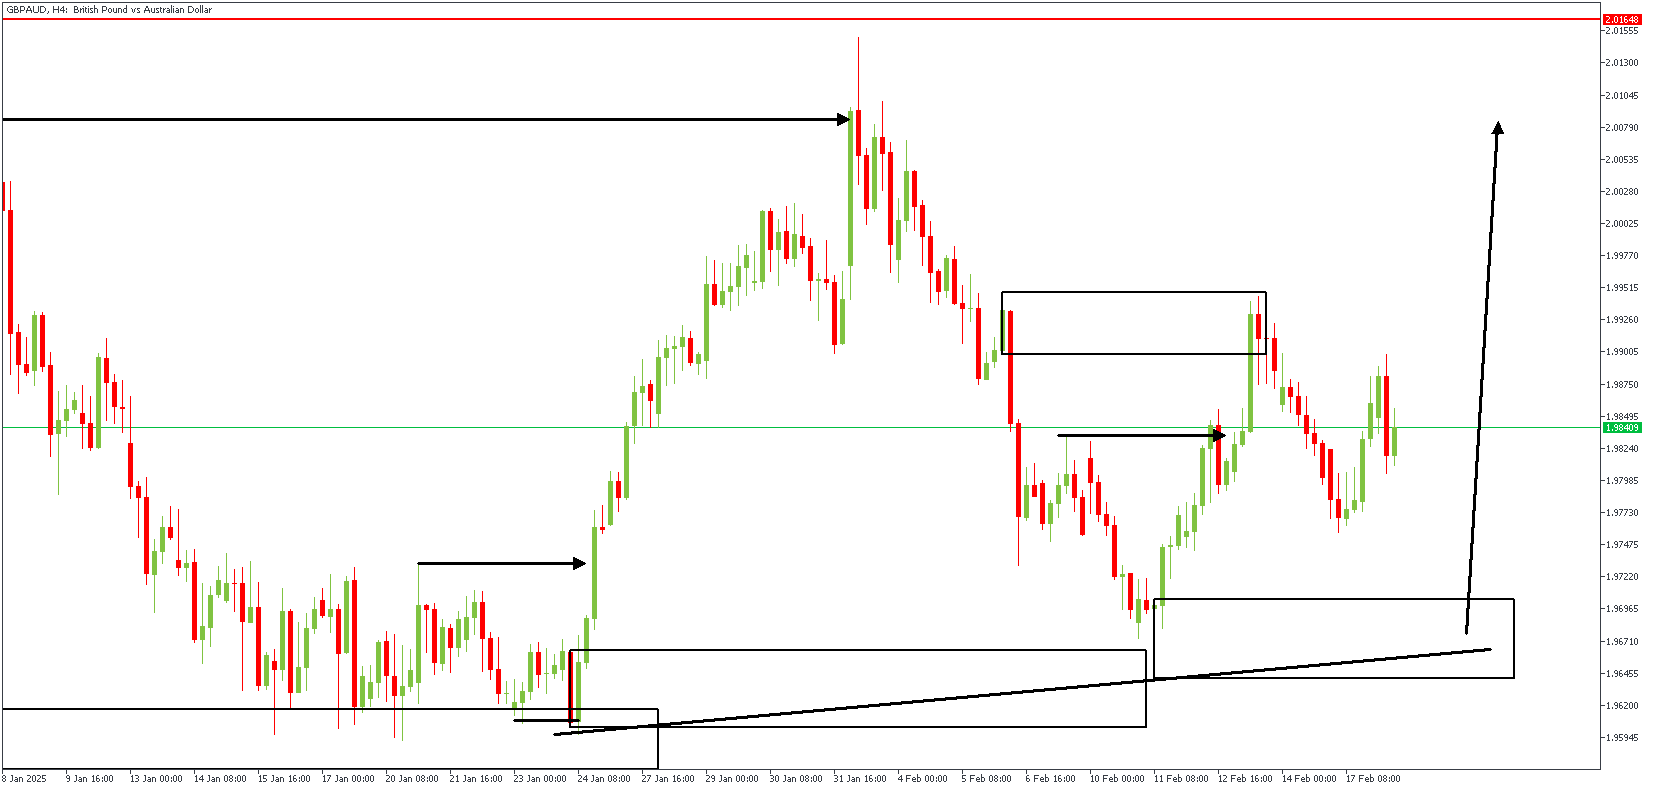
The 4-hour timeframe chart of GBPAUD shows the price reacting off the confluence area of a trendline support and a drop-base-rally demand zone. The initial momentum has declined, allowing for a bearish retracement and a possible retest of the trendline support.
GBPAUD – H2 Timeframe
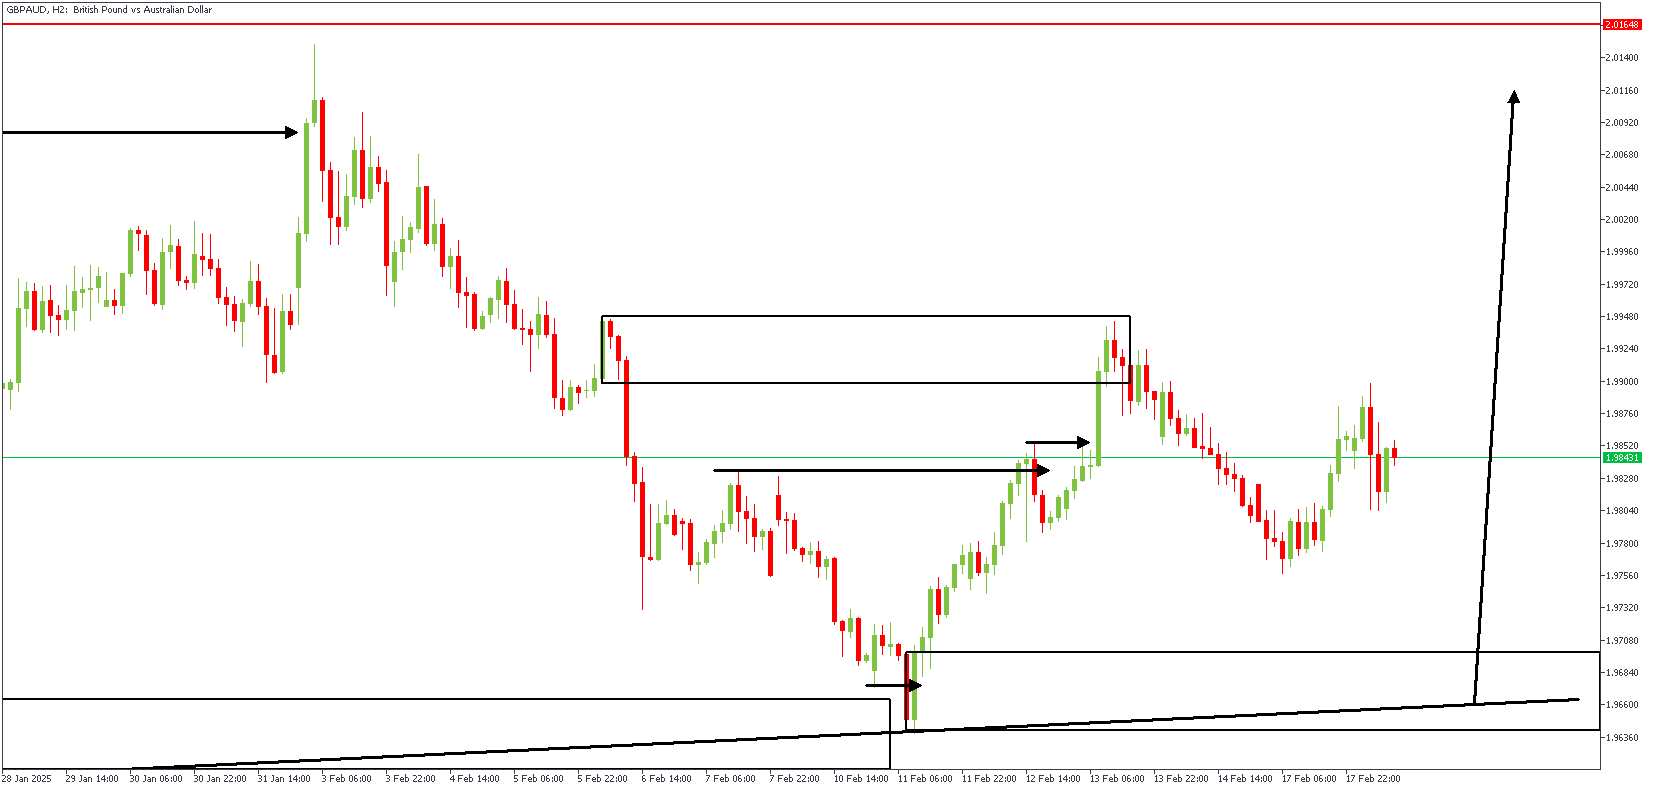
The 2-hour timeframe chart of GBPAUD further clarifies the original bullish sentiment on the higher timeframe. It presents an SBR (Sweep Break Retest) pattern with the demand zone lying around the 88% Fibonacci retracement level. The confluence from the trendline support confirms a bullish sentiment.
Analyst’s Expectations:
- Direction: Bullish
- Target: 2.00705
- Invalidation: 1.95451
New Zealand Dollar Slips Ahead of Expected RBNZ Cut
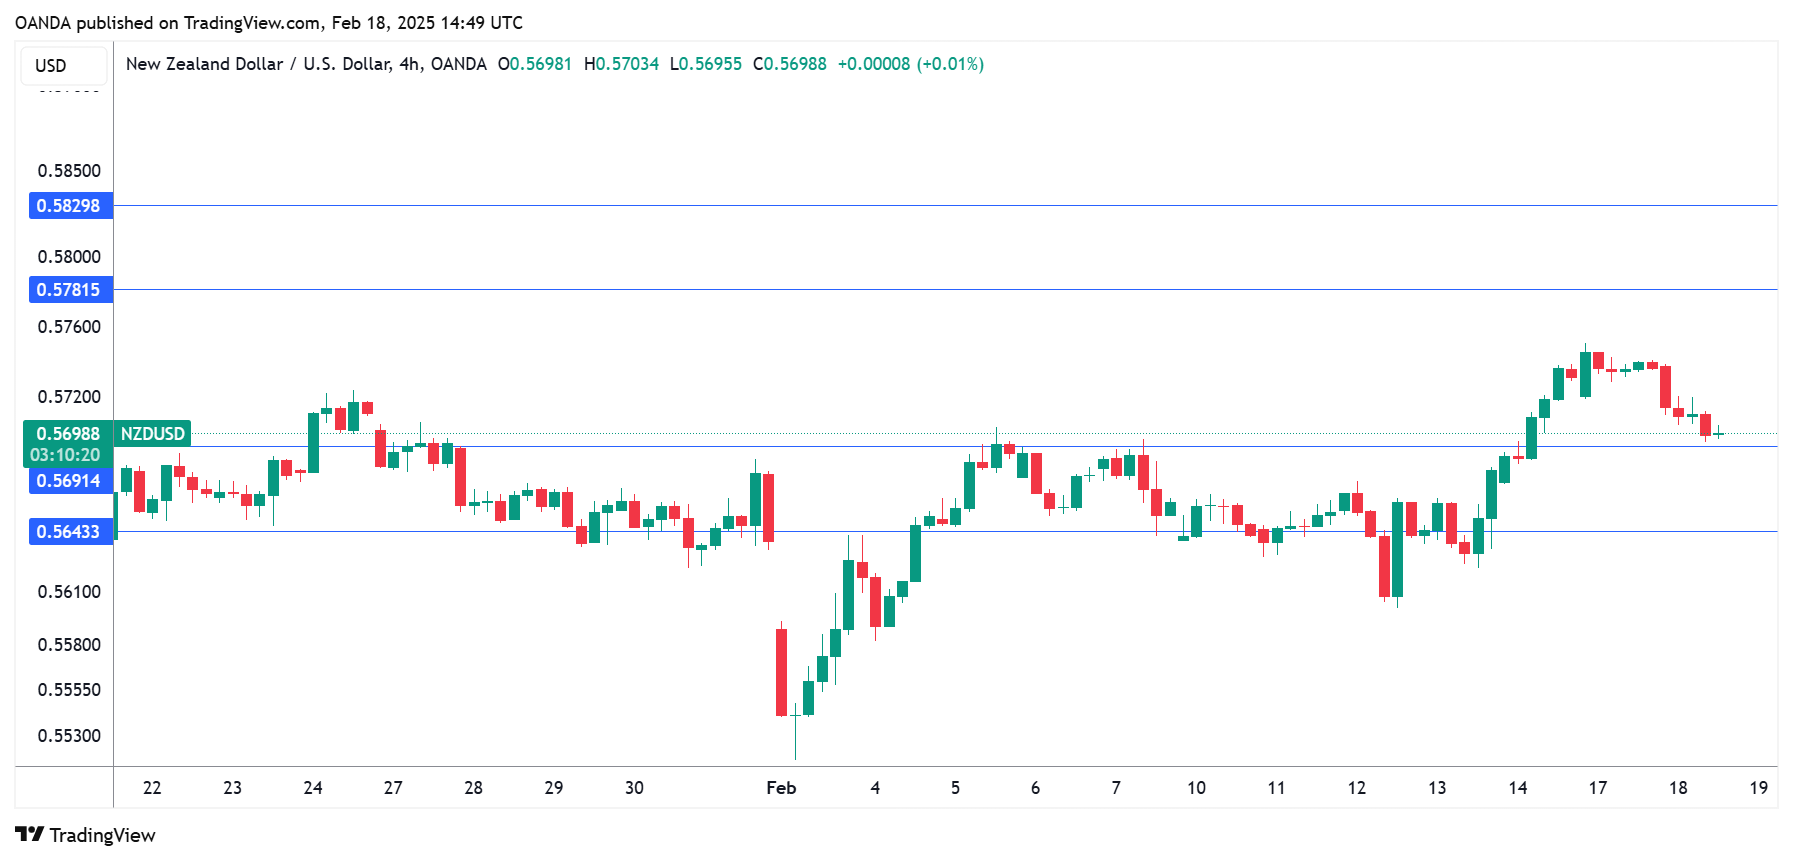
The New Zealand dollar is sharply lower on Tuesday. NZD/USD is trading at 0.5700 in the North American session, down 0.62% on the day.
RBNZ expected to chop rates by 50 basis points
The Reserve Bank of New Zealand meets on Wednesday for the first time this year. The RBNZ lowered rates by a half-point at the last meeting on Nov. 27 and the markets have priced in another half-point cut on Wednesday at 90%, which would bring the cash rate down to 3.75%. The central bank held rates for over a year but has aggressively cut rates by 125 basis points in the current easing cycle.
The RBNZ has telegraphed its plan to cut rates by a half-point on Wednesday and we could see a limited response from the New Zealand dollar, since the decision has been priced in. Still, the US/New Zealand rate differential will widen and that could spell headwinds in the near term for the New Zealand dollar, which plunged 13% in the fourth quarter 2024 but has gained 1.9% since Jan 1.
What can we expect from the RBNZ after tomorrow’s anticipated rate cut? The RBNZ’s updated forecasts are expected to show the cash rate declining towards 3 percent, but in smaller increments of quarter-point cuts. This will depend on the strength of the economy and the direction of inflation. Another factor which could affect the rate path is the new US administration which has already started imposing tariffs.
New Zealand is vulnerable to US tariffs as the US is its second-largest trading partner, accounting for about 12% of New Zealand exports. Even if the US does not target New Zealand with tariffs, the trade war between the US and China has clouded the inflation outlook and is will likely hamper global growth.
NZD/USD Technical
- NZD/USD is putting pressure on support at 0.5691. Below, there is support at 0.5643
- 0.5781 and 0.5829 and the next resistance lines
Sunset Market Commentary
Markets
The focus of markets (and the international community) was on the talks in Riyadh between Russia and the US to end the war in Ukraine. The two parties agreed to appoint high-level teams to work ‘on a path to ending the conflict in Ukraine as soon as possible in a way that is enduring, sustainable, and acceptable to all sides’. For now, this brought little new for markets. Returning after the long weekend, US yields are rising between 2 bps (2-y) and 4.5 bps (30-y). Fed’s Waller indicated to leave rates unchanged until inflation moderates further (which he still expects). The NY empire manufacturing survey was stronger than expected (5.7 from -12.6, with also prices series jumping higher). EMU yields are taking a breather after yesterday’s rise/steepening on expectations of higher defense/fiscal expenditure. German yields are changing less than on bps across the curve. Despite ‘noisy/diffuse’ geopolitical and economic headlines of late, German ZEW investor confidence improved more than expected (expectations 26 from 10.3, 20.0 expected). ZEW comments that “Shortly before the day of the federal election, economic expectations have clearly improved in February. This rising optimism is probably due to hopes for a new German government capable of action. Also, after a period of absent demand, private consumption can be expected to gain momentum in the next six months’. European equities remain well bid, with the Eurostoxx50 touching a new record. The S&P 500 is also only a whisker away from record levels (+0.2%). Despite the risk-on, USD slightly outperforms with DXY returning to the 107 level. EUR/USD (1.045) is falling prey to profit taking as the 1.0533 YTD top serves as resistance for now.
The monthly UK eco update that will unfold this week, this morning started with a positive surprise. Labour data painted a better picture than signaled by survey evidence of late. The latter suggested a negative reaction of employers to higher social security contributions from the October budget. Still data were stronger than expected across the board, with the unemployment rate holding at 4.4% and January payrolls rising 21k vs a 30k decline expected. Maybe most important from a monetary policy point of view was (private sector) pay rising 6.3% (3M average Y/Y). This was no big surprise, not for markets and not for the BoE, but remains a reason for the BoE to hold a cautious approach on further policy easing. The immediate market reaction to the data was modest. UK Gilts underperform Bunds with yields rising between 3.5 bps (2-y) and 4.3 bps (30-y). Money markets currently only fully discount two additional 25 bps BoE cuts later this year, with less than 50% seen on a third step. In a public appearance today, BoE government Bailey are already looked forward to an expected uptick (to be published tomorrow) in the January inflation (expected to rise from 2.5% to 2.8%Y/Y). However, he tentatively downplayed this as mainly due to regulated prices rather than mirroring the underlying state of the economy. EUR/GBP tries to break the 0.83 big figure. For now sterling holds its recent gains, but no big follow-through gains yet.
News & Views
The governors of the Spanish, German, Italian and French central bank in a letter to the European Commission urged to simplify the wide array of rules for commercial lenders in “areas where the European framework is unduly complex and may create competitive distortions at international level, without any significant financial stability benefits.” While the letter comes as the US economy under president Trump is probably set for a broad-based wave of deregulation, the central banks said they are not calling for less strict rules as such, but only to streamline them and make them easier to comprehend and thus implement.
Canadian inflation in January printed at a consensus-matching 0.1% m/m and 1.9% y/y on a headline basis. The uptick from December’s 1.8% was largely due to energy (5.3% y/y) and was partially offset by a sales tax break for food and restaurant meals (-5.1% y/y). Core measures, however, quickened more than expected to an average of 2.7% compared to 2.55% in December. Combined with the strong shape of the labour market of late, it makes another rate cut by the Bank of Canada at the March 12 meeting increasingly unlikely. Market odds currently stand at 36% compared to 50% just yesterday. The BOC in January slowed down the pace of cuts from 50 bps to 25 bps, highlighted the cumulative amount of monetary easing done so far but didn’t offer specific guidance for what’s next. The BoC did warn for potential US tariffs to test the economy’s resilience. US president Trump has delayed a 25% levy from February to March 4. The Canadian dollar reacted muted with USD/CAD hovering around 1.42.
EUR/USD Mid-Day Outlook
Daily Pivots: (S1) 1.0465; (P) 1.0486; (R1) 1.0505; More...
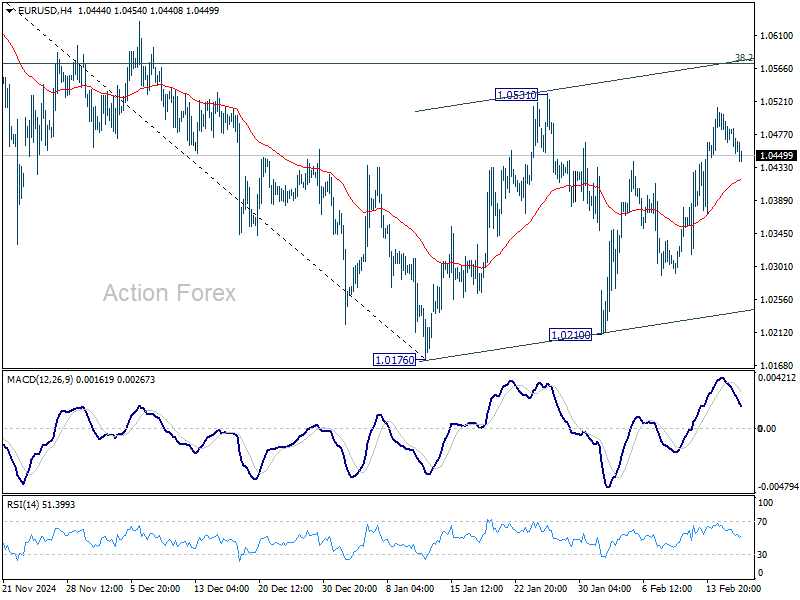
Intraday bias in EUR/USD remains neutral as consolidation from 1.0176 is still extending. Stronger rebound might be seen but outlook will remain bearish as long as 38.2% retracement of 1.1213 to 1.0176 at 1.0572 holds. On the downside, break of 1.0176 will resume whole fall from 1.1213. However, decisive break of 1.0572 will raise the chance of reversal, and target 61.8% retracement at 1.0817.
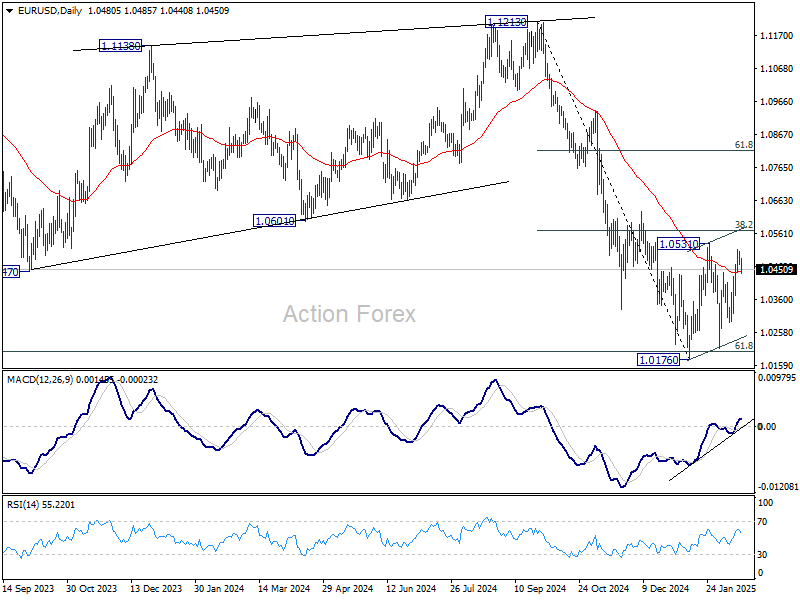
In the bigger picture, immediate focus is on 61.8 retracement of 0.9534 (2022 low) to 1.1274 (2024 high) at 1.0199. Sustained break there will solidify the case of medium term bearish trend reversal, and pave the way back to 0.9534. However, reversal from 1.0199 will argue that price actions from 1.1274 are merely a corrective pattern, and has already completed.
GBP/USD Mid-Day Outlook
Daily Pivots: (S1) 1.2590; (P) 1.2613; (R1) 1.2648; More...
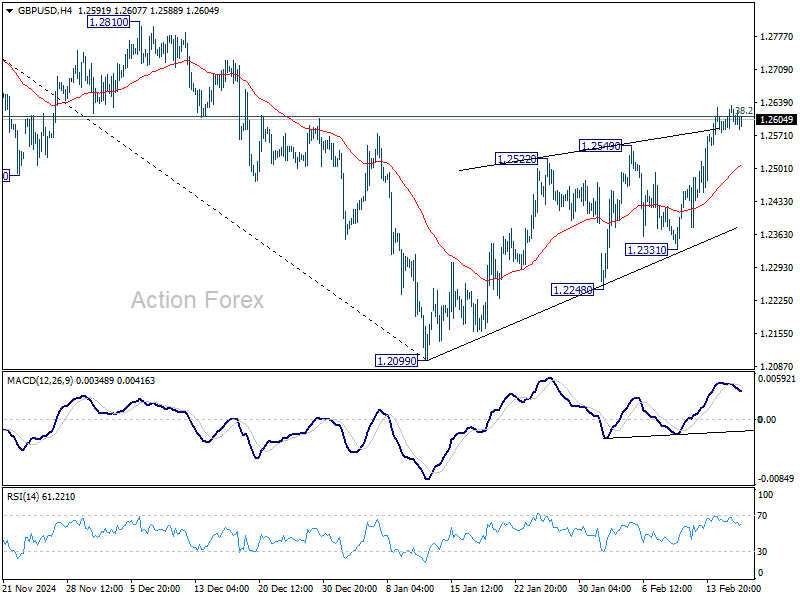
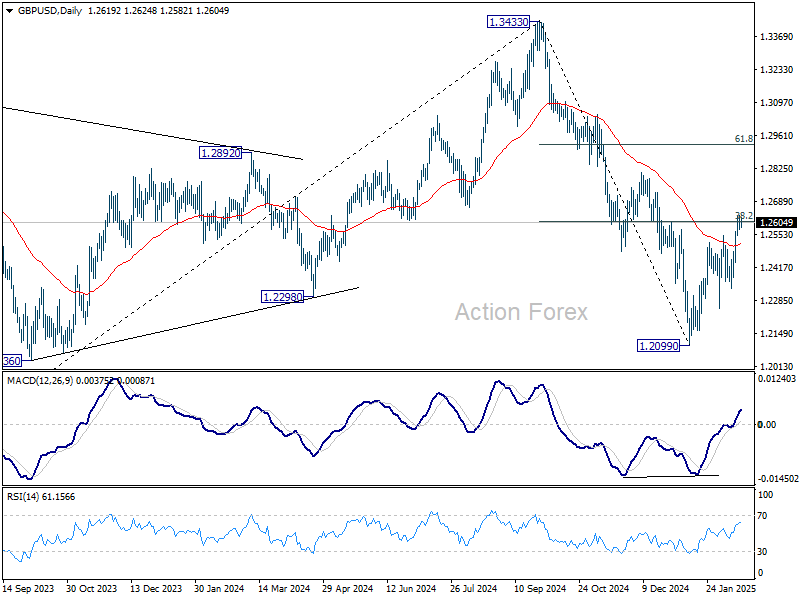
Intraday bias in GBP/USD stays neutral, and focus remains on 38.2% retracement of 1.3433 to 1.2099 at 1.2609. Rejection by this level will keep near term outlook bearish. Break of 1.2331 support will suggest that the rebound from 1.2099 has completed as a correction, and bring retest of 1.2099 low. However, firm break of 1.2609 will raise the chance of near term reversal, and target 61.8% retracement at 1.2923.
In the bigger picture, rise from 1.0351 (2022 low) should have already completed at 1.3433 (2024 high), and the trend has reversed. Further fall is now expected as long as 1.2810 resistance holds. Deeper decline should be seen to 61.8% retracement of 1.0351 to 1.3433 at 1.1528, even as a corrective move. However, firm break of 1.2810 will dampen this bearish view and bring retest of 1.3433 high instead.
USD/CHF Mid-Day Outlook
Daily Pivots: (S1) 0.8981; (P) 0.9000; (R1) 0.9026; More…
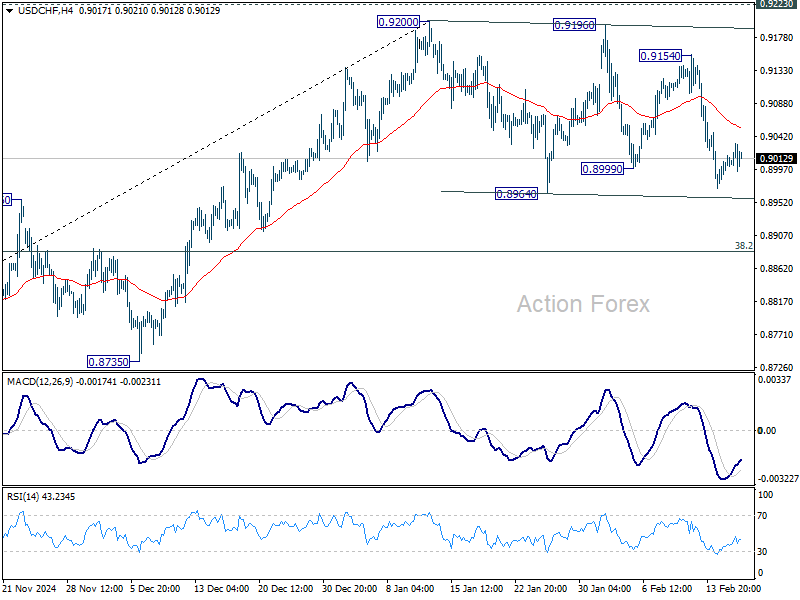
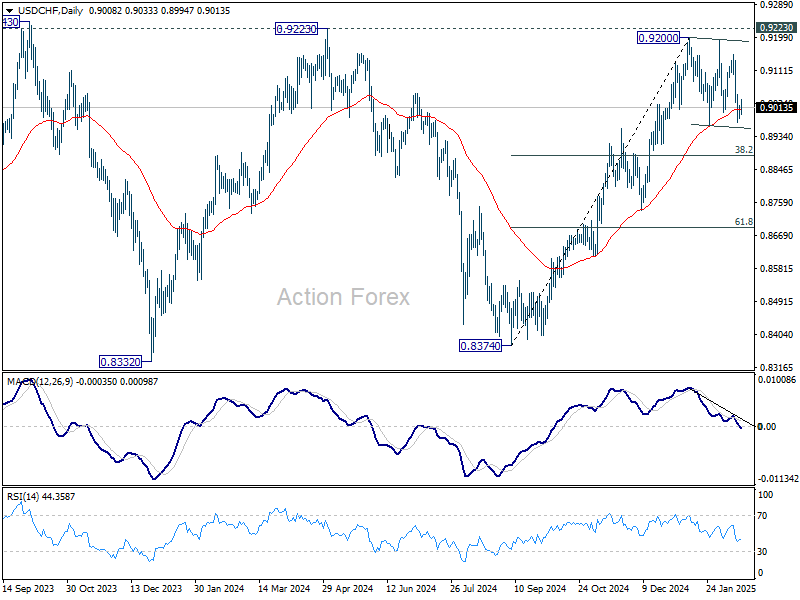
Intraday bias in USD/CHF remains neutral as consolidation from 0.9200 is still in progress. While deeper pull back might be seen, outlook will stay mildly bullish as long as 38.2% retracement of 0.8374 to 0.9200 at 0.8884 holds. On the upside, firm break of 0.9223 key resistance will carry larger bullish implication. However, sustained break of 0.8884 will indicate bearish reversal, and target 61.8% retracement at 0.8690 instead.
In the bigger picture, decisive break of 0.9223 resistance will argue that whole down trend from 1.0342 (2017 high) has completed with three waves down to 0.8332 (2023 low). Outlook will be turned bullish for 1.0146 resistance next. Nevertheless, rejection by 0.9223 will retain medium term bearishness for another decline through 0.8332 at a later stage.
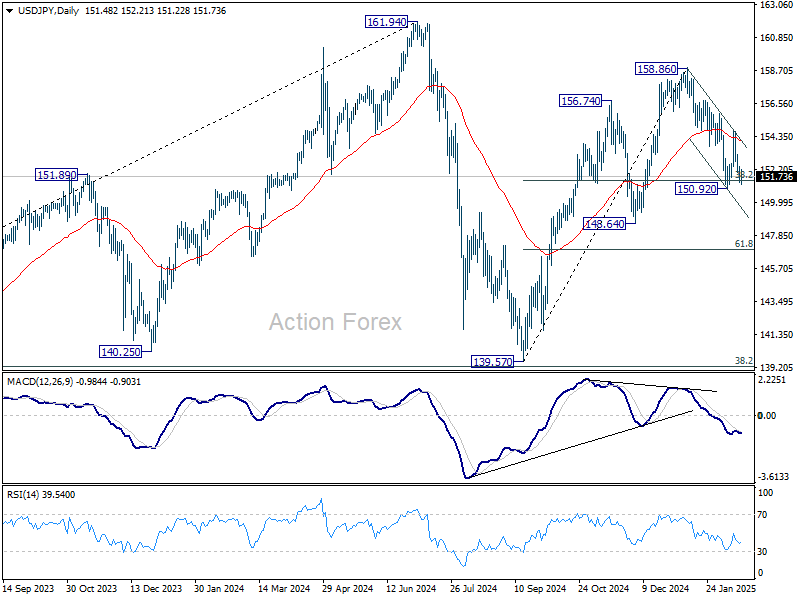
USD/JPY Mid-Day Outlook
Daily Pivots: (S1) 151.05; (P) 151.75; (R1) 152.22; More...
Intraday bias in USD/JPY remains neutral for the moment. Attention is still on 38.2% retracement of 139.57 to 158.86 at 151.4. Strong rebound from there will maintain near term bullishness. On the upside, break of 154.79 will revive the case that correction from 158.86 has completed at 150.29. Further rise should be seen to retest 158.86 high. However, break of 150.92 and sustained trading below 151.49 will raise the chance of trend reversal, and target 148.64 support instead.
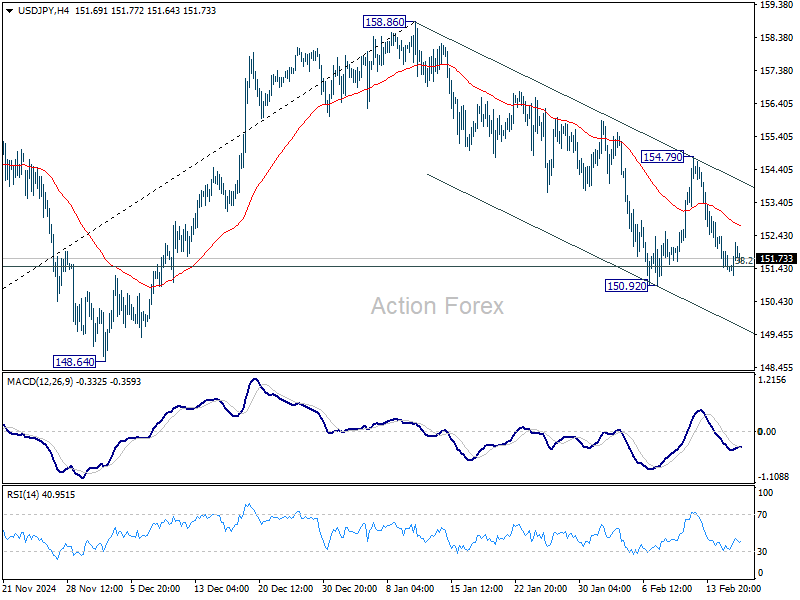
In the bigger picture, price actions from 161.94 are seen as a corrective pattern to rise from 102.58 (2021 low). In case of another fall, strong support should be seen from 38.2% retracement of 102.58 to 161.94 at 139.26 to bring rebound. However, sustained break of 139.26 would open up deeper medium term decline to 61.8% retracement at 125.25.
Canadian Inflation Moves Higher in January
Headline CPI inflation increased in January to 1.9% year-on-year (y/y), slightly above expectations for a 1.8% y/y print and more than the 1.8% y/y reading from December.
The Bank of Canada's preferred "core" inflation measures also increased to 2.7% y/y, from 2.6% y/y in December.
Energy prices were the main driver of higher inflation, with gasoline up 8.6% y/y and natural gas up 4.8% y/y. Car prices also moved higher by 2.3% y/y, the first increase in 8 months.
The impact of the GST/HST break continues to act as a downward force on inflation. Restaurant costs dropped 5.1% y/y, while alcohol costs dropped 3.6% y/y.
Key Implications
Headline inflation remains close to the BoC's 2% target, but there are signs that price pressures could move higher in the months to come. The GST/HST holiday has officially ended and the downward pressure on overall inflation will unwind. Stripping out this impact, inflation would have been 2.5% y/y, 0.6 percentage points higher than the headline print. Additionally, the three-month annualized trend of core inflation has been tracking above 3%, signaling that core inflation should continue to grind higher.
The BoC is in a difficult place. Does it weigh the downside risks to the economy in the face of U.S. tariffs, or does it focus on recent economic strength and the impact this is having on inflation? Markets are still pricing for another 25 bp cut in March, but price action this morning is paring back some of this. There is plenty of time between now and March 12th, and if the President's first few weeks are anything to go by, a lot could change before then.