
Sample Category Title
BITCOIN Bouncing Back
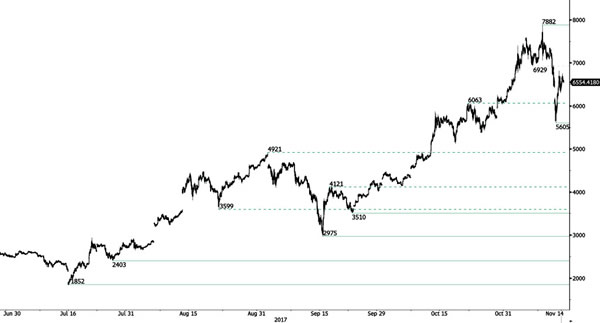
Bitcoin is now consolidating after recent surge. The technical structure shows a tremendous positive short-term momentum. Hourly support is now located at 5605 (13/11/2017 low). Strong support stands very far at 2975 (22/08/2017 low). In the short-term, the digital currency should continue rising.
In the long-term, the digital currency has had an exponential growth. There are decent likelihood that the asset will reach $10'000.
EUR/CHF Slight Weakness
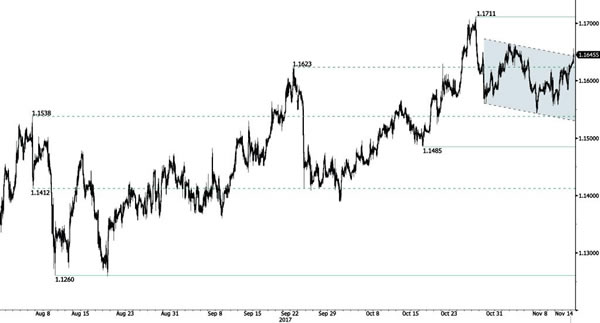
EUR/CHF has broken uptrend channel. Support is given at 1.1610 (27/10/2017 low). Expected further consolidation.
In the longer term, the technical structure has reversed. Strong resistance is given at 1.20 (level before the unpeg). Yet, the ECB's QE programme is likely to cause persistent selling pressures on the euro, which should weigh on EUR/CHF. Supports can be found at 1.0184 (28/01/2015 low) and 1.0082 (27/01/2015 low).
EUR/GBP Moving Higher Downside Risk
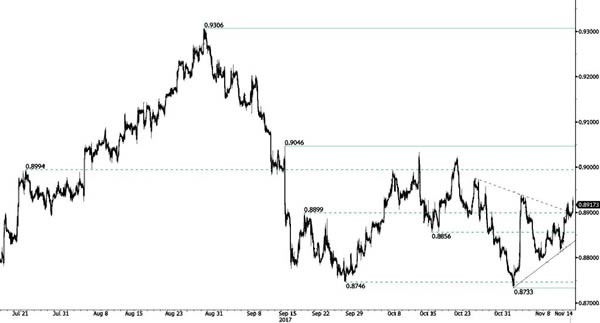
EUR/GBP lies into a symmetrical triangle. As long as prices are below the resistance at 0.9046 (05/09/2017 high), the short-term technical structure is biased to the downside. Hourly support is given at a distance at 0.8733 (01/11/2017 low).
In the long-term, the pair has largely recovered from recent lows in 2015. The technical structure suggests a growing upside momentum. The pair is trading above from its 200 DMA. Strong resistance can be found at 0.9500 (psychological level).
AUD/USD Breaking Descending Triangle
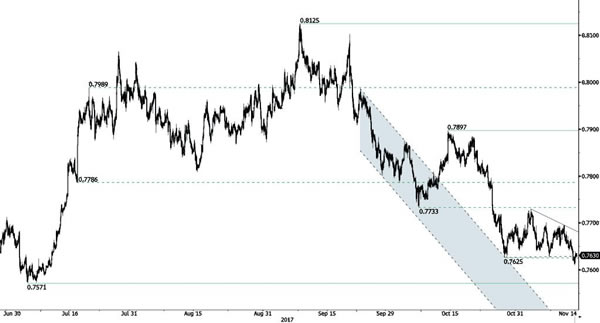
AUD/USD is ready to go even lower showing that downside pressures are still lively. Hourly resistance is given at a distance at 0.7897 (13/10/2017 high). Expected to show renewed pressures towards key support at 0.7571 (05/07/2017 low).
In the long-term, the trend is turning positive. Key supports stands at 0.6009 (31/10/2008 low) . A break of the key resistance at 0.8164 (14/05/2015 high) is needed to invalidate our long-term bearish view.
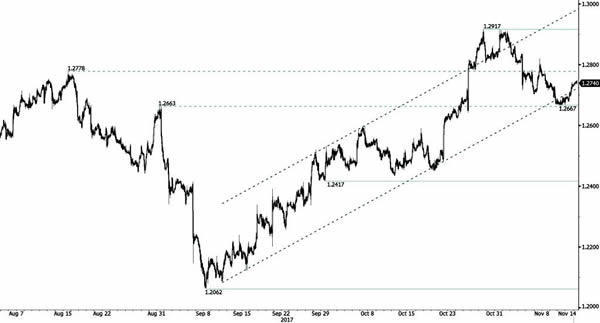
USD/CAD Starting To Bounce Back
USD/CAD is riding higher. The technical structure suggests further strengthening towards resistance at 1.2917 (27/10/2017 low). Hourly support lies at 1.2667 (10/11/2017 low). Expected to show continued upside pressures.
In the longer term, the pair has broken longterm support that can be found at 1.2461 (16/03/2015 low). Strong resistance is given at 1.4690 (22/01/2016 high). The pair is likely to head further lower.
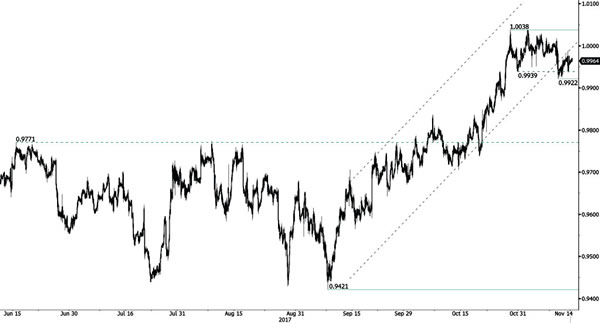
USD/CHF Sideways Price Action
USD/CHF is consolidating lower. Yet, the technical structure is still bullish. Yet, the pair has failed to hold consistently above the parity. The technical structure suggests growing selling pressures.
In the long-term, the pair is still trading in range since 2011 despite some turmoil when the SNB unpegged the CHF. Key support can be found 0.8986 (30/01/2015 low). The technical structure favours nonetheless a long term bullish bias since the unpeg in January 2015.
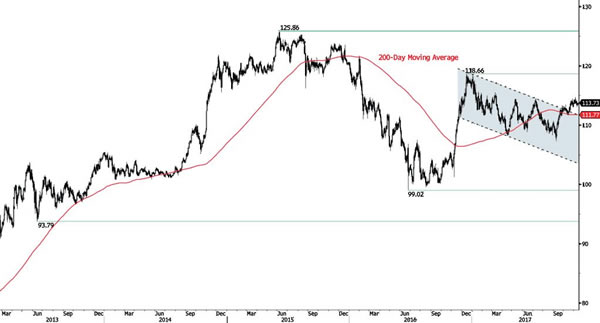
USD/JPY Breaking Downtrend Channel
USD/JPY has broken long-term downtrend channel. The pair is heading higher. Hourly support is given at 113.09 (09/10/2017 low). Strong support is located at a distance at 111.12 (20/09/2017 low).
We favor a long-term bearish bias. Support is now given at 99.02 (10/08/2013 low). A gradual rise towards the major resistance at 125.86 (05/06/2015 high) seems unlikely. Expected to decline further support at 93.79 (13/06/2013 low).
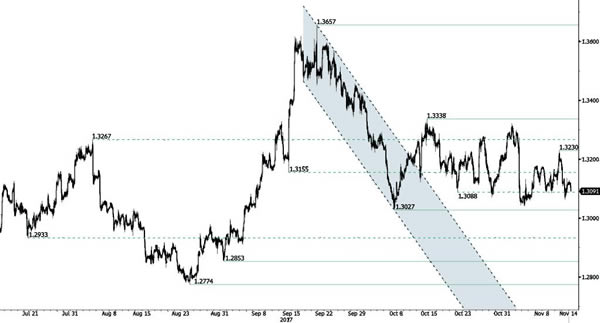
GBP/USD Ready To Monitor 1.3000 Area
GBP/USD is still holding below 1.32. Support is given at 1.3027 (06/10/2017 low). Resistance area is given around 1.3200. Expected to show further increase.
The long-term technical pattern is reversing. The Brexit vote had paved the way for further decline. Long-term support can be found at 1.1841 (07/10/2017 low). Long-term resistance given around 1.35 is at stake and indicates a long-term reversal in the negative trend. Yet, it is very unlikely at the moment.
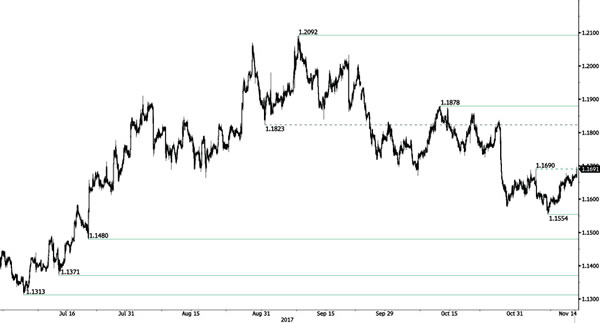
EUR/USD Short-Term Bullish Momentum
EUR/USD is edging higher at the moment. Hourly resistance is located at 1.1690 (03/11/2017 high) has been broken. Hourly support is given at 1.1554 (07/11/2017 low). Expected to show some short-term consolidation.
In the longer term, the momentum is now turning largely positive. We favour a continued bullish bias. Key resistance is holding at 1.2252 (25/12/2014 high) while strong support lies at 1.0341 (03/01/2017 low).
China’s Bond Yields Jumped, Following Suit Of US And UK, Also Reflecting Tighter Liquidity Environment
Notwithstanding disappointing headlines, China's economic activities and credit conditions in October were a result of the government's regulatory tightening and the “neutral and prudent” monetary policy with a tighter bias. China's 10 year yields jumped to a 3-year high, approaching 4%, while 5-year yields breached 4% the first time in over 3 years, on Tuesday. The surge in yields can be attributed to a confluence of factors, including a selloff of sovereign bonds after softer-than-expected macroeconomic data and a reflection of tightened liquidity in the financial system. However, we believe the most critical factor is the rallies in US yields, on expectations of a December rate hike, and UK yields, amidst BOE's rate hike earlier this month.
Retail Sales, Industrial Production and Urban FAI
Following last week's data on inflation, trade and FX reserve, China has, over the past two days, released its retail sales, industrial production and fixed asset investment (FAI), as well as credit situation, for October. Retail sales surprised to the downside in October. The year-over-year +10% growth recorded came in weaker than consensus of +10.5% as expected and September's +10.3%. Note, however, that consumers might have deferred their spending until the “double-11” event in November, thus suppressing the October data. Meanwhile, cyclically weak auto sales also contributed to softer growth. Industrial production expanded +6.2% y/y in October, in line with expectations but moderating form +6.6% in September. Looking into the details, IT & electronic goods production shows the biggest headline slowdown, resulting from the supply side constraint of several products.
Urban fixed asset investment rose +7.3%, in line with consensus and constituting the recent deceleration in growth, in the first 10 months of the year.
Tighter Credit Conditions Suppressed Loan Growth
Credit growth surprised to the downside in October, reflecting the government's deleveraging measures. Monthly new loans slumped to RMB 663B from RMB 1.27 trillion in September. This came in even worse that the market's expectations of a sharp fall to RMB 783B. Weaker than expected new loans, ending the streak of upside surprises over the past 6 months, were mainly driven by falling home mortgage and consumer credit. We find this consistent with the slower growth in urban FAI as the government heightened the property tightening measures. Note, however, that loan growth this year has remained strong as new loans have accumulated to RMB 12.1 trillion for the first 10 months of the year, compared with RMB 12.4 trillion in the full year of 2016
A key area of government regulation tightening is shadow bank financing. The sharp decline in off-balance-sheet financing in October signals the effects of regulations are being seen. New entrusted loans, trust loans and bank acceptance financing plunged to RMB 4B, RMB 102B and RMB 1B in October, from RMB 78B, RMB 237B and RMB 78B in September, respectively. As such, total off-balance-sheet financing fell to RMB 107B in October from RMB 393B a month ago. Total social financing (TSF) sank to RMB 1.04 trillion in October, from RMB1.82 trillion a month ago. Yet this marked an increase from the RMB 886.5B in the same month last year.
M2 money supply grew +8.8% y/y in October, slowing from +9.2% in September, as partly driven by the one-off large increase in fiscal deposit(to RMB 1.05 trillion from RMB 682B in the same period last year) and partly due to softer loan growth
Despite the downside surprise, the set of credit data largely reflects the government's stepping up of regulatory tightening and deleveraging measures. We expect PBOC to maintain the “prudent and neutral” monetary policy for the rest of this year and in 2018. Since the government has put its focus on deleveraging and curbing excessive investment on certain areas, its so called neutral policy is actually skewed to the tight side.