Sample Category Title
Market Update – Asian Session: Nikkei 225 Remains Volatile Amid Options Settlement
Asia Summary
Following the negative leads from the US session, Asian equity markets opened generally lower. The Nikkei 225 has remained volatile on the session, following the trading action seen on Thursday. November options for the index settled at 22,531.
Large banks in Japan are generally weaker, ahead of their earnings reports which are expected starting next week. The TOPIX Securities brokers index has dropped over 1%.
There has been some weakness in Japanese tech names, after the S&P 500 Technology sector declined by over 0.7% on Thursday.
Shares of Toshiba have declined by over 4%, following reports that the company is considering raising capital. Also, in the tech sector Softbank has declined by over 1.5%. Bucking the trend, semiconductor firm Sumco has gained over 8%, after reporting its financial results and outlook. In Hong Kong, the Hang Seng Information Technology index is higher by over 0.5%.
At the same time, the Hang Seng Energy index has declined by over 0.4%, while Australia’s ASX 200 Energy index has dropped over 1%. In the materials space, BHP has declined by over 2% and the overall ASX 200 Resources index is lower by more than 1.3%.
Key economic data
(AU) RESERVE BANK OF AUSTRALIA (RBA) QUARTERLY STATEMENT ON MONETARY POLICY (SOMP): LOWERS INFLATION FORECASTS THROUGH 2019: GDP GROWTH FORECASTS LITTLE CHANGED; Sees sub 2% core inflation until mid-2019 (**Note: RBA has a 2-3% target range for inflation)
Speakers and Press
China
(CN) China Finance Ministry: To expand corporate tax rate cuts for high tech services firms nationwide
Ford: To export ~$10B in vehicles and auto parts from North America to China
(CN) China to remove foreign ownership limit in domestic banks; raises the foreign stake ceiling in brokerages to 51%; To raise foreign stake ceiling in life insurance companies to 51%; o also, raise the foreign stake ceiling in fund management and futures companies
Other
(JP) Nikkei 225 Nov options settle at 22,531
(NZ) New Zealand Finance Min Robertson: Dual RBNZ mandate may see looser policy in some instances, central bank has role to play in maximizing employment; Expanded RBNZ monetary policy committee won't be a 'circus'; Government committed to 1-3% inflation band; RBNZ's 2% inflation focus could be up for discussion.
(US) Joint Tax Committee: US Senate Tax Proposal is within $1.5T ceiling on deficit expansion
(US) The Senate tax plan is said to just meet the $1.5T budget limit and the plan is expected to cost $1.496T over 10 years, according to a financial press report.; The report adds that the plan would repeal the interest deduction on home equity loans and eliminate deductions for personal exemptions.
Asian Equity Indices/Futures (00:30ET)
Nikkei -0.9%, Hang Seng +0.2%, Shanghai Composite flat, ASX200 -0.3%, Kospi -0.3%
Equity Futures: S&P500 flat ; Nasdaq -0.1% , Dax +0.1% , FTSE100 +0.1%%
FX ranges/Commodities/Fixed Income (00:30ET)
EUR 1.1642-1.1654; JPY 113.26-113.51; AUD 0.7664-0.7689; NZD 0.6920-0.6957
Aug Gold -0.2% at 1,285/oz; Aug Crude Oil -0.2% at $57.05/brl; Sept Copper -0.2% at $3.085/lb
GLD SPDR Gold Trust ETF daily holdings flat at 843.1 metric tons
(CN) PBOC sets yuan reference rate at 6.6282 v 6.6325 prior(CN) PBoC OMO: CNY80B v CNY40B injected in 7, 14 and 63-day reverse repos prior; Net injection CNY50B
(AU) Australia sells A$900M in 2.75% Nov 2027 bonds, avg yield 2.6201%, bid to cover 3.46x
(NZ) New Zealand sells NZ$100M in Sept 2040 inflation-indexed bonds, avg yield 2.1550%, implied bid to cover 3.01x
US markets on close: Dow -0.4%, S&P500 -0.4%, Nasdaq -0.6%, Russell -0.5%
Best Sector in S&P500: Energy +0.3%
Worst Sector in S&P500: Industrials -1.3%
At the close: VIX 10.50 (+0.72pts); Treasuries: 2-yr 1.637% (-1bp), 10-yr 2.338% (flat), 30-yr 2.814% (+2bps)
US Market Summary
US stocks opened under notable pressure as a variety of asset classes exhibited signs of modest liquidation. The VIX bumped up ~15% and bond yields rose as equity markets moved lower. Consternation surrounding Brexit negotiations and a delay in corporate tax cut implementation in the Senate tax bill appeared to be the underlying current, along with an onslaught of corporate debt/equity issuance announcements ahead of year end. The Dollar index fell as the Senate tax bill details circulated, but as the day wore on, markets pared losses a bit following comments from some senators that the final bill could still include an immediate corporate tax cut.
US Afterhours Movers
HTZ Reports Q3 $1.42 v $1.47e, Rev $2.60B v $2.58Be; International car rental rev $728M, +7% y/y; +11.4% afterhours
JWN Reports Q3 $0.67 v $0.63e, Rev $3.63B v $3.60Be; Narrows FY17 $2.85-2.95 v $2.95e, Rev +4%, SSS approx ~0% (prior FY17 $2.85-3.00, Rev +4%, SSS ~0%); -3.2% afterhours
China: Strong Inflation Unlikely Alter Monetary Policy Outlook, Trade Surplus With US Second On Record
China inflation, both upstream (PPI) and downstream (CPI), surprised to the upside in October. Headline CPI accelerated to +1.9% y/y, from +1.6% in September, beating consensus of +1.7%. Food deflation improved to -1.4% y/y in October, from September's -1.4%, whilst non-food price steadied at +2.4% y/y. Core CPI also steadied at +2.3% last month. PPI stayed unchanged at +6.9%, beating expectations of a slowdown to +6.9%. The set of data indicates gradual but smooth pass-through of inflation (from PPI to CPI), thanks to stable wage growth and improved capacity utilization. Headline CPI has a chance of rising to +2% by year-end and exceeding it in 2018. Note, however, that the upper bound of PBOC's inflation target is +3%.
Foreign Trade
China's trade surplus widened to US$ 38.2B in October from US$ 28.5B a month ago. Yet, this came in lower than consensus of US$ 39.5B. Exports growth eased to +6.9% y/y while imports growth moderated to +17.2% from +18.6% a month ago. The data indicated that exports growth probably has peaked in the middle of the year and the slowdown should continue towards winter time. China's trade surplus with the US declined to US$26.6B in October (second high on record), from US$ 28.1B a month ago. In the first 10 months of the year, the trade surplus with the US was about US$ 223B. We find it sarcastic that US President Donald
Trump is celebrating the signing of a trade deal worth of US$ 250B with China. He even dismissed previous blames on China regarding the huge deficit the US has been suffering. He appears to have overlooked the fact the trade deal is actually worth less one year's trade deficit against China.
Returning to China's trade data, growth in commodity imports decelerated across the board. For instance, iron ores imports grew +1.6% y/y, down from +10.6% a month ago, steel products imports contracted -12%, after gaining +9.7% in the previous month. All in all, commodities contributed 3.4 percentage point to imports growth, almost halving the 6.2 percentage point in September. This probably indicated decline in domestic demand.
FX Reserve
Extending the rising streak for a ninth month, China's FX reserve increased +700M to US$ 3.109 trillion in October. The increase came in less than expectations and September's +US 17B. The government has diminished intervention in the FX market as capital flow stabilized, as a result of steady renminbi movement and the government's stringent capital control measures.
Monetary Policy
The October data released so far should not alter PBOC's monetary policy. While inflation has been rising, the risk of overshooting is low. As mentioned above, unlike other major central banks where their inflation target is usually at +2%, PBOC is not expected to alter its monetary policy to a tighter side just because inflation is persistently above +2%. That said, China's interbank market rates are usually higher towards the year-end. Together with the likely Fed funds rate hike in December, we are foreseeing upward pressure on China's interbank rates.
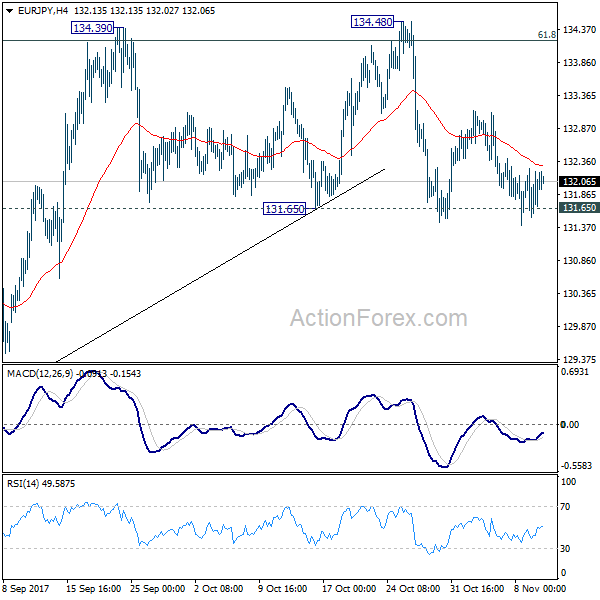
EUR/JPY Daily Outlook
Daily Pivots: (S1) 131.64; (P) 131.95; (R1) 132.38; More....
Intraday bias in EUR/JPY remains neutral with focus on 131.65 key support. As noted before, sustained break of 131.65 will confirm rejection from 134.20 fibonacci level and confirm near term reversal. And, in such case, intraday bias will be turned to the downside for 127.55 key support level. Meanwhile, in case of another rise, decisive break of 134.39/48 resistance zone is needed to confirm up trend resumption. Otherwise, even in case of rebound, near term outlook is neutral at best.
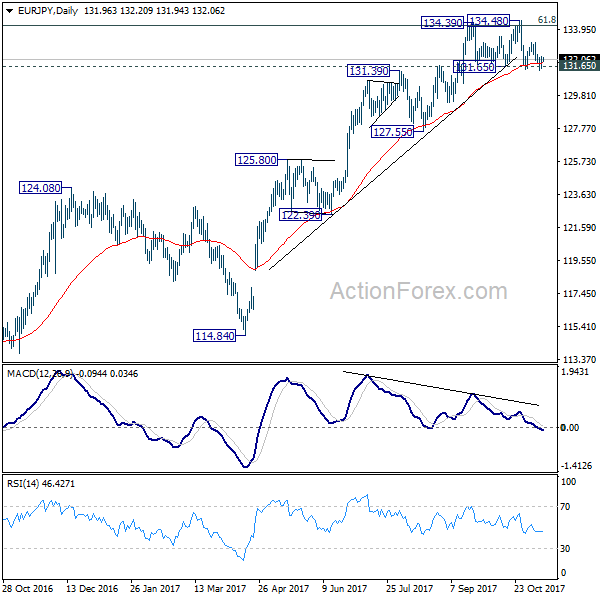
In the bigger picture, medium term rise from 109.03 (2016 low) is seen as at the same degree as the down trend from 149.76 (2014 high) to 109.03 (2016 low). 61.8% retracement of 149.76 to 109.03 at 134.20 is already met. Sustained break there will pave the way to key long term resistance zone at 141.04/149.76. However, break of 127.55 support will argue that the medium term trend has reversed and will turn outlook bearish for deeper fall back to 114.84/124.08 support zone at least.
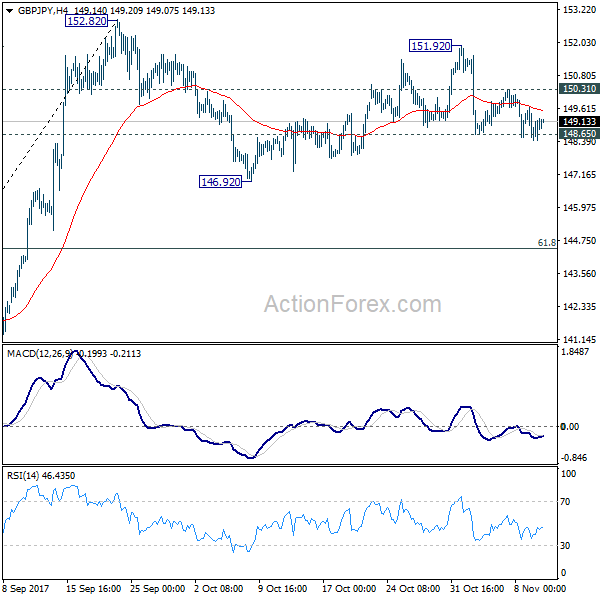
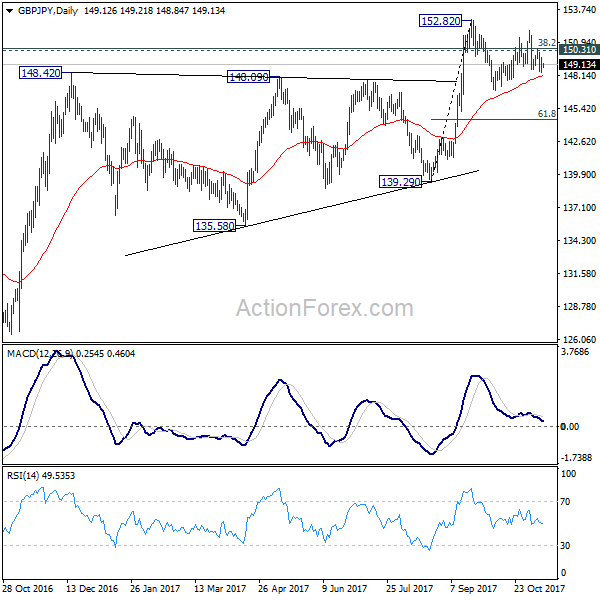
GBP/JPY Daily Outlook
Daily Pivots: (S1) 148.46; (P) 149.08; (R1) 149.76; More
No change in GBP/JPY's outlook. We're slightly favoring the case that fall from 151.92 is extending as the third leg of the correction pattern from 152.82. Intraday bias stays on the downside for 146.92 support and below. At this point, we'd expect strong support from 61.8% retracement of 139.29 to 152.82 at 144.45 to contain downside and bring rebound. On the upside, above 150.31 will turn bias back to the upside to 151.92 instead.
In the bigger picture, medium term rebound from 122.36 is still expected to resume after corrective pull back from 152.82 completes. Firm break of 38.2% retracement of 196.85 to 122.36 at 150.43 will carry long term bullish implications. In that case, GBP/JPY could target 61.8% retracement at 167.78. However, break of 139.29 will indicate rejection from 150.43 key fibonacci level. And the three wave corrective structure of rebound from 122.36 will argue that larger down trend is resuming for a new low below 122.26.
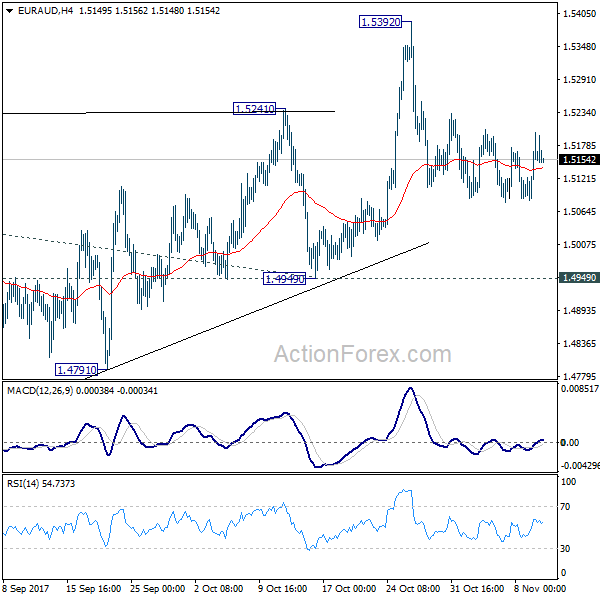
EUR/AUD Daily Outlook
Daily Pivots: (S1) 1.5093; (P) 1.5146; (R1) 1.5210; More....
EUR/AUD is staying in consolidation from 1.5392 and intraday bias remains neutral at this point. With 1.4949 support intact, outlook remains bullish and further rally is expected. On the upside, break of 1.5392 will resume medium term rise from 1.3624 and target 61.8% projection of 1.3624 to 1.5226 from 1.4949 at 1.5939 first. However, decisive break of 1.4949 will carry larger bearish implication and turn bias to the downside.
In the bigger picture, we're holding on to the view that corrective decline from 1.6587 medium term top has completed at 1.3624. Rise from 1.3624 is expected to extend to retest 1.6587. However, break of 1.4949 support will dampen our view and argue that rise from 1.3624 has completed. In that case, EUR/AUD would turn southward for retesting 1.3624 low.

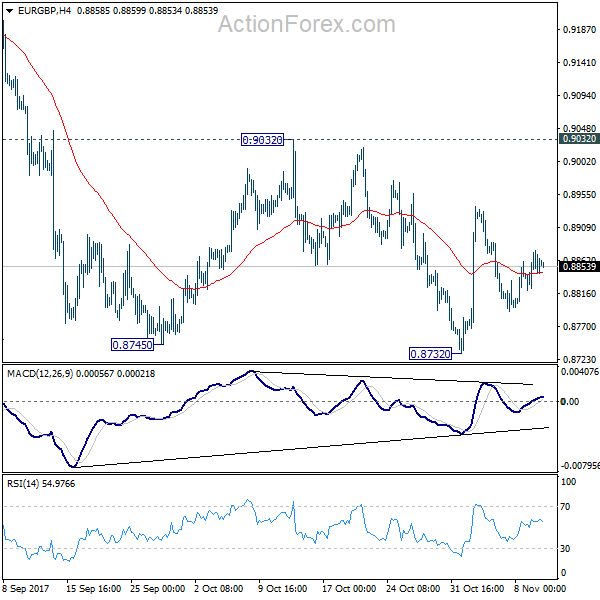
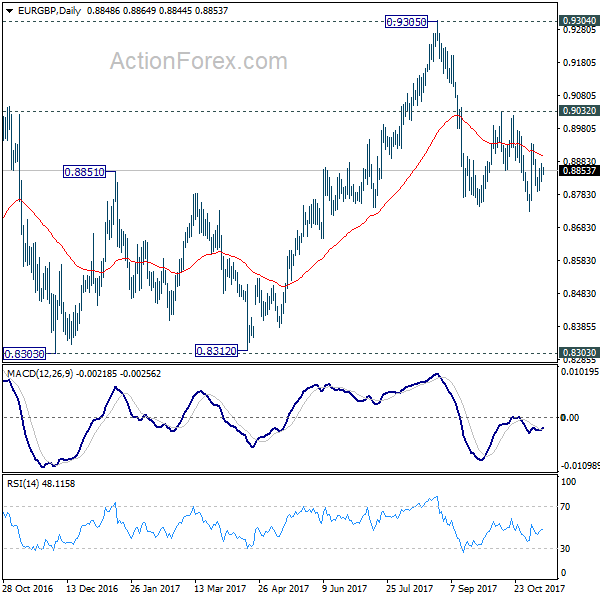
EUR/GBP Daily Outlook
Daily Pivots: (S1) 0.8827; (P) 0.8851; (R1) 0.8879; More...
At this point, intraday bias in EUR/GBP remains neutral at the moment as sideway trading continues. On the upside, decisive break of 0.9032 will confirm completion of the decline from 0.9305. In such case, intraday bias will be turned back to the upside for retesting 0.9305 key resistance. On the on the downside, break of 0.8732 will resume the fall and target 0.8303 key support level instead.
In the bigger picture, there are various ways to interpret price actions from 0.9304 high. But after all, firm break of 0.9304/5 is needed to confirm up trend resumption. Otherwise, range trading will continue with risk of deeper fall. And in that case, EUR/GBP could have a retest on 0.8303. But we'd expect strong support from 0.8116 cluster support (50% retracement of 0.6935 to 0.9304 at 0.8120) to contain downside.
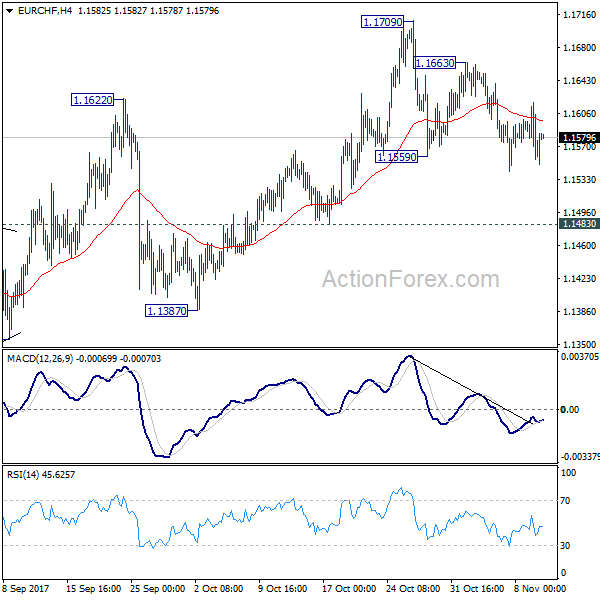
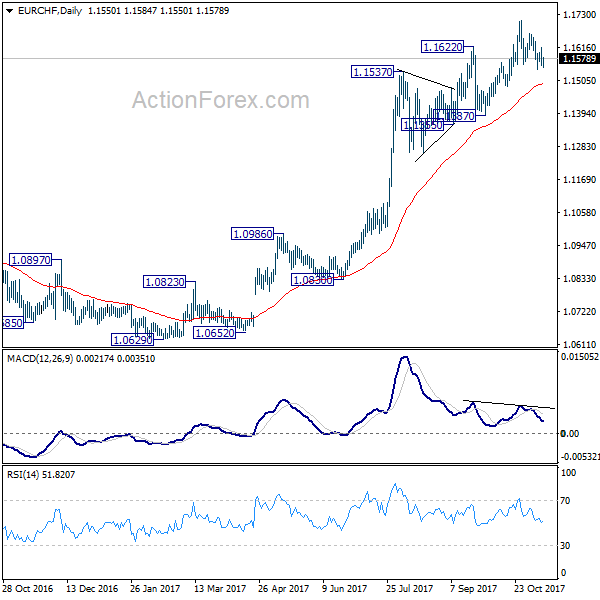
EUR/CHF Daily Outlook
Daily Pivots: (S1) 1.1544; (P) 1.1581; (R1) 1.1608; More...
EUR/CHF's corrective fall from 1.1709 is still in progress and deeper decline could be seen. But still, near term outlook stays bullish with 1.1483 support holds. Above 1.1663 minor resistance will turn bias back to the upside for 1.1709 high. Break will resume medium term rally to 1.2 key level. However, break of 1.1483 will be an early sign of reversal. In that case, deeper decline should be seen back to 1.1355 support.
In the bigger picture, long term rise from SNB spike low back in 2015 is still in progress. EUR/CHF should now be heading back to prior SNB imposed floor at 1.2000. For now, this will be the favored case as long as 1.1355 support holds. However, break of 1.1355 will indicate medium term topping. In that case, EUR/CHF should head back to 55 week EMA (now at 1.1104) and possibly below.
Daily Wave Analysis: GBP/USD Builds Contracting Triangle In Descending Wedge
Currency pair GBP/USD
The GBP/USD is testing the Fibonacci levels of wave 4 (orange). A break above the 61.8% Fib makes a wave 4 (orange) less likely whereas a break below support could indicate a bearish breakout. Price is building a smaller triangle in a larger wedge pattern (red/blue lines).
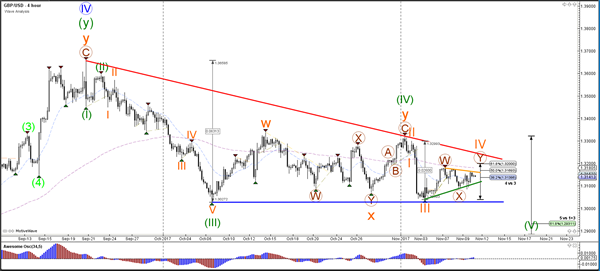
The GBP/USD is in a contracting triangle which is marked by clear support (green) and resistance (orange).

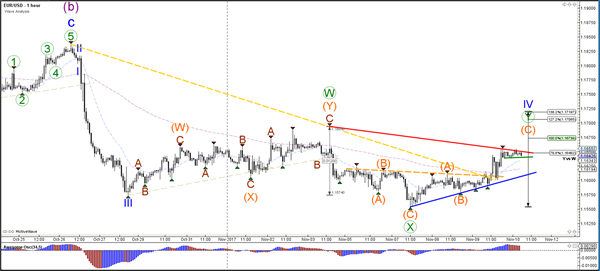
Currency pair EUR/USD
EUR/USD is making a larger bullish retracement within the downtrend. The Fibonacci levels of wave 4 (blue) could act as resistance if price breaks above the trend line (orange). A break below the support trend line (blue) could indicate a potential bearish breakout within wave 5 (blue).

The EUR/USD seems to be building an ABC (orange) within a wave 4 (green) correction.
Currency pair USD/JPY
The USD/JPY broke below the support trend line (dotted blue) but price action remains choppy. The failure to break the 114.50-115 resistance zone so far could be an early indication that wave 1 or A (light purple) has been completed.
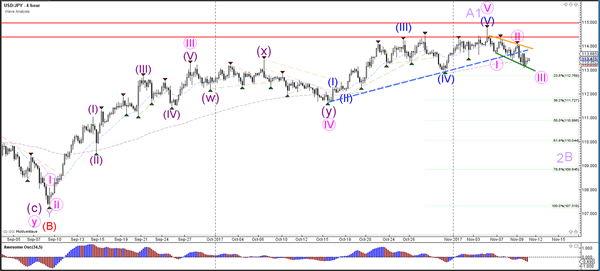
The USD/JPY is behaving choppily and building a corrective pattern on this 1-hour chart.

Elliott Wave View: FTSE
FTSE Elliott Wave view suggests that the decline to 7199.5 ended Primary wave ((4)). Up from there, the rally is unfolding as a zigzag Elliott Wave structure where Intermediate wave (A) ended at 7565.11 and pullback to 7437.42 ended Intermediate wave (B). Intermediate wave (A) is subdivided as an impulse Elliott Wave structure. Minor wave 1 ended at 7327.5, Minor wave 2 ended at 7289.75, Minor wave 3 ended at 7527.72, Minor wave 4 ended at 7493.68, and Minor wave 5 of (A) ended at 7565.11.
Intermediate wave (B) pullback ended at 7437.42 as a double three Elliott Wave structure. Minor wave W ended at 7485.42, Minor wave X ended at 7560.04, and Minor wave Y of (B) ended at 7437.42. Intermediate wave (C) is currently in progress as 5 waves where Minor wave 1 ended at 7582.85. Minor wave 2 pullback is in progress towards 7436.86 – 7455.32 area before Index resumes the rally higher or at least bounce in 3 waves. This view remains valid as far as pivot at 10/25 low (7436.69) remains intact.
Alternatively, if pivot at 7436.69 fails, then the Index can be doing a FLAT correction from 10/12 high. In this alternate scenario, Minor wave A ended at 7436.92, Minor wave B ended at 7582.85, and Index is currently in Minor wave C as 5 waves to correct cycle from 9/15 low (7197.66) before the Index resumes the rally higher. In conclusion, the Index at this stage remains bullish against 10/25 low (7436.69) in the first degree and against 9/15 low (7197.66) in the second degree.
FTSE 1 Hour Elliott Wave Analysis
EUR/USD Daily Outlook
Daily Pivots: (S1) 1.1598; (P) 1.1626 (R1) 1.1668; More...
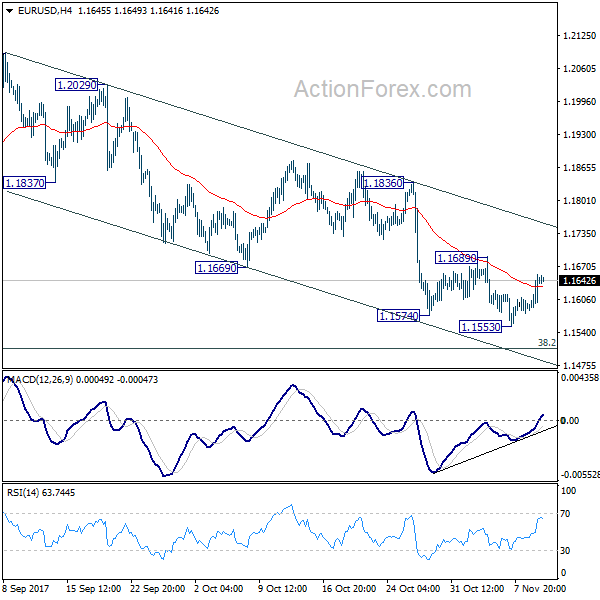
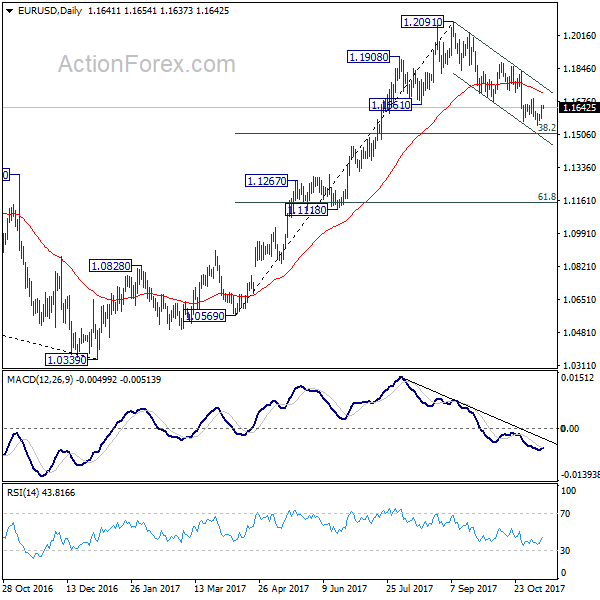
Intraday bias in EUR/USD stays neutral for the moment. Overall, with 1.1689 resistance intact, fall from 1.2091 is in progress for 38.2% retracement of 1.0569 to 1.2091 at 1.1510. We'd be cautious on strong support from there to bring rebound. But sustained break of 1.1510 will pave the way to next support zone at 1.1118/1267. On the upside, break of 1.1689 resistance is needed to confirm short term bottoming. Otherwise, outlook will remain bearish in case of recovery.
In the bigger picture, rise from 1.0339 medium term bottom is seen as a corrective move for the moment. Therefore, in case of another rally, we'd be cautious on 38.2% retracement of 1.6039 (2008 high) to 1.0339 (2017 low) at 1.2516 to limit upside and bring reversal. Meanwhile, sustained trading below 55 week EMA will suggest that such medium term rebound is completed and could then bring retest of 1.0339 low.