Sample Category Title
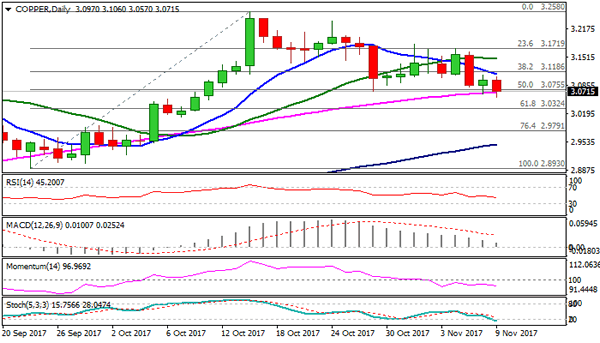
Copper – Probe Below Key Supports Signals Bearish Continuation
Copper resumed bear-leg from $3.1715 lower top after bears took a breather on Wednesday.
Fresh weakness probed below $3.0715/$3.0650 (lows of 27 Oct and 08 Nov) and dented 55SMA which reinforces supports.
Close below here would generate bearish signal for extension towards next target at $3.0324 (Fibo 61.8% of $2.8930/$3.2580 ascend). Daily cloud twists below ($3.0038) and attracts for further weakness.
Falling 10SMA marks key near-term barrier ($3.1119) which is expected to keep the upside protected.
Res: 3.1060; 3.1119; 3.1193; 3.1472
Sup: 3.0684; 3.0570; 3.0324; 3.1119
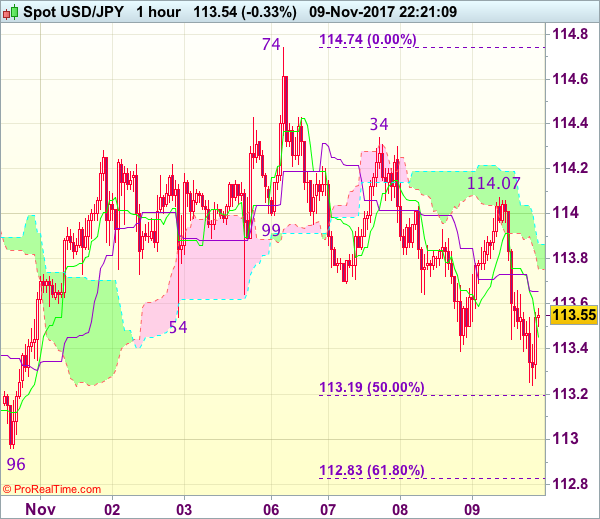
Trade Idea Wrap-up: USD/JPY – Hold short entered at 114.00
USD/JPY - 113.55
Most recent candlesticks pattern : N/A
Trend : Near term down
Tenkan-Sen level : 113.45
Kijun-Sen level : 113.87
Ichimoku cloud top : 113.75
Ichimoku cloud bottom : 113.66
Original strategy :
Sold at 114.00, Target: 113.00, Stop: 114.00
Position : - Short at 114.00
Target : - 113.00
Stop : - 114.00
New strategy :
Hold short entered at 114.00, Target: 113.00, Stop: 114.00
Position : - Short at 114.00
Target : - 113.00
Stop : - 114.00
As the greenback has dropped today after meeting renewed selling interest at 114.07 (we recommended to sell at 114.00 and a short position was entered), retaining our bearishness for the fall from 114.74 top to extend weakness to 113.15-20 (50% Fibonacci retracement of 111.65-114.74), then test of previous support at 112.96, however, break of latter level is needed to add credence to this view, bring further subsequent selloff to 112.60 but support at 112.30 should hold from here due to near term oversold condition.
In view of this, we are holding on to our short position entered at 114.00. Only above resistance at 114.34 would abort and signal the retreat from 114.74 has ended instead, bring retest of this level first, above there would revive bullishness and extend recent rise from 107.32 to 115.00.
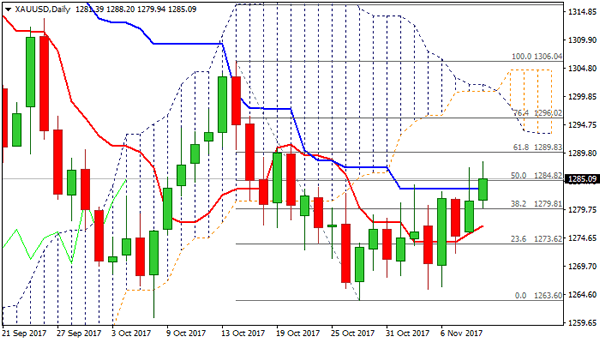
Spot Gold Extends Recovery above Key Kijun-Sen Barrier as Daily Cloud Twist Continues to Attract
Spot Gold advanced further on Thursday and eventually broke above one-week congestion which was capped by sideways-moving daily Kijun-sen ($1284). The yellow metal was supported by weaker dollar and dragged by daily cloud twist, hitting session high at $1288, the highest since 20 Oct. Close above Kijun-sen line is minimum requirement to signal bullish continuation and avoid scenario from Wednesday when strong upside rejection left daily candle with long upper shadow. Near-term recovery eyes initial target at $1289 (Fibo 61.8% of $1306/$1263 downleg) and could extend towards daily cloud base at $1300. Conversely, prolonged consolidation could be expected on repeated failure to clear Kijun-sen barrier, while increased downside risk would come on return below pivotal support at $1276 (daily Tenkan-sen).
Res: 1289; 1291; 1296; 1300
Sup: 1283; 1280; 1276; 1272
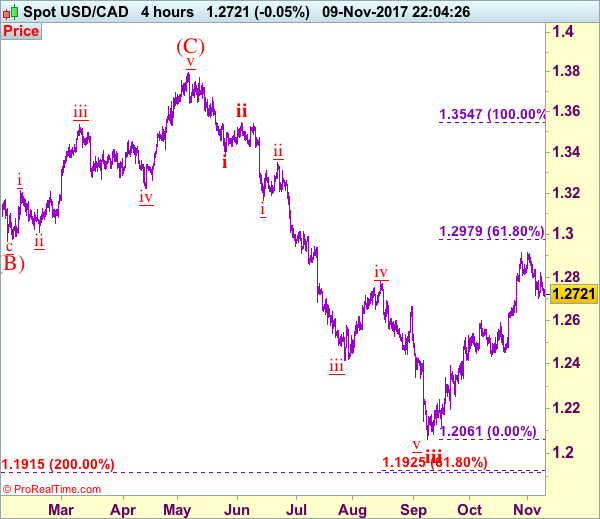
Trade Idea: USD/CAD – Stand aside
USD/CAD - 1.2727
Trend: Near term up
New strategy :
Stand aside
Position: -
Target: -
Stop:-
Although the greenback slipped again to as low as 1.2687, lack of follow through selling and current rebound suggest consolidation would be seen and recovery to 1.2770-75 cannot be ruled out, however, break of resistance at 1.2820 is needed to signal the fall from 1.2917 top has ended, bring further gain to 1.2836, then towards 1.2880 but said resistance at 1.2917 should hold. Looking ahead, as we are still treating this rebound from 1.2061 as wave iv, reckon 1.2975-80 (61.8% Fibonacci retracement of wave iii) would limit upside and 1.3000 should hold, bring selloff later in wave v. We are keeping our count that wave v as well as wave (C) ended at 1.3794 and impulsive wave (i ii, i ii) is now unfolding with minor wave iii ended at 1.2414, followed by wave iv correction ended at 1.2778, wave v has reached our indicated downside target at 1.2100 and may extend to 1.2000.
On the downside, below said support at 1.2687 would signal the fall from 1.2917 top is still in progress for a least a retracement of recent rise to 1.2670, then test of support at 1.2636 but a drop below this level is needed to signal recent rise has ended at 1.2917, bring further fall to 1.2600 and later towards 1.2550-60.
To recap, wave B from 1.3066 is unfolding as an a-b-c and is sub-divided as a: 1.2192, b: 1.2716 and wave c is a 5-waver with i: 1.1983, ii: 1.2506, extended wave iii with minor iii at 1.0206, wave iv ended at 1.0781 and wave v as well as wave iii has ended at 0.9931, hence the subsequent choppy trading is the wave iv which is unfolding as (a)-(b)-(c) with (a) leg of iv ended at 1.0854, followed by (b) leg at 1.0108 and (c) leg as well as the wave iv ended at 1.0674. The wave v is sub-divided by minor wave (i): 0.9980, (ii): 1.0374, (iii): 0.9446, (iv): 0.9913 and (v) as well as v has possibly ended at 0.9407, therefore, consolidation with upside bias is seen for major correction, indicated target at 1.3700 and 1.4000 had been met and further gain to 1.4700 would be seen later.
CAC Slips on Further Corporate Earning Releases
The CAC index has posted considerable losses in the Thursday session. Currently, the CAC is trading at 5,420.25, down 0.93% on the day. On the release front, there are no French or eurozone indicators on the schedule. The European Union will release its economic forecast, which provides analysis and economic activity of the 28 EU members.
European corporate earnings continue to weigh on the stock markets, and the CAC has lost ground on Thursday. Most of the listings on the CAC are in red territory, including car makers Peugeot and Renault, which have declined 2.91% and 1.39%, respectively. Still, the CAC continues to trade at high levels, boosted by the improving French economy. The Bank of France expects another solid performance in the fourth quarter, with an estimate of 0.5 percent growth. The INSEE official statistics agency is predicting 1.8 percent growth in 2017, which would be the economy's best performance since 2011. The manufacturing and services sectors have surged, and stronger private consumption is expected to continue to boost share prices, so the picture looks rosy for the CAC.
The eurozone economy continues to impress in 2017, and retail sales, the primary gauge of consumer spending, rebounded sharply in September. The reading of 0.7% came after two straight declines, and marked the strongest gain since February. Consumer confidence is high, and the markets are hoping for stronger consumer spending in the fourth quarter.
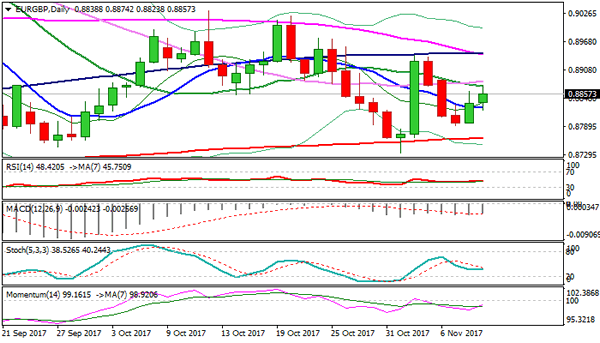
EURGBP – Recovery Tested 20SMA Barrier and Could Extend Towards Daily Cloud Base on Break
The cross extends bounce from 0.8791 where higher low is forming and tests strong barrier at 0.8874 (20SMA). Firm break here is needed to signal continuation of two-day rally from 0.8791 and open key barriers at 0.8910 (base of thick daily cloud) and 0.8938 (peak of 02 Nov post BoE strong rally). Bullishly aligned near-term techs are supportive, however, negative tone that prevails on daily chart (double bear-cross of 20/30SMA and 55/100SMA) weighs and requires caution of possible stall at 20SMA. The downside was protected today by 10SMA (0.8830) and break here would be bearish signal.
Res: 0.8874; 0.8885; 0.8910; 0.8938
Sup: 0.8830; 0.8791; 0.8765; 0.8732
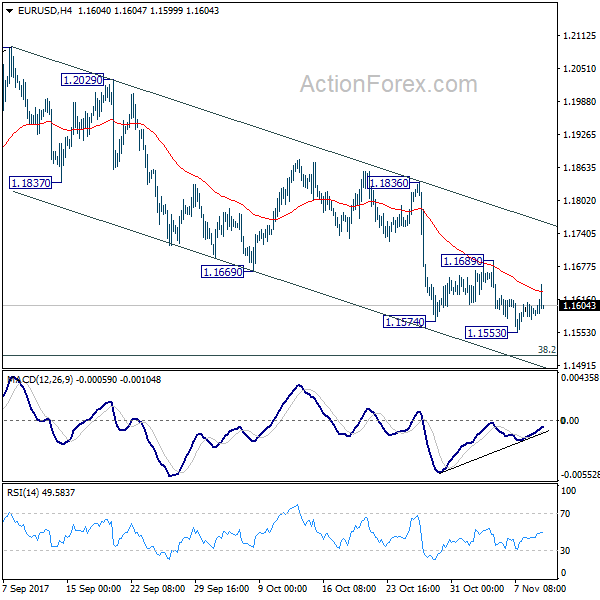
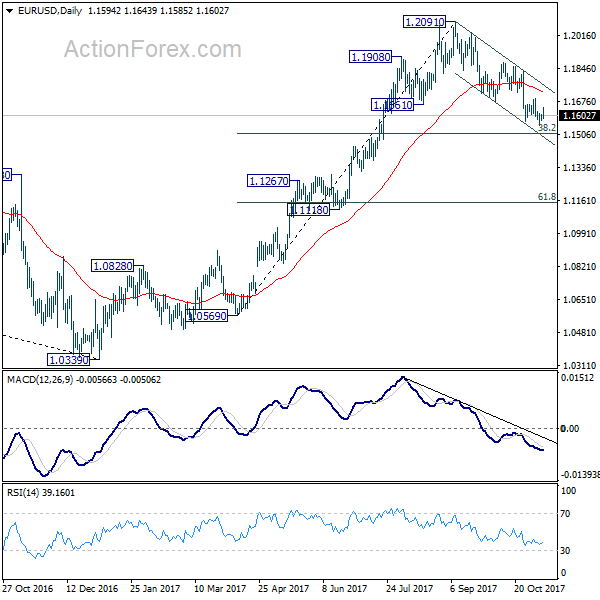
EUR/USD Mid-Day Outlook
Daily Pivots: (S1) 1.1577; (P) 1.1594 (R1) 1.1610; More...
Intraday bias in EUR/USD stays neutral for the moment. Overall, with 1.1689 resistance intact, fall from 1.2091 is in progress for 38.2% retracement of 1.0569 to 1.2091 at 1.1510. We'd be cautious on strong support from there to bring rebound. But sustained break of 1.1510 will pave the way to next support zone at 1.1118/1267. On the upside, break of 1.1689 resistance is needed to confirm short term bottoming. Otherwise, outlook will remain bearish in case of recovery.
In the bigger picture, rise from 1.0339 medium term bottom is seen as a corrective move for the moment. Therefore, in case of another rally, we'd be cautious on 38.2% retracement of 1.6039 (2008 high) to 1.0339 (2017 low) at 1.2516 to limit upside and bring reversal. Meanwhile, sustained trading below 55 week EMA will suggest that such medium term rebound is completed and could then bring retest of 1.0339 low.
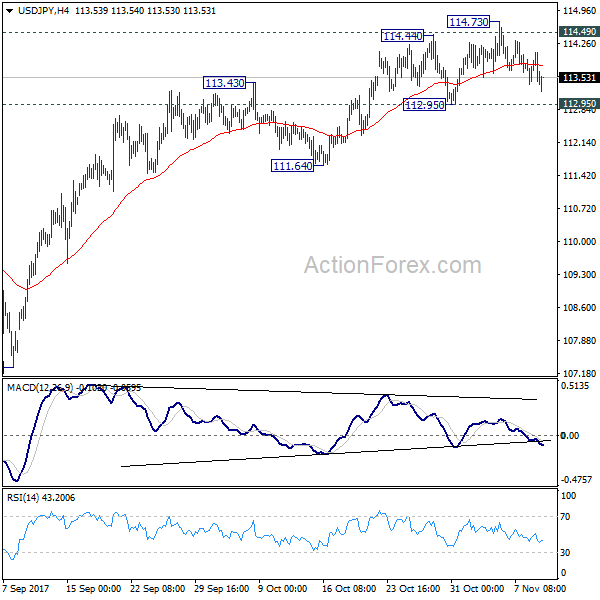
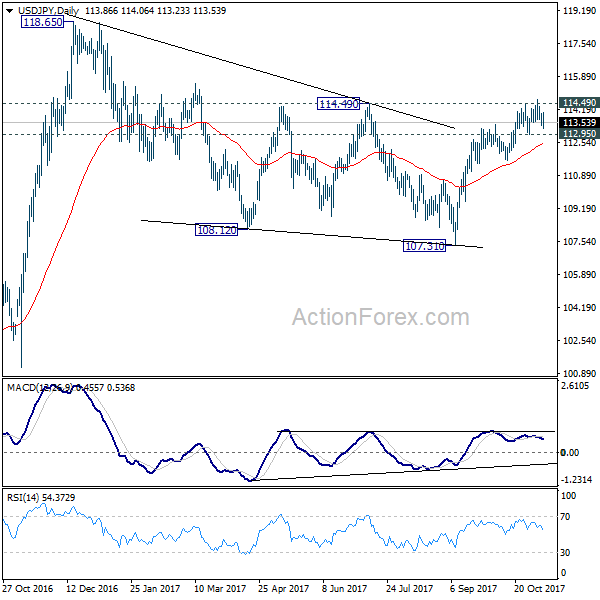
USD/JPY Mid-Day Outlook
Daily Pivots: (S1) 113.51; (P) 113.75; (R1) 114.12; More...
USD/JPY's pull back from 114.73 extends lower today. But still, it's staying above 112.95 support. Near term outlook remains bullish and further rally is expected. Sustained trading above 114.49 key resistance will pave the way to retest 118.65 high. However, break of 112.95 support will now indicate rejection from 114.49 and turn bias to the downside for 111.64 support and below.
In the bigger picture, medium term rise from 98.97 (2016 low) is not completed yet. It should resume after corrective fall from 118.65 completes. Break of 114.49 resistance will likely resume the rise to 61.8% projection of 98.97 to 118.65 from 107.31 at 119.47 first. Firm break there will pave the way to 100% projection at 126.99. This will be the key level to decide whether long term up trend is resuming.
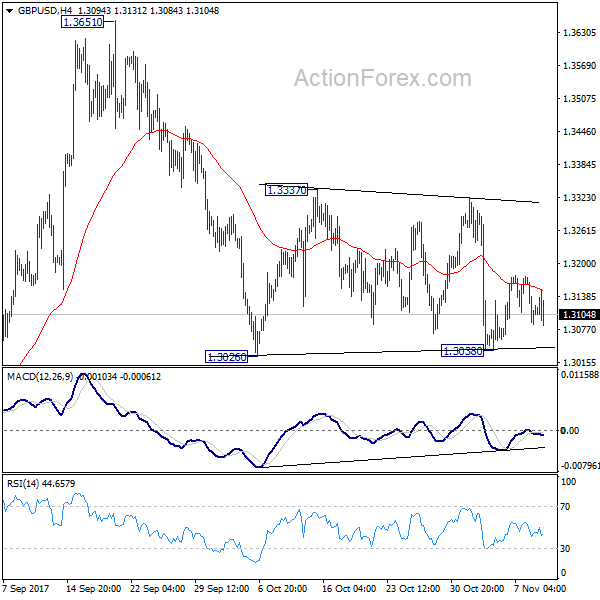
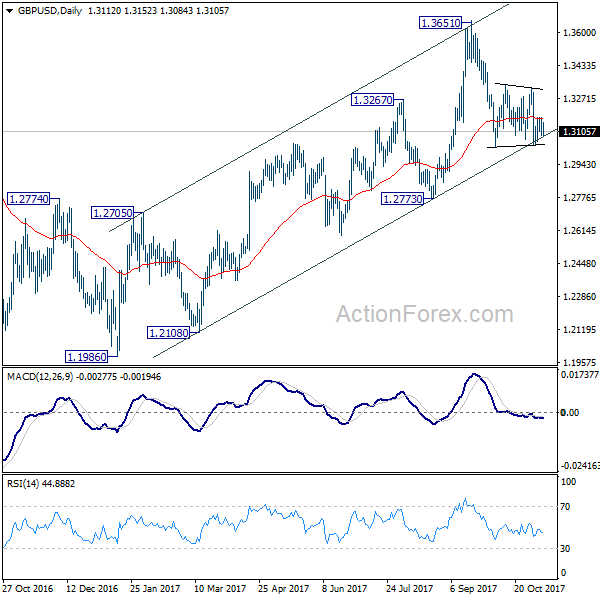
GBP/USD Mid-Day Outlook
Daily Pivots: (S1) 1.3076; (P) 1.3125; (R1) 1.3165; More....
GBP/USD struggles to take out 4 hour 55 EMA and weakens mildly. But it's staying in range of 1.3038/3337. Intraday bias remains neutral and consolidative trading would continue. In case of stronger rise, upside should be limited below 1.3337 resistance to bring fall resumption. Break of 1.3038 will now resume decline from 1.3651 to 1.2773 key support level. However, decisive break of 1.3337 will indicate that pull back from 1.3651 is completed and medium term rise from 1.1946 is resuming.
In the bigger picture, as noted before, GBP/USD hit strong resistance from the long term falling trend line. Current development is starting to favor that corrective rebound from 1.1946 low has completed at 1.3651. Decisive break of 1.2773 will confirm this bearish case and target a test on 1.1946 low next, with prospect of resuming the low term down trend. Nonetheless, break of 1.3320 resistance will restore the rise from 1.1946 for 38.2% retracement of 2.1161 (2007 high) to 1.1946 (2016 low) at 1.5466.
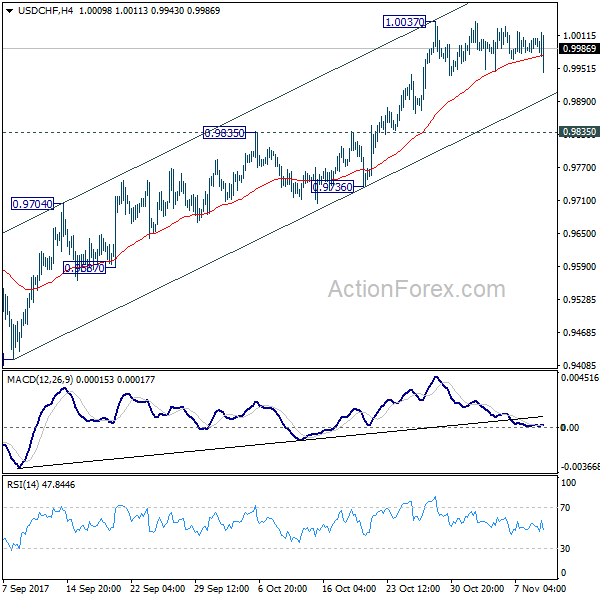
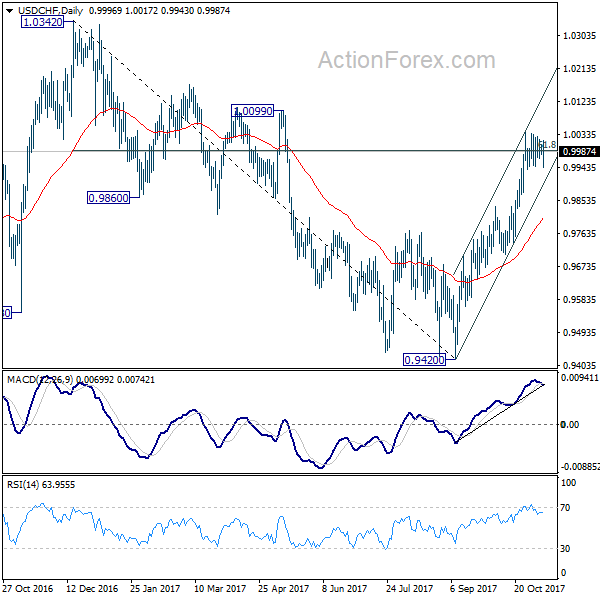
USD/CHF Mid-Day Outlook
Daily Pivots: (S1) 0.9986; (P) 0.9996; (R1) 1.0012; More....
USD/CHF spikes lower today but quickly recovers. The pair is staying in consolidation from 1.0037 and intraday bias remains neutral. We'd continue to expect downside of retreat to be contained above 0.9835 resistance turned support and bring rally resumption. On the upside break of 1.0037 will resume whole rally from 0.9420. And with sustained trading above 61.8% retracement of 1.0342 to 0.9420 at 0.9990, USD/CHF should then target a test on 1.0342 key resistance.
In the bigger picture, current development suggests that USD/CHF has defended 0.9443 (2016 low) key support level again. Rise from 0.9420 could is a medium term up move and should target a test on 1.0342 high. This represents the upper end of a long term range that started back in 2015. On the downside, break of 0.9736 support is now needed to indicate completion of the rise from 0.9420. Otherwise, further rally will remain in favor in medium term.