Sample Category Title
Forex Technical Analysis: EUR/USD, USD/JPY, GBP/USD
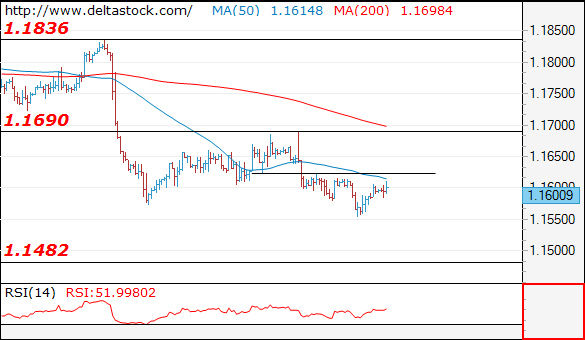
EUR/USD
Current level - 1.1606
The overall outlook remains bearish for 1.1480, while below 1.1623 minor resistance. Crucial on the upside is 1.1690.
| Resistance | Support | ||
| intraday | intraweek | intraday | intraweek |
| 1.1635 | 1.1840 | 1.1570 | 1.1480 |
| 1.1720 | 1.1940 | 1.1480 | 1.1300 |
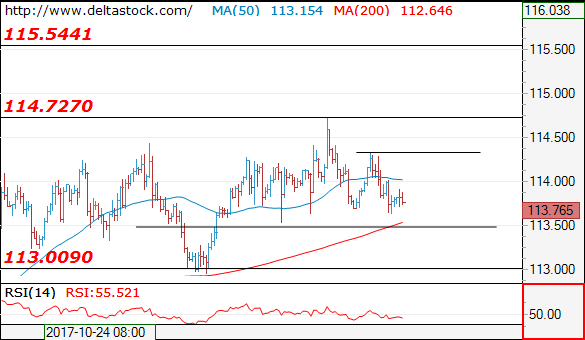
USD/JPY
Current level - 113.95
The intraday bias is bearish, for a tight test of 113.50 support. Crucial on the upside is 114.32 and a violation of that high will signal a rise towards 115.50.
| Resistance | Support | ||
| intraday | intraweek | intraday | intraweek |
| 114.32 | 115.50 | 113.50 | 111.00 |
| 115.50 | 116.80 | 113.05 | 107.30 |
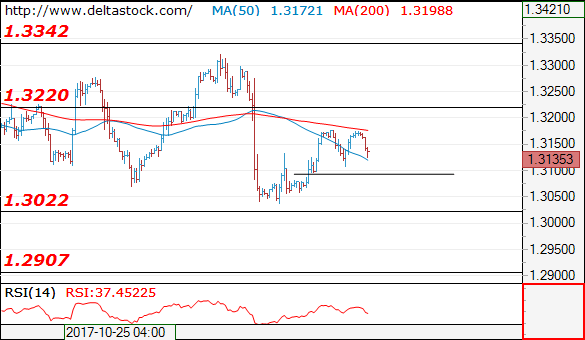
GBP/USD
Current level - 1.3165
Allow an intraday dip to 1.3090 before climb to 1.3220 resistance. The latter should cap the upside, for a renewal of the general downtrend towards 1.2910.
| Resistance | Support | ||
| intraday | intraweek | intraday | intraweek |
| 1.3167 | 1.3220 | 1.3090 | 1.3020 |
| 1.3220 | 1.3340 | 1.3020 | 1.2760 |
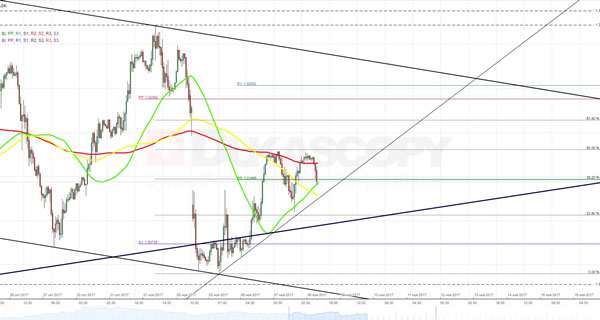
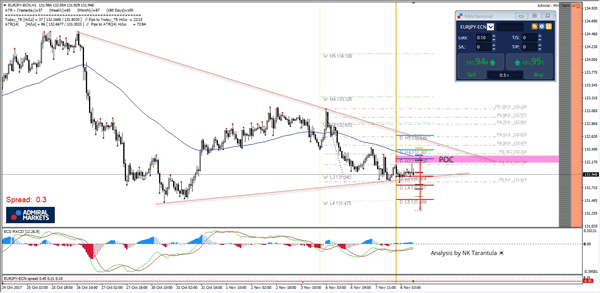
EURJPY Consolidation Breakout Possible
Different Forex crosses are breaking out of their consolidation phase, making breakouts off the important levels as we could see yesterday in the example of the GBP/NZD. Today we have a consolidation with a possible breakout on EUR/JPY. The POC zone 132.12-132.30 (D H3, EMA89, 38.2,are pivot) could reject the price towards 131.90. Break below 131.90 might target 131.75 and 131.30. The current ATR is 37 pips while the projected ATR is 86 pips so the price still has the room till next support levels.
W L3 - Weekly Camarilla Pivot (Weekly Interim Support)
W H3 - Weekly Camarilla Pivot (Weekly Interim Resistance)
W H4 - Weekly Camarilla Pivot (Strong Weekly Resistance)
D H4 - Daily Camarilla Pivot (Very Strong Daily Resistance)
D L3 – Daily Camarilla Pivot (Daily Support)
D L4 – Daily H4 Camarilla (Very Strong Daily Support)
POC - Point Of Confluence (The zone where we expect price to react aka entry zone)
Trade Idea: GBP/USD – Hold short entered at 1.3170
GBP/USD – 1.3137
Original strategy :
Sold at 1.3170, Target: 1.3000, stop: 1.3230
Position: - Short at 1.3170
Target: - 1.3000
Stop: - 1.3230
New strategy :
Hold short entered at 1.3170, Target: 1.3000, stop: 1.3230
Position: - Short at 1.3170
Target: - 1.3000
Stop:- 1.3230
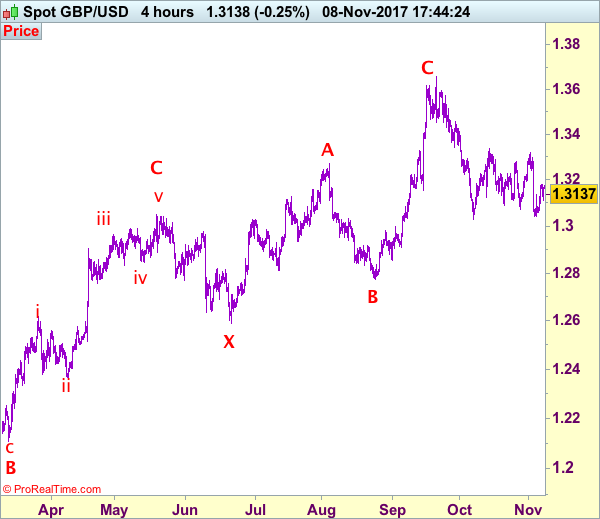
Although sterling rebounded to as high as 1.3178 yesterday, as this move from 1.3039 (last week’s low) is still viewed as retracement of recent decline, reckon upside would be limited to 1.3200 and bring another decline later, below 1.3070-75 would suggest the rebound from 1.3039 has ended and bring retest of this level later. Looking ahead, a break below recent low at 1.3027 would confirm early decline from 1.3658 top has resumed for weakness to psychological support at 1.3000, break there would encourage for further decline towards 1.2950-60 later.
In view of this, we are holding on to our short position entered at 1.3170. Above 1.3220 would defer and prolong choppy consolidation, risk rebound to 1.3250-60 but resistance at 1.3299 should limit upside and price should falter below last week’s high at 1.3321, bring another retreat later. Our preferred count is that (pls see the attached chart) the wave IV is unfolding as a complex double three (ABC-X-ABC) correction with 2nd wave B ended at 1.2774, hence 2nd wave C could have ended at 1.3658.
Our preferred count on the daily chart is that cable's rebound from 1.3500 (wave (A) trough) is unfolding as a wave (B) with A ended at 1.7043, followed by triangle wave B and wave C as well as wave (B) has ended at 1.7192, the subsequent selloff is the larger degree wave (C) which is still unfolding with minor wave (III) of larger degree wave 3 ended at 1.1986, hence wave (IV) correction is in progress which could either be a triangle wave (IV) of a complex formation but upside should be limited to 1.3500 and price should falter well below 1.4000, bring another decline in wave (V) of 3 for weakness to 1.1500, then 1.1200.
Trade Idea: GBP/JPY – Hold short entered at 150.20
GBP/JPY - 149.40
Original strategy:
Sold at 150.20, Target: 148.20, Stop: 150.80
Position: - Short at 150.20
Target: - 148.20
Stop: - 150.80
New strategy :
Hold short entered at 150.20, Target: 148.20, Stop: 150.20
Position: - Short at 150.20
Target: - 148.20
Stop:- 150.20
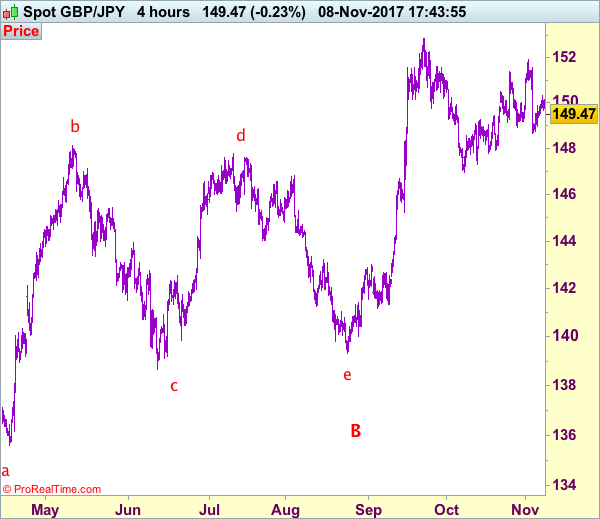
Although sterling rebounded initially this week, as renewed selling interest emerged at 150.30 as suggested (we recommended to sell at 150.20 and a short position was entered) and has the pound has retreated, retaining our bearishness and consolidation with downside bias remains for weakness to 148.95 support, break there would signal the rebound from 148.70 has ended, bring test of this level, below there would extend the fall from 151.90 to previous support at 147.80 but another support at 147.30 should hold from here.
In view of this, we are holding on to our short position entered at 150.20. Only above previous support at 150.60-65 would defer and risk a stronger rebound to 151.10-20, however, still reckon upside would be limited to 151.55-60 and price should falter well below said resistance at 151.90 (last week’s high), bring another retreat later.
Our preferred count is that larger degree wave V with circle is unfolding from 251.12 with wave (I) 219.34, (II): 241.38 and wave (III) is subdivided into 1: 192.60, 2: 215.89 (23 Jul 2008) and wave 3 ended at 118.87 earlier in 2009. The correction from there to 162.60 is wave 4 which itself is a double three and is labeled as first a-b-c ended at 151.53, followed by wave x at 139.03, 2nd a ended at 162.60, 2nd b at 146.75 and 2nd c leg of wave 4 ended at 163.00. Therefore, the decline from 163.00 to 116.85 is now treated as wave 5 which also marked the end of larger degree wave (III), hence wave (IV) major correction has commenced for retracement of the wave (III) from 241.38 and upside target at 183.95-00 (50% Fibonacci retracement of the wave (II) from 241.38) had been met, a drop below 160.00 would suggest wave (IV) has ended at 195.85, bring decline in wave (V) for initial weakness to 130 (already met) and 120.
Technical Outlook: USDJPY – No Clear Near-Term Direction Yet
The pair remains directionless within 113.53/114.45 range as upside attempts off higher base at 113.65 (lows of past three days) repeatedly failed to sustain break above 114.00 barrier and eventually close above 114.33 pivot (Fibo 61.8% of 118.66/107.31 descend).
Prolonged consolidation is seen as likely near-term scenario before broader bulls resume towards targets at 115.00 /50.
Bullish daily studies support the notion, with extended dips required to hold above rising 20SMA (currently at 113.33) to keep bulls in play.
Otherwise, deeper pullback could be anticipated after repeated upside rejections above 114.00, with scenario being supported by reversal of slow stochastic from overbought zone on weekly chart.
Res: 114.02, 114.45, 114.73, 115.00
Sup: 113.65, 113.53, 113.33, 112.95
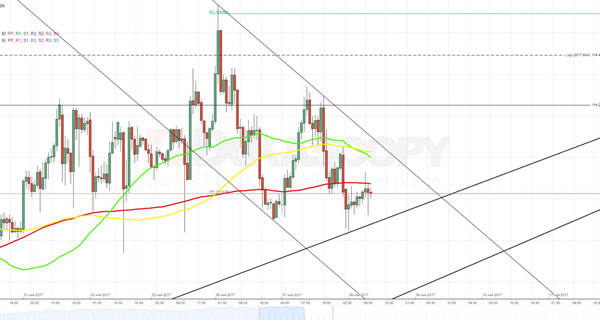
GBP/CHF 1H Chart: Pair Tended South
The Pound has been guided by two ascending channels against the Swiss Franc. The senior formation began a year ago, while the junior one has confined the rate since early October. The rate bounced off its four-month high of 1.3324 last Wednesday and has since returned near the 1.31 mark. As apparent on the chart, the rate has been testing the bottom boundary of the junior channel for the past week. This indicates that the Sterling could be ready to breach the given pattern to the downside. This move would be in line with the senior pattern. It is possible that the nearest downside target is the weekly or monthly S1s at 1.2970 and 1.2914, respectively. Nevertheless, technical indicators suggest that the Pound might still edge slightly higher in this session, possibly up to the 1.3250 mark prior to starting to move south.
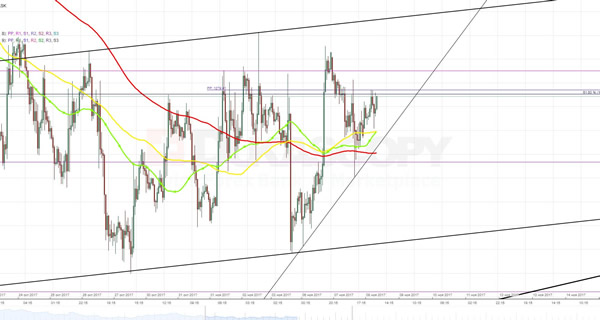
NZD/JPY 1H Chart: Kiwi Retraces From Long-Term Channel
NZD/JPY has been trading in three channels simultaneously. The dominant pattern began already mid-September, while the two junior ones have confined its latest up-wave. It should be noted that the pair has made a retracement from a long-term ascending triangle (drawn with the dashed line). This suggests that the New Zealand Dollar might be pressured southwards during the following week or two. This is likewise confirmed by the rate’s failure to reach the upper boundary of the both junior formations. A possible downside target during the following week might be the five-month low of 77.40. This movement lower might likewise continue even further until the bottom channel boundary circa 76.50 where the monthly S1 and the weekly S2 are located. Conversely, the Kiwi might also test the upper channel boundary near the 79.50 mark; however, the subsequent movement should be southwards.
XAUUSD Fluctuates Between 1,275 And 1,280
As there were no breaking news yesterday, recovery of the buck was expectedly neutralized by combined support level set up by the 55-, 100- and 200-hour SMAs together with the weekly PP at 1,273.35. In the meantime, lowering interest for safe haven assets as well as existence of the monthly PP at 1,279.41 did not allow the pair to make a fully-fledged rebound either. For this reason, the rate is expected to continue moving in this limbo until traders receive a proper signal that will allow making a decisive breakout. Most probably such signal will come from China, where Donald Trump is expected to announce conclusion of different deals that would allow narrowing the gap in the US trade balance. In that case, the buck has a chance to reach the bottom edge of the channel in the next one-two days.
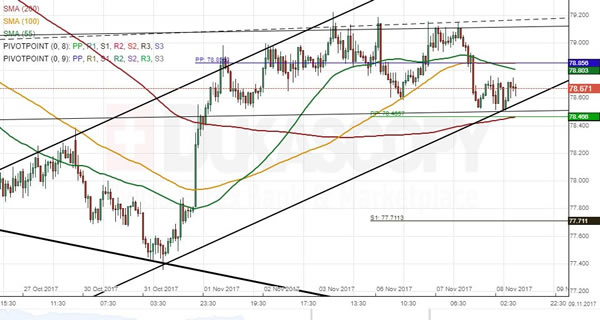
USDJPY Slips In New Channel Down
As it was expected, different news coming from the United States and Asia created a downside momentum that allowed traders with bearish outlook to push the currency pair down to the 113.65 level. The further deprecation of the buck was stopped by a slope consisting from October 16 and October 31 minimums. An existence of this support barrier as well as President Trump’s arrival to China suggests that the currency rate might resume the surge despite the pressure from 200-, 100- and 55-hour SMAs. On the other hand, over the last two days the pair has formed a minor descending channel, which implies that the above moving averages should be strong enough to force the rate to make a rebound from the upper boundary of that pattern.
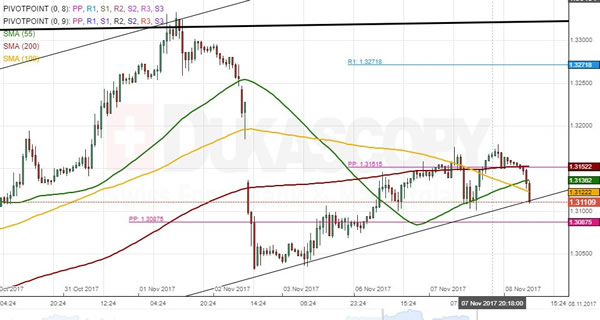
GBPUSD Analysis: Forms Ascending Triangle Pattern
During the previous trading session the currency rate expectedly returned back to the 1.3110 mark, which represents location of the 23.6% Fibonacci retracement level. As this barrier was additionally backed up by the 55-hour SMAs, it made a rebound. However, the fact that the cable failed to climb above the 50% retracement level at 1.3180 two times in a row as well existence of a slope that lies along rising 55-hour SMA indicates on existence of a minor ascending triangle pattern. If this assumption is true, then the pair is likely to make a breakout to the top already by the end of the day due to existence of combined support barrier formed by above 55- and 100-hour SMAs, the 38.2% retracement level and the weekly PP at 1.3150.