Sample Category Title
Trade Idea : EUR/USD – Hold short entered at 1.1620
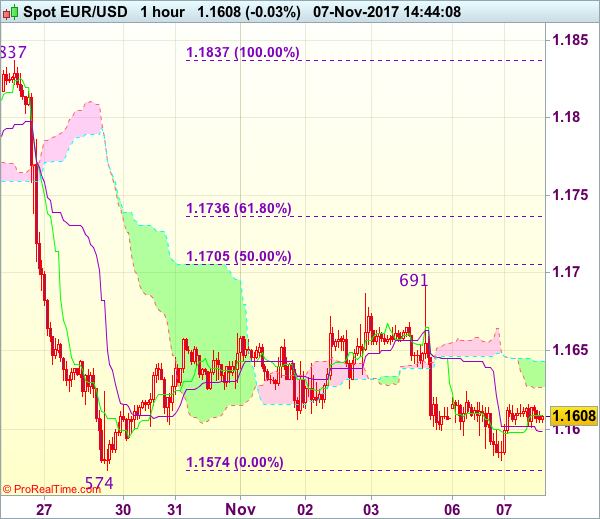
EUR/USD - 1.1599
Most recent candlesticks pattern : N/A
Trend : Down
Tenkan-Sen level : 1.1606
Kijun-Sen level : 1.1599
Ichimoku cloud top : 1.1644
Ichimoku cloud bottom : 1.1627
Original strategy :
Sold at 1.1620, Target: 1.1520, Stop: 1.1655
Position : - Short at 1.1620
Target : - 1.1520
Stop : - 1.1655
New strategy :
Hold short entered at 1.1620, Target: 1.1520, Stop: 1.1645
Position : - Short at 1.1620
Target : - 1.1520
Stop : - 1.1645
As the single currency recovered after finding support at 1.1580, minor consolidation would be seen, however, reckon upside would be limited to the lower Kumo (now at 1.1627) and bring another decline later to 1.1574-80, break there would extend recent decline to 1.1520-25, then 1.1500 but near term oversold condition should prevent sharp fall below latter level.
In view of this, we are holding on to our short position entered at 1.1620. Above the upper Kumo (now at 1.1644) would risk another bounce towards 1.1691, however, only break there would abort and suggest further choppy trading above 1.1574 would be seen, bring a stronger rebound to 1.1700-05 but upside should be limited to previous support at 1.1725 (now resistance).
Trade Idea : USD/JPY – Hold long entered at 113.85
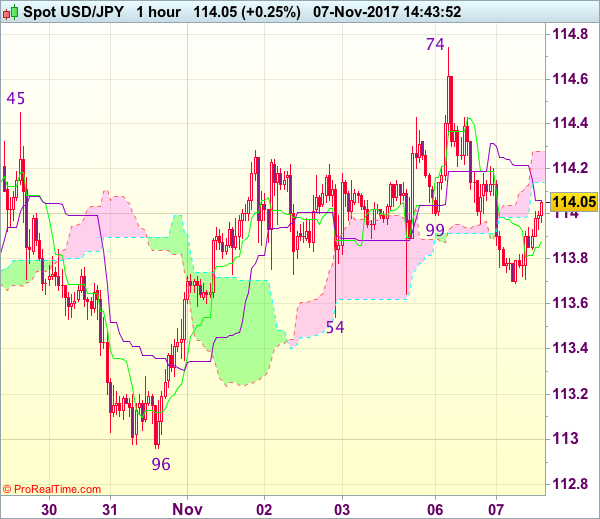
USD/JPY - 114.05
Most recent candlesticks pattern : N/A
Trend : Near term up
Tenkan-Sen level : 113.88
Kijun-Sen level : 114.06
Ichimoku cloud top : 114.28
Ichimoku cloud bottom : 114.14
Original strategy :
Bought at 113.85, Target: 114.85, Stop: 113.50
Position : - Long at 113.85
Target : - 114.85
Stop : - 113.50
New strategy :
Hold long entered at 113.85, Target: 114.85, Stop: 113.65
Position : - Long at 113.85
Target : - 114.85
Stop : - 113.65
Although the greenback retreated after rising to 114.74 yesterday, as dollar found support at 113.69 and has rebounded, retaining our bullishness and consolidation with upside bias remains for gain to 114.40-45, however, break of said resistance at 114.74 is needed to confirm recent upmove from 107.32 low has resumed and extend gain to 115.00 but overbought condition should limit upside to another previous resistance at 115.51.
In view of this, we are holding on to our long position entered at 113.85. Only below support at 113.54 would abort and prolong consolidation, risk weakness to 113.20-25, however, reckon support at 112.96 would remain intact, bring another rise later.
EUR/USD Candlesticks and Ichimoku Analysis
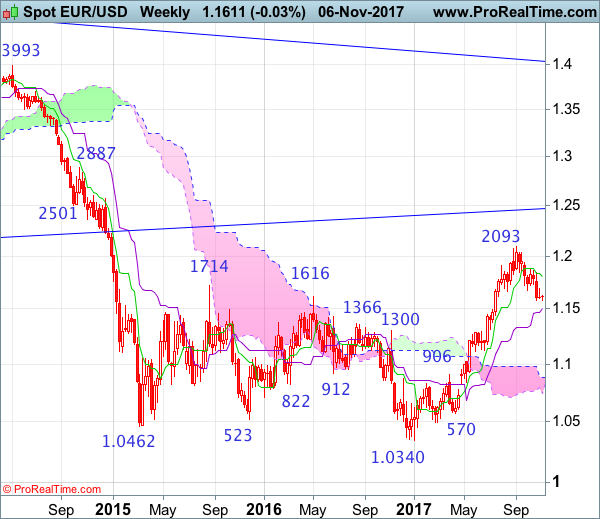
Weekly
• Last Candlesticks pattern: Shooting star
• Time of formation: 31 Jul 2017
• Trend bias: Near term up
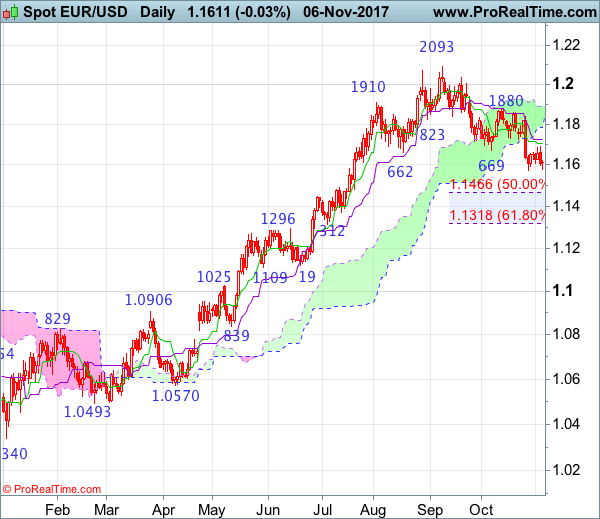
Daily
• Last Candlesticks pattern: Shooting star
• Time of formation: 2 Aug 2017
• Trend bias: Up
EUR/USD – 1.1605
As the single currency has remained under pressure, adding credence to our bearish view that the fall from 1.2093 top is still in progress, hence downside bias remains for the erratic fall from there to bring retracement of early upmove to 1.1550, then 1.1500, however, near term oversold condition should limit downside to 1.1465-66 (50% Fibonacci retracement of 1.0839-1.2093) and reckon 1.1370 support would hold and price should stay above 1.1312-18 (previous support and 61.8% Fibonacci retracement).
On the upside, whilst an initial recovery to 1.1660-70 cannot be ruled out, reckon the Tenkan-Sen (now at 1.1706) would limit upside and price should falter below 1.1725 (previous minor support), bring another decline to aforesaid downside targets. A daily close above the Kijun-Sen (now at 1.1727) would defer and suggest low is possibly formed instead, risk rebound to 1.1790-00, then test of resistance at 1.1837 but break there is needed to add credence to this view, bring another bounce to indicated previous resistance at 1.1880 first.
Recommendation: Sell at 1.1700 for 1.1500 with stop above 1.1800.
On the weekly chart, as euro’s retreat from 1.2093 has kept price under near term pressure, retaining our view that further consolidation below this level would be seen and mild downside bias remains for a retracement of recent rise to 1.1500, then 1.1466 (50% Fibonacci retracement of 1.0839-1.2093), however, reckon downside would be limited to 1.1400 and reckon 1.1312-18 (previous support and 61.8% Fibonacci retracement) would hold, price should stay above previous minor resistance at 1.1296, bring rebound later.
On the upside, expect recovery to be limited to 1.1650-60 and renewed selling interest should emerge around (1.1700-10), bring another decline later. Above 1.1790-00 would risk test of said resistance at 1.1837 but only break of this last week’s high would abort and suggest low is formed instead, bring test of resistance at 1.1880 first. Only a break of 1.1880 would suggest the pullback from 1.2093 top has possibly ended and extend gain to 1.1935-40, then towards 1.2035-40. Having said that, break there is needed to provide confirmation, bring retest of 1.2093.
Aussie Dollar To Consolidate Before Next Move?
Key Highlights
- The Aussie Dollar struggled recently and traded towards 0.7620-0.7600 against the US Dollar.
- There is a key bearish trend line forming with resistance at 0.7695 on the 4-hours chart of AUD/USD.
- Australia’s HIA/AiG Performance of Construction Index in Oct 2017 declined from the last reading of 54.7 to 53.2.
- Today in the US, the IBD/TIPP Economic Optimism Index for Nov 2017 will be released, which is forecasted to increase from 50.3 to 51.2.
AUDUSD Technical Analysis
The Aussie Dollar struggled a lot during the past few weeks and settled below 0.7700 against the US Dollar. The AUD/USD pair is currently recovering, but facing a major hurdle near 0.7695.
The pair recently formed a swing low at 0.7639 and started an upside move. It faces many resistances on the way up such as 0.7690 and 0.7700. There is also a key bearish trend line forming with resistance at 0.7695 on the 4-hours chart.
The trend line resistance is close to the 61.8% Fib retracement level of the last drop from the 0.7730 high to 0.7639 low.
Above 0.7690, the 0.7700 and 0.7715 levels are also important hurdles for buyers. A proper close above 0.7700 would only lift the market sentiment for AUD/USD.
On the other hand, the 0.7630-20 area is an important support, which must hold to contain further losses in the near term.
Australia’s HIA/AiG Performance of Construction Index
Today in Australia, the the HIA/AiG Performance of Construction Index for Oct 2017 was released by the Australian Industry Group and the Housing Industry Association. The market was looking for no major change from the last reading of 54.7.
The actual was a bit lower as there was a decline in the HIA/AiG Performance of Construction Index from 54.7 to 53.2 in Oct 2017. The best performing area was the engineering construction.
The report added:
The activity sub-index in the Australian PCI® registered 52.9 points in October. This was up by 0.3 points from September, signalling a marginal increase in the pace of overall industry growth.
Overall, the AUD/USD pair is likely to continue trading in a range below 0.7700 before the next move.
Economic Releases to Watch Today
Germany’s Industrial Production for Sep 2017 (MoM) – Forecast -0.8%, versus +2.6% previous.
UK Halifax House Price Index for Oct 2017 (MoM) – Forecast 0.2%, versus 0.8% previous.
UK Halifax House Price Index for Oct 2017 (3m/YoY) – Forecast +4.2%, versus +4% previous.
Euro Zone Retail Sales for Sep 2017 (YoY) – Forecast +3.1%, versus +1.2% previous.
Euro Zone Retail Sales for Sep 2017 (MoM) – Forecast +0.6%, versus -0.5% previous.
US IBD/TIPP Economic Optimism Index for Oct 2017 (MoM) – Forecast 54.2, versus 53.4 previous.
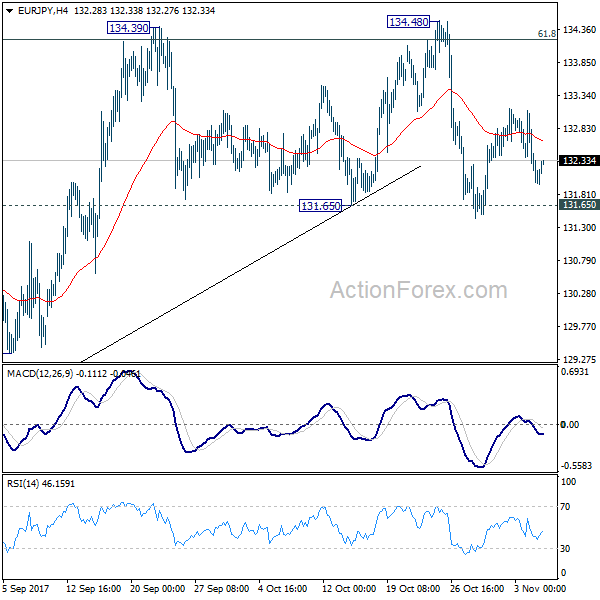
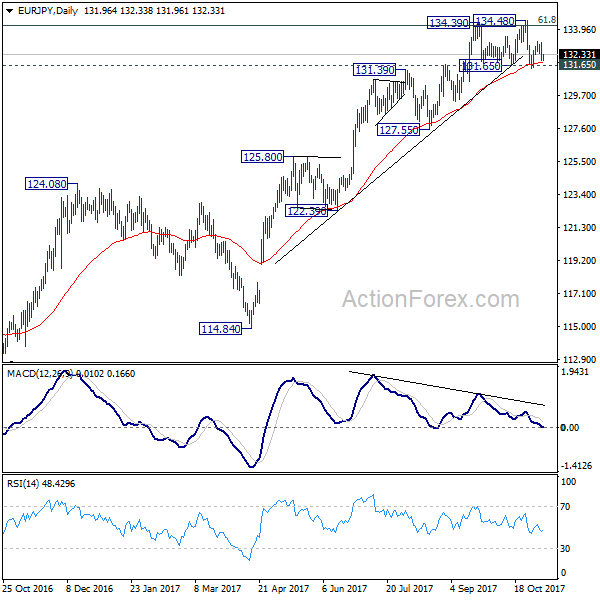
EUR/JPY Daily Outlook
Daily Pivots: (S1) 131.62; (P) 132.37; (R1) 132.74; More....
Intraday bias in EUR/JPY remains neutral for the moment. As noted before, decisive break of 134.39/48 resistance zone is needed to confirm up trend resumption. Otherwise, even in case of rebound, near term outlook is neutral at best. On the downside, decisive break of 131.65 will confirm rejection from 134.20 fibonacci level and confirm near term reversal. And, in such case, intraday bias will be turned to the downside for 127.55 key support level.
In the bigger picture, medium term rise from 109.03 (2016 low) is seen as at the same degree as the down trend from 149.76 (2014 high) to 109.03 (2016 low). 61.8% retracement of 149.76 to 109.03 at 134.20 is already met. Sustained break there will pave the way to key long term resistance zone at 141.04/149.76. However, break of 127.55 support will argue that the medium term trend has reversed and will turn outlook bearish for deeper fall back to 114.84/124.08 support zone at least.
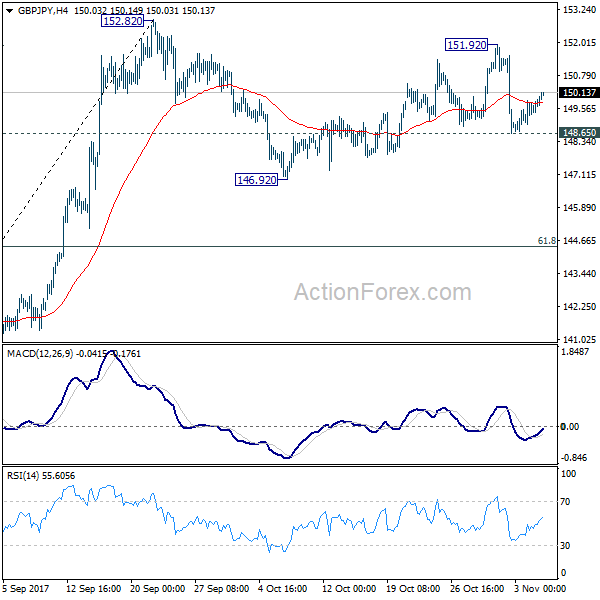
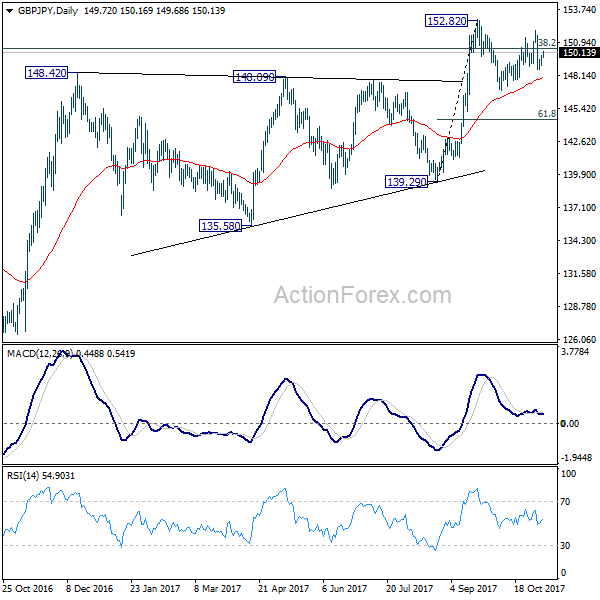
GBP/JPY Daily Outlook
Daily Pivots: (S1) 148.68; (P) 149.10; (R1) 149.52; More
Intraday bias in GBP/JPY is turned neutral with the current recovery. At this point, we're still favoring the case that recovery from 146.92 has completed at 151.92. Another fall is expected and below 148.65 should send GBP/JPY through 146.92. We'd expect strong support from 61.8% retracement of 139.29 to 152.82 at 144.45 to contain downside and bring rebound. On the upside, above 151.92 will retest 152.82 high instead.
In the bigger picture, medium term rebound from 122.36 is still expected to resume after corrective pull back from 152.82 completes. Firm break of 38.2% retracement of 196.85 to 122.36 at 150.43 will carry long term bullish implications. In that case, GBP/JPY could target 61.8% retracement at 167.78. However, break of 139.29 will indicate rejection from 150.43 key fibonacci level. And the three wave corrective structure of rebound from 122.36 will argue that larger down trend is resuming for a new low below 122.26.
Market Update – Asian Session: RBA Leaves Rates, Higher Oil Prices Lend Regional Names Strength
Asia Summary
Asian equity markets are trading generally higher following Monday's gains in the NY trading session. The Nikkei 225 has traded at a 25-year high, as the Topix Securities broker index has risen by over 1%.
Australia's ASX 200 index has traded at the highest level since Feb 2008. BHP and Rio Tinto have gained over 2%, and the overall ASX Resources index is up more than 1.5%.On yesterday's session, copper prices rose by 1%, while oil prices gained over 3%.
With the recent gain in crude oil prices, the ASX and Hang Seng Energy indices have gained over 1% on the session.
The Hong Kong property, conglomerates and consumer goods indices are also currently gaining. South Korean department store operator, Shinsegae, has risen by over 7%, as its Q3 revenues rose by more than 34%.
South Korean chip makers are trading mixed. Shares of Samsung Electronics have gained on the session. Hynix has, however, lagged amid the earlier decline seen in the share price of Micron. Taiwan Semi is trading up by over 0.6%. In Q1, contract prices for DRAM may rise on demand from Apple, according to a Taiwanese press report. In Hong Kong, the Information Technology Index has gained over 0.5%, as shares of Tencent have risen by more than 1%. The company's eBook business, China Literature, has risen by over 30% in the gray market ahead of its IPO in Hong Kong. Softbank has traded marginally lower, following its recent earnings report.
Steelmakers in Japan are trading mixed. Nippon Steel and JFE have gained over 1.5%, while shares of Kobe Steel have lagged. In the auto space, Toyota, has traded lower by over 0.6%, ahead of its later today earnings report. In Hong Kong, Geely Automobile has traded higher by over 3%, as it reported record vehicle sales for the month of October. The ASX 200 REIT index has gained over 0.9%
Australia's 3-year bond yields are higher on the session and the Aussie is little changed amid the Reserve Bank of Australia's decision to keep rates unchanged (as expected). The central bank, however, in its policy statement said core inflation is likely to remain low for some time on slow growth in labor costs and higher competitive pressures, particularly in retailing. The central bank also said one continuing source of uncertainty is the outlook for household consumption. These comments came, as Australia's retail sales have missed market expectations for 3 straight months.
Looking ahead, the RBA is due to release its Quarterly Monetary Statement and economic forecasts on Friday's session.
Japanese companies expected to report earnings later today include, Ajinomoto, Asahi Kasei Corp, Brother Industries, COMSYS Holdings, Daikin Industries, Fuji Oil Holdings, Istean Mitsukoshi Holdings, Kubota, Nikon Corp, NTT Data and Sumitomo Electric.
Key economic data
(AU) RESERVE BANK OF AUSTRALIA (RBA) LEAVES CASH RATE TARGET UNCHANGED AT 1.50%; AS EXPECTED (15TH CONSECUTIVE HOLD IN CURRENT EASING CYCLE)
(JP) Japan Sept Labor Cash Earnings Y/Y: 0.9% v 0.5%e; Real Cash Earnings Y/Y: -0.1% v -0.2%e
(AU) Australia Oct AiG Performance of Construction Index 53.2 v 54.7 prior
Speakers and Press
Japan
(JP) Japan Fin Min Aso: US forces are important for Japan security, will not pursue FTA to reduce US trade deficit
(JP) Japan Dep Chief Cabinet Sec Nishimura: Trump and Abe did not discuss any bilateral Free trade Agreement (FTA)
Korea
(KR) South Korea FX Official: Closely monitoring FX markets, FX policy stance stays the same as Fin Min comments last week
Australia/New Zealand
(NZ) New Zealand PM Arden: Not at all concerned about recent declines in NZ$
(NZ) New Zealand Fin Min Robertson: Expect business confidence to recover
(NZ) New Zealand Fin Min Robertson and acting Gov Spencer have signed an unchanged Policy Targets agreement (PTA)
(NZ) New Zealand Treasury: Q3 GDP may be 0.6%, slower than expected; GDP growth is expected to pick up in Q4 - Monthly Economic Indicators
China/Hong Kong
(CN) China Commerce Ministry (MOFCOM):foreign trade conditions are expected to be generally favorable in 2018 amid a steadily improving global economy
(CN) China Banking Association economist Ba Shusong: China should strengthen efforts to internationalize the yuan - China Financial News
Asian Equity Indices/Futures (23:00ET)
Nikkei +1.3%, Hang Seng +1.2%; Shanghai Composite +0.6%; ASX200 +0.8%, Kospi -0.1%
Equity Futures: S&P500 +0.1%; Nasdaq100 +0.2%, Dax +0.1%; FTSE100 +0.2%
FX ranges/Commodities/Fixed Income (23:00ET)
EUR 1.616-1.1602; JPY 113.94-113.70; AUD 0.7701-0.7679;NZD 0.6954-0.6933
Dec Gold -0.1% at $1,280/oz; Dec Crude Oil +0.1% at $57.41/brl; Dec Copper -0.2% at $3.15/lb
(CN) PBoC OMO: injects CNY180B in 7-day, 14-day and 63-day reverse repos prior v skips prior; Net drain CNY80B v injection CNY160B prior (1st injection after 3 consecutive skips)
USD/CNY *(CN) PBOC SETS YUAN REFERENCE RATE AT 6.6216 V 6.6247 PRIOR
(TH) Thailand Central Bank sells THB115B in 3-month, 6-month and 301-day central bank bonds
Equities notable movers
Australia/New Zealand
TWR.NZ Suncorp will not appeal NZCC's decision to decline its application to acquire Tower; -6.8%
Japan
6005.JP Reports H1 Net ¥4.8B +25% y/y; Op ¥6.70B +15.8% y/y; +9.5%
6849.JP Reports H1 Net -¥546M v ¥1.7B y/y; Op ¥3.1B v ¥3.8B y/y; -6%
Korea
000720.KR Receives KRW582.06B contract in Busan; +8%
Hong Kong
1169.HK Controlling shareholder unit planning exchangeable bond sale; -4.4%
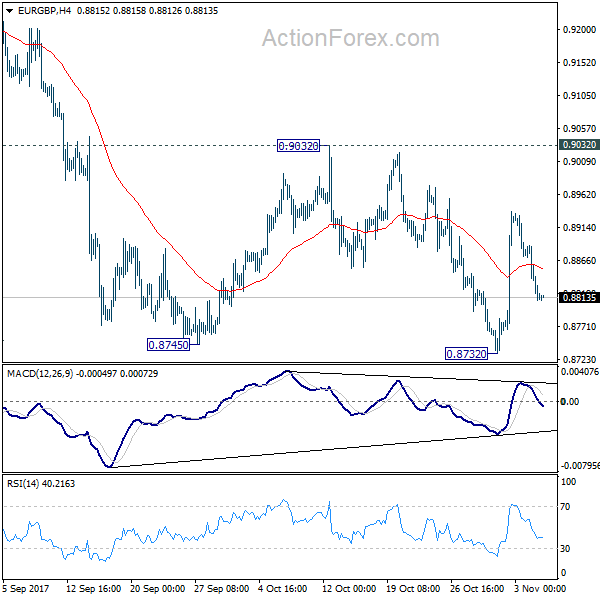
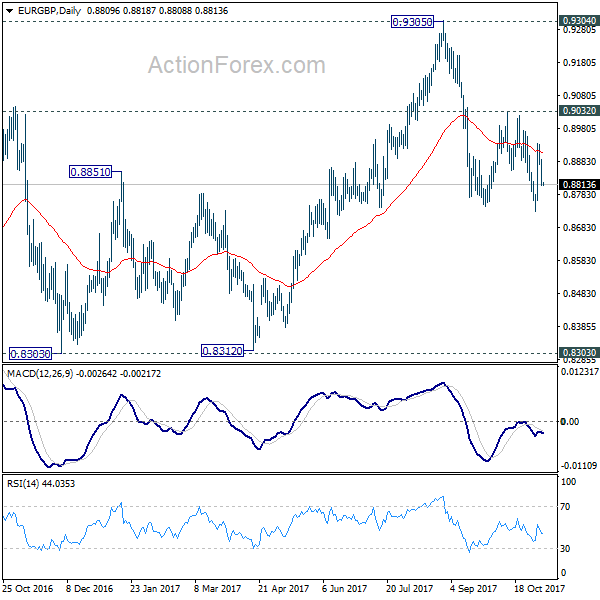
EUR/GBP Daily Outlook
Daily Pivots: (S1) 0.8785; (P) 0.8837; (R1) 0.8863; More...
At this point, intraday bias in EUR/GBP remains neutral at the moment. On the upside, decisive break of 0.9032 will confirm completion of the decline from 0.9305. In such case, intraday bias will be turned back to the upside for retesting 0.9305 key resistance. On the on the downside, break of 0.8732 will resume the fall and target 0.8303 key support level instead.
In the bigger picture, there are various ways to interpret price actions from 0.9304 high. But after all, firm break of 0.9304/5 is needed to confirm up trend resumption. Otherwise, range trading will continue with risk of deeper fall. And in that case, EUR/GBP could have a retest on 0.8303. But we'd expect strong support from 0.8116 cluster support (50% retracement of 0.6935 to 0.9304 at 0.8120) to contain downside.
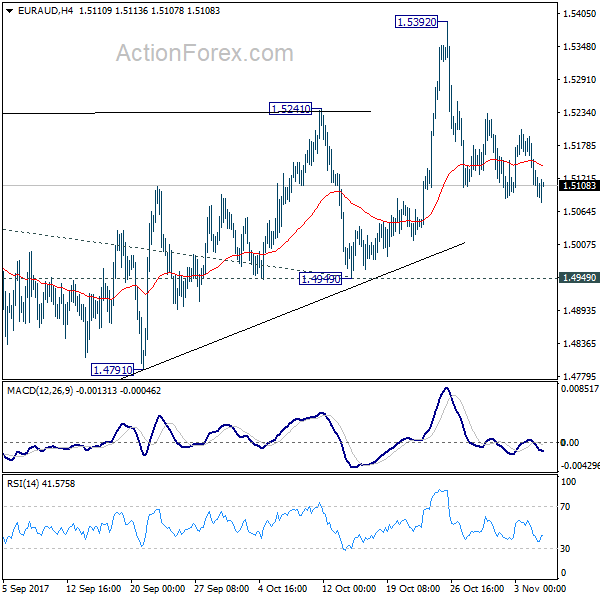
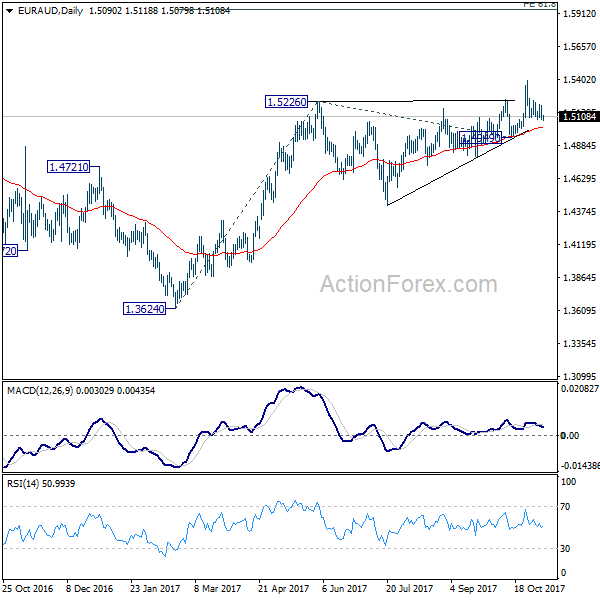
EUR/AUD Daily Outlook
Daily Pivots: (S1) 1.5058; (P) 1.5126; (R1) 1.516; More....
Intraday bias in EUR/AUD remains neutral as consolidation from 1.5392 continues. As long as 1.4949 support holds, outlook remains bullish. Medium term rally from 1.3624 is in favor to continue. On the upside, break of 1.5392 will resume medium term rise from 1.3624 and target 61.8% projection of 1.3624 to 1.5226 from 1.4949 at 1.5939 first. However, decisive break of 1.4949 will carry larger bearish implication and turn bias to the downside.
In the bigger picture, we're holding on to the view that corrective decline from 1.6587 medium term top has completed at 1.3624. Rise from 1.3624 is expected to extend to retest 1.6587. However, break of 1.4949 support will dampen our view and argue that rise from 1.3624 has completed. In that case, EUR/AUD would turn southward for retesting 1.3624 low.
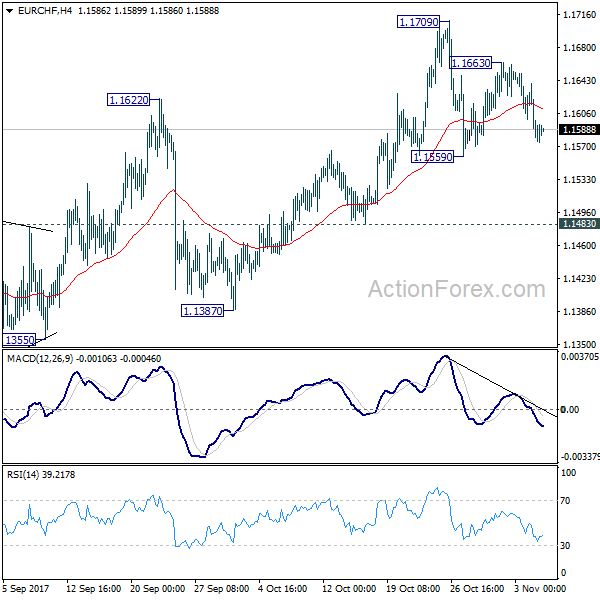
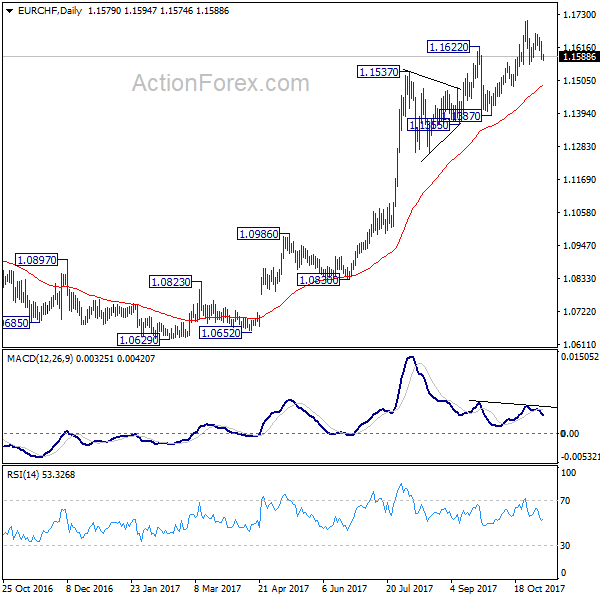
EUR/CHF Daily Outlook
Daily Pivots: (S1) 1.1557; (P) 1.1598; (R1) 1.1621; More...
Intraday bias in EUR/CHF remains neutral at this point. Consolidation from 1.1709 is still in progress and break of 1.1559 minor support will bring deeper fall. But overall outlook will stays bullish as long as 1.1483 support holds. Above 1.1663 will turn bias back to the upside for 1.1709 high. Break will resume medium term rally to 1.2 key level. However, break of 1.1483 will be an early sign of reversal. In that case, deeper decline should be seen back to 1.1355 support.
In the bigger picture, long term rise from SNB spike low back in 2015 is still in progress. EUR/CHF should now be heading back to prior SNB imposed floor at 1.2000. For now, this will be the favored case as long as 1.1355 support holds. However, break of 1.1355 will indicate medium term topping. In that case, EUR/CHF should head back to 55 week EMA (now at 1.1104) and possibly below.