Sample Category Title
Copper – Break Out of Triangle to Signal N/T Direction; Techs Remain Bullishly Aligned
Copper price rose above $3.17 on Monday, fully reversing losses on Friday, but upside remains limited, following repeated upside rejections above $3.17 handle.
Future contract for December delivery is holding within triangular consolidation, as converging trend lines limit near-term price fluctuation.
Daily studies are bullishly aligned and favor eventual firm break above $3.1707 (triangle's upper boundary) to signal resumption of recovery from $3.0725 (27 Oct correction low) towards targets at $3.1871 (Fibo 61.8% of $3.2580/$3.0725 pullback) and psychological $3.20 barrier.
The price may stay in prolonged consolidation while holding within the triangle.
Strong bearish signal could be expected on break and close below lower trendline (currently at $3.1091).
Res: 3.2000; 3.2120; 3.2355; 3.2415
Sup: 3.1450; 3.1232; 3.1091; 1.3100
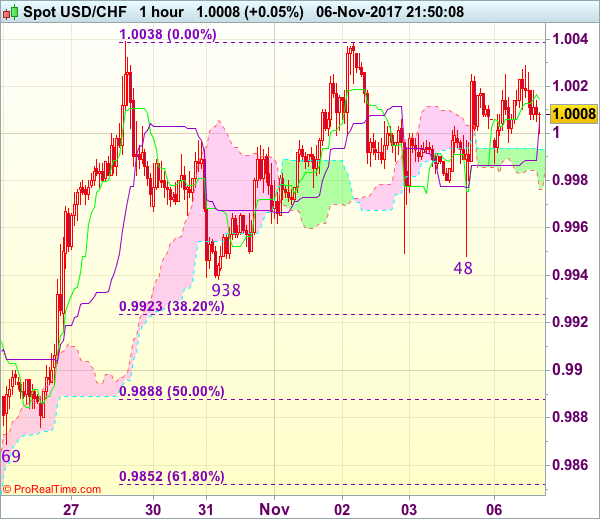
Trade Idea Wrap-up: USD/CHF – Hold long entered at 0.9950
USD/CHF - 1.0003
Most recent candlesticks pattern : N/A
Trend : Up
Tenkan-Sen level : 1.0015
Kijun-Sen level : 1.0008
Ichimoku cloud top : 0.9993
Ichimoku cloud bottom : 0.9976
Original strategy :
Bought at 0.9950, Target: 1.0050, Stop: 0.9950
Position : - Long at 0.9950
Target : - 1.0050
Stop : - 0.9950
New strategy :
Hold long entered at 0.9950, Target: 1.0050, Stop: 0.9950
Position : - Long at 0.9950
Target : - 1.0050
Stop : - 0.9950
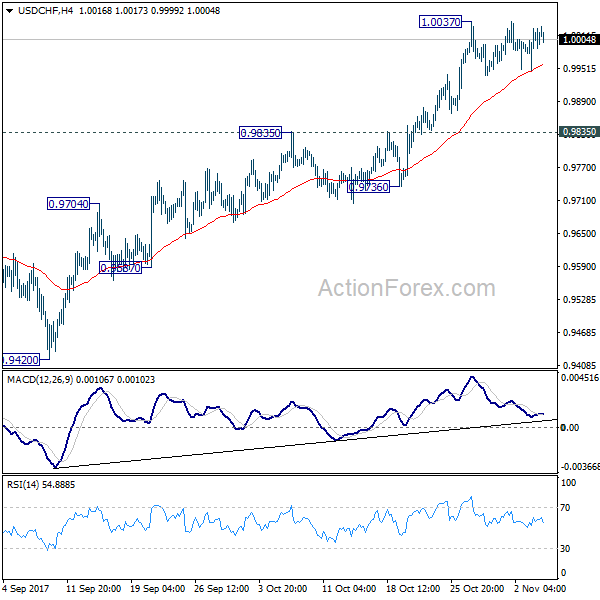
As the greenback found renewed buying interest at 0.9948 and has staged another rebound, retaining our bullish view for recent rise to resume after consolidation, above said resistance at 1.0038 would confirm the rise from 0.9421 low has resumed and extend further gain to 1.0050-55, then towards 1.0075-80 but price should falter below 1.0100 chart resistance.
In view of this, we are holding on to our long position entered at 0.9950. Below said support at 0.9938-48 would abort and signal top is formed instead, risk correction to 0.9920-23 (38.2% Fibonacci retracement of 0.9737-1.0038) but 0.9885-90 (50% Fibonacci retracement) should limit downside and support at 0.9869 would remain intact.
Silver Slips Below 17 Key-Level; Neutral Inside Ichimoku Cloud
Silver dipped below 17.00 on Friday after a short phase of consolidation and is currently trying to pare its losses on the 4-hour chart. The bias is neutral as the RSI and the MACD are laying in their neutral zones, while the metal itself has rebounded inside the Ichimoku cloud.
Should the metal head up, resistance could be first met at the 17.00 key-level before the previous high at 17.22 come into view. Next, the top at 17.44 touched on October 16 could act as a potential resistance.
Alternatively, a negative foot would first target the previous low of 16.75 and then the area around 16.58 which has been approached recently. From here, any downside movements would see the two-month low of 16.30.
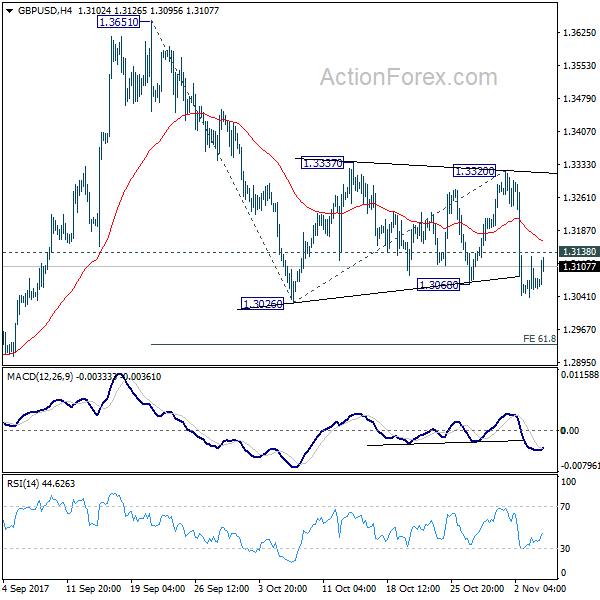
Trade Idea Wrap-up: GBP/USD – Sell at 1.3175
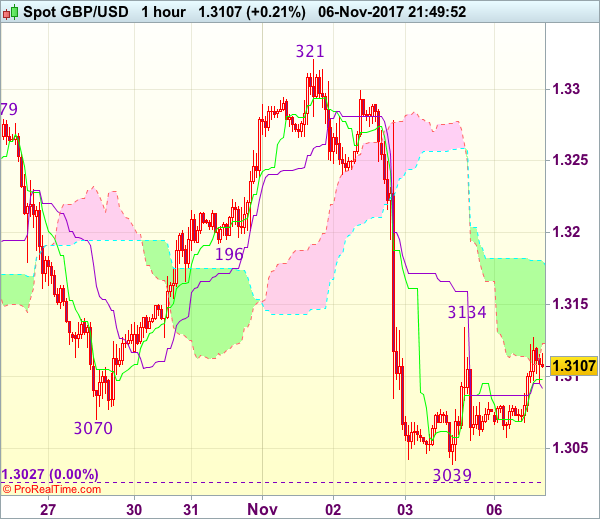
GBP/USD - 1.3101
Most recent candlesticks pattern : N/A
Trend : Near term down
Tenkan-Sen level : 1.3098
Kijun-Sen level : 1.3092
Ichimoku cloud top : 1.3177
Ichimoku cloud bottom : 1.3123
Original strategy :
Sell at 1.3150, Target: 1.3030, Stop: 1.3185
Position : -
Target : -
Stop : -
New strategy :
Sell at 1.3175, Target: 1.3045, Stop: 1.3210
Position : -
Target : -
Stop : -
As cable has rebounded again today, retaining our view that further consolidation above Friday’s low at 1.3039 would be seen and corrective bounce to 1.3150 cannot be ruled out, however, reckon upside would be limited to the upper Kumo (now at 1.3177) and bring another decline, below said support at 1.3039 would bring retest of recent low at 1.3027 but break there is needed to signal early downtrend has resumed for weakness to psychological support at 1.3000, then towards 1.2970-75.
In view of this, would not chase this fall here and would be prudent to sell cable on recovery as 1.3170-75 should limit upside and bring another decline later. Above 1.3200 would defer and prolong choppy trading, risk rebound to 1.3235-40 first.
Trade Idea Wrap-up: EUR/USD – Hold short entered at 1.1620
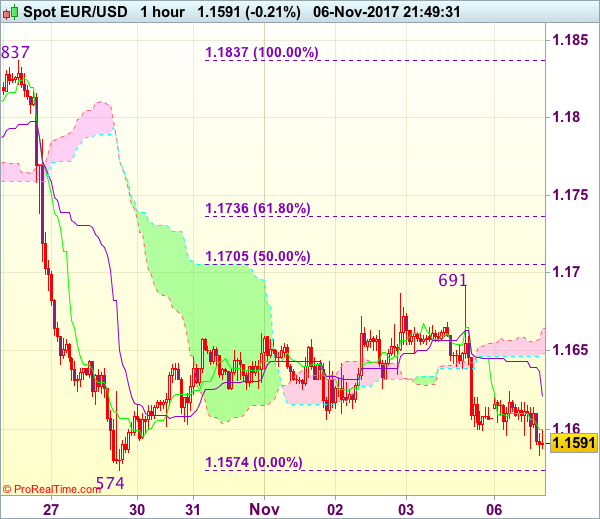
EUR/USD - 1.1590
Most recent candlesticks pattern : N/A
Trend : Down
Tenkan-Sen level : 1.1600
Kijun-Sen level : 1.1621
Ichimoku cloud top : 1.1664
Ichimoku cloud bottom : 1.1649
Original strategy :
Sold at 1.1620, Target: 1.1520, Stop: 1.1655
Position : - Short at 1.1620
Target : - 1.1520
Stop : - 1.1655
New strategy :
Hold short entered at 1.1620, Target: 1.1520, Stop: 1.1655
Position : - Short at 1.1620
Target : - 1.1520
Stop : - 1.1655
The single currency dropped after meeting renewed selling interest at 1.1691, adding credence to our view that top has been formed there and consolidation with downside bias remains for weakness to previous support at 1.1574, however, break there is needed to confirm recent decline has resumed and extend fall to 1.1520-25, then 1.1500 but near term oversold condition should prevent sharp fall below latter level.
In view of this, we are holding on to our short position entered at 1.1620. Above 1.1650-55 would risk another bounce to 1.1691, however, only break there would abort and suggest further choppy trading above 1.1574 and bring a stronger rebound to 1.1700-05 but upside should be limited to previous support at 1.1725 (now resistance).
Trade Idea Wrap-up: USD/JPY – Buy at 113.85
USD/JPY - 114.11
Most recent candlesticks pattern : N/A
Trend : Near term up
Tenkan-Sen level : 114.19
Kijun-Sen level : 114.19
Ichimoku cloud top : 113.97
Ichimoku cloud bottom : 113.91
Original strategy :
Buy at 113.85, Target: 114.85, Stop: 113.50
Position : -
Target : -
Stop : -
New strategy :
Buy at 113.85, Target: 114.85, Stop: 113.50
Position : -
Target : -
Stop : -
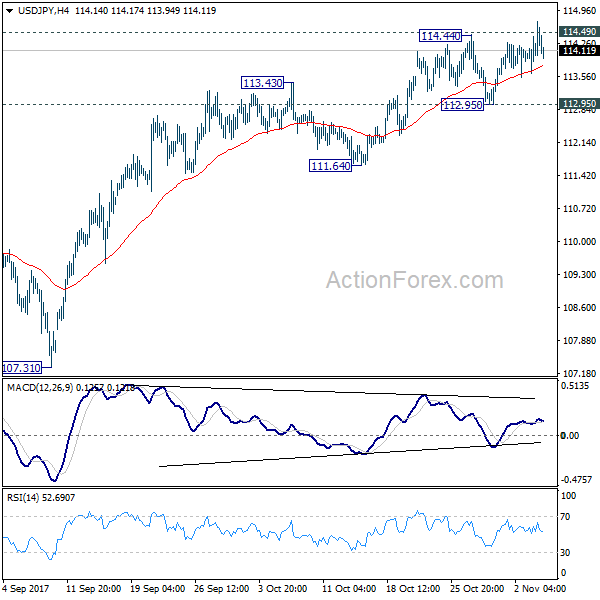
Although the greenback broke above indicated previous resistance at 114.45-50, lack of follow through buying and current retreat fro 114.74 suggest consolidation below this level would be seen and marginal weakness from here cannot be ruled out, however, reckon 113.75-80 would limit downside and bring another rise later, above said resistance at 114.74 would extend recent upmove from 107.32 to 115.00 but overbought condition should limit upside to another previous resistance at 115.51.
In view of this, we are looking to buy dollar on pullback as 113.80 should limit downside and bring another rise later. Below support at 113.54 would abort and prolong consolidation, risk weakness to 113.20-25, however, reckon support at 112.96 would remain intact, bring another rise later.
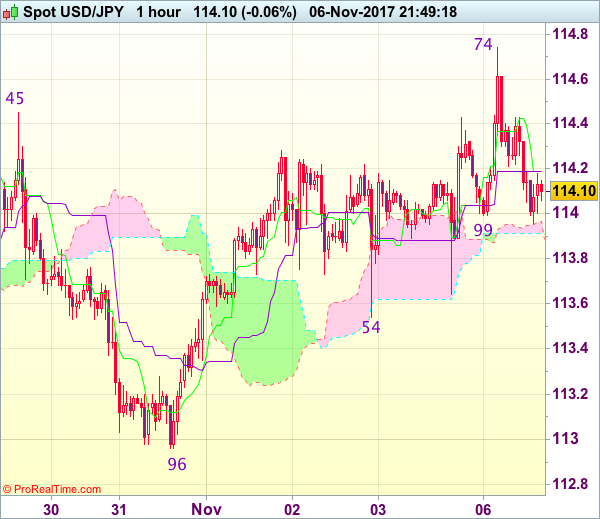
USD/JPY Mid-Day Outlook
Daily Pivots: (S1) 113.60; (P) 114.01; (R1) 114.44; More...
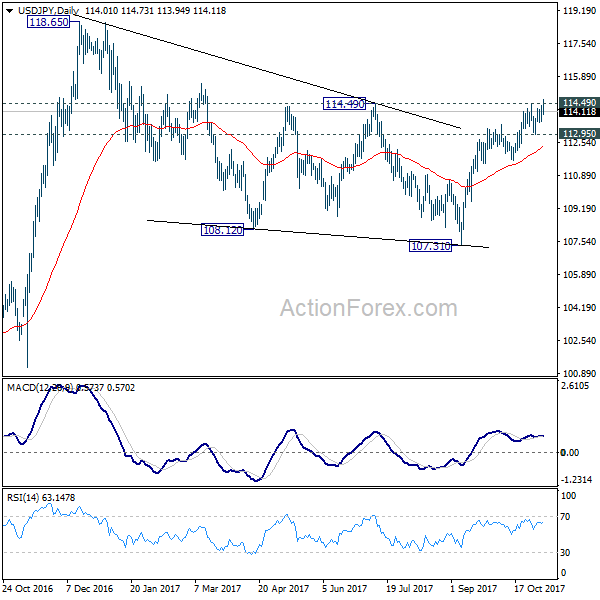
Intraday bias in USD/JPY remains cautious on the upside at this point. Rally from 107.31 is possibly resuming. Sustained trading above 114.49 will pave the way to retest 118.65 high. However, break of 112.95 support will now indicate rejection from 114.49 and turn bias to the downside for 111.64 support and below.
In the bigger picture, medium term rise from 98.97 (2016 low) is not completed yet. It should resume after corrective fall from 118.65 completes. Break of 114.49 resistance will likely resume the rise to 61.8% projection of 98.97 to 118.65 from 107.31 at 119.47 first. Firm break there will pave the way to 100% projection at 126.99. This will be the key level to decide whether long term up trend is resuming.
USD/CHF Mid-Day Outlook
Daily Pivots: (S1) 0.9953; (P) 0.9988; (R1) 1.0039; More....
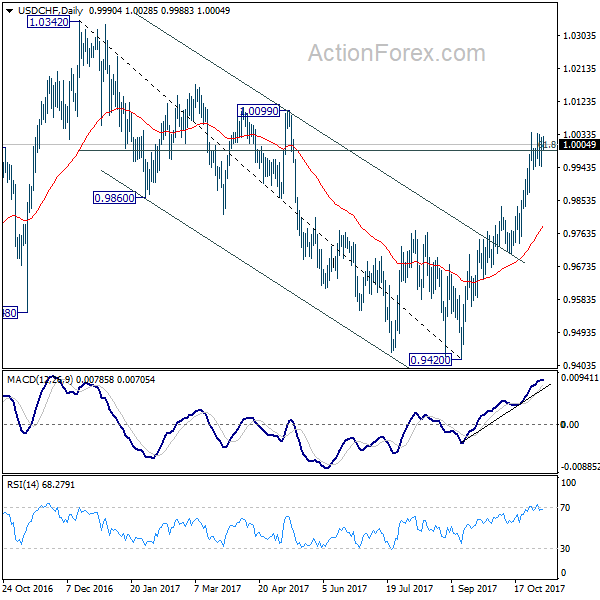
USD/CHF is staying in consolidation from 1.0037 and intraday bias remains neutral at this point. In case of another fall, downside should be contained above 0.9835 resistance turned support and bring rally resumption. On the upside break of 1.0037 will resume whole rally from 0.9420. And with sustained trading above 61.8% retracement of 1.0342 to 0.9420 at 0.9990, USD/CHF should then target a test on 1.0342 key resistance.
In the bigger picture, current development suggests that USD/CHF has defended 0.9443 (2016 low) key support level again. Rise from 0.9420 could is a medium term up move and should target a test on 1.0342 high. This represents the upper end of a long term range that started back in 2015. On the downside, break of 0.9736 support is now needed to indicate completion of the rise from 0.9420. Otherwise, further rally will remain in favor in medium term.
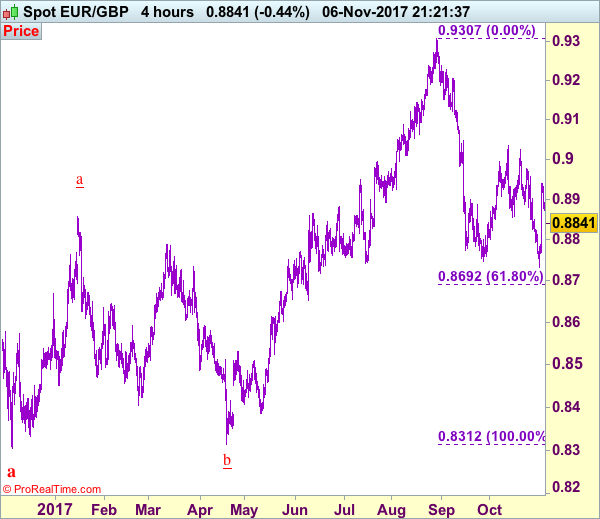
Trade Idea: EUR/GBP – Sell at 0.8865
EUR/GBP - 0.8841
New strategy :
Sell at 0.8865, Target: 0.8735, Stop: 0.8905
Position : -
Target : -
Stop : -
As the single currency has retreated after rising to 0.8939 late last week, suggesting consolidation below this level would be seen and weakness to 0.8800 is likely, however, break of support at 0.8765-70 is needed to signal the rebound from 0.8733 (last week’s low) has ended, bring retest of this level, break there would extend the fall from 0.9033 to 0.8700 but near term oversold condition should limit downside and reckon 0.8665-70 would remain intact.
In view of this, we are looking to sell euro on recovery as 0.8870-75 should limit upside. Only above 0.8910-15 would abort and signal the retreat from 0.8939 has ended, bring retest of this level first, break there would extend the rise from 0.8733 to resistance at 0.8957, however, break of 0.8976 resistance is needed to signal the fall from 0.9033 has ended instead, bring further gain to 0.9000, then retest of 0.9033 later.
Our preferred count is that, after forming a major top at 0.9805 (wave V), (A)-(B)-(C) correction is unfolding with (A) leg ended at 0.8400 (A: 0.8637, B: 0.9491 and 5-waver C ended at 0.8400. Wave (B) has ended at 0.9413 and impulsive wave (C) has either ended at 0.8067 or may extend one more fall to 0.8000 before prospect of another rally. Current breach of indicated resistance at 0.9043 confirms our view that the (C) leg has ended and bring stronger rebound towards 0.9150/54, then towards 0.9240/50.
GBP/USD Mid-Day Outlook
Daily Pivots: (S1) 1.3032; (P) 1.3079; (R1) 1.3118; More....
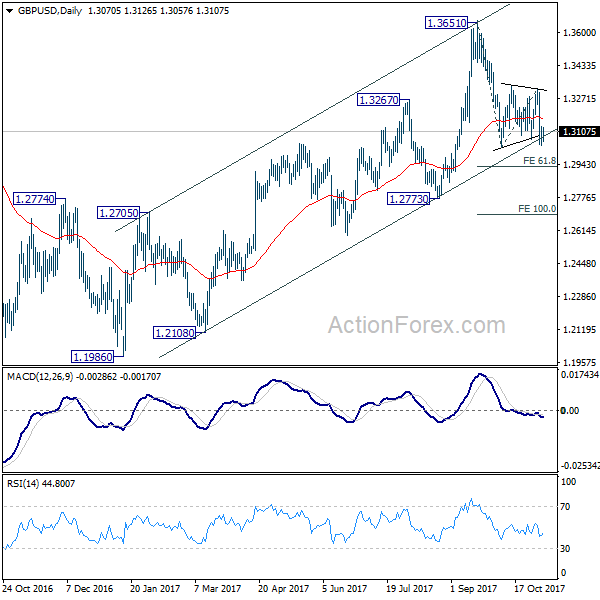
No change in GBP/USD's outlook. With 1.3138 minor resistance intact, intraday bias remains mildly on the downside. Break of 1.3026 support will confirm resumption of decline from 1.3651. Next target will be 61.8% projection of 1.3651 to 1.3026 from 1.3320 at 1.2934 first. Break will bring deeper decline to 1.2773 key support level. On the upside, above 1.3138 minor resistance will extend the consolidation from 1.3026 with another rise.
In the bigger picture, as noted before, GBP/USD hit strong resistance from the long term falling trend line. Current development is starting to favor that corrective rebound from 1.1946 low has completed at 1.3651. Decisive break of 1.2773 will confirm this bearish case and target a test on 1.1946 low next, with prospect of resuming the low term down trend. Nonetheless, break of 1.3320 resistance will restore the rise from 1.1946 for 38.2% retracement of 2.1161 (2007 high) to 1.1946 (2016 low) at 1.5466.