Sample Category Title
Trade Idea: EUR/GBP – Sell at 0.8900
EUR/GBP - 0.8815
Original strategy :
Sell at 0.8920, Target: 0.8820, Stop: 0.8960
Position : -
Target : -
Stop : -
New strategy :
Sell at 0.8900, Target: 0.8755, Stop: 0.8940
Position : -
Target : -
Stop : -
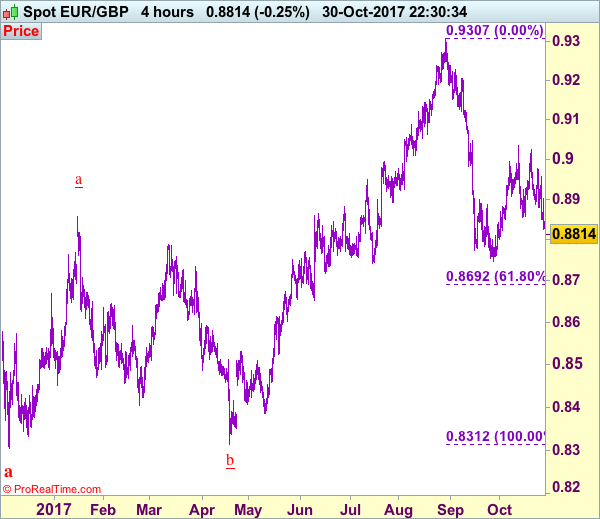
As the single currency has fallen again after brief recovery, adding credence to our bearish view that top has been formed at 0.9033 earlier and downside bias remains for the erratic decline from there to extend further fall to 0.8746-50, then towards 0.8720, however, near term oversold condition should limit downside and reckon 0.8700 would hold from here.
In view of this, we are looking to sell euro again on recovery, above 0.8845-50 would bring corrective bounce to 0.8880 but renewed selling interest should emerge around 0.8900-10 and bring another decline later. Only above 0.8957 resistance would abort and shift risk to upside for test of 0.8976 but reckon upside would be limited to 0.9000 and said resistance at 0.933 should remain intact, bring another decline later.
Our preferred count is that, after forming a major top at 0.9805 (wave V), (A)-(B)-(C) correction is unfolding with (A) leg ended at 0.8400 (A: 0.8637, B: 0.9491 and 5-waver C ended at 0.8400. Wave (B) has ended at 0.9413 and impulsive wave (C) has either ended at 0.8067 or may extend one more fall to 0.8000 before prospect of another rally. Current breach of indicated resistance at 0.9043 confirms our view that the (C) leg has ended and bring stronger rebound towards 0.9150/54, then towards 0.9240/50.
US: Consumers End Q3 With a Blast!
After a very weak performance in August, Personal Consumption Expenditures surged in September, up 1.0 percent in nominal terms. Income increased 0.4 percent over the month.
Strength Across the Board
Consumers were not shy in September as they pushed every category of Personal Consumption Expenditures (PCE) much higher. PCE increased 1.0 percent during the last month of the quarter, after increasing only 0.1 percent in August and 0.4 percent in July. Every sector of consumption was booming in September. Goods consumption surged $89.4 billion during the month, with durable goods up $46.5 billion and non-durable goods consumption up $42.9 billion. Furthermore, services consumption was also very strong, up $46.6 billion. We have not found a stronger month for all three components of nominal PCE going back to 1980.
Inflation also took a bit out of the strong increase in nominal PCE. The PCE deflator was up 0.4 percent in September, which meant that real PCE increased only 0.6 percent. However, this print was stronger than markets were expecting, and strong enough to bring real PCE up by 2.4 percent annualized during the third quarter of the year. Inflation affected all sectors of consumption. However, the non-durable sector took the full brunt of higher prices as real PCE for non-durable increased only $8.4 billion compared to the $42.9 billion increase in nominal non-durable PCE.
Personal Income Continues to Disappoint
However, personal income continued to disappoint in September. Personal income increased 0.4 percent in nominal terms after increasing 0.2 percent in August and 0.3 percent in July. Meanwhile, disposable personal income increased 0.4 percent in nominal terms after increasing 0.1 percent in August and 0.2 percent in July. However, real disposable personal income was flat in September after declining 0.1 percent in August and increasing 0.1 percent in July. Wages and salaries recovered somewhat from a weak August when they increased only $5.1 billion. In September, wages and salaries increased a more 'normal' $37.6 billion.
Americans Continued to Dip Into Savings
This meant that Americans, in lieu of higher incomes to support stronger consumption, have continued to dip into savings. Savings declined a whopping $79.5 billion during the last month of the quarter to take the savings rate from 3.6 percent during the first two months of the quarter to only 3.1 percent in September.
This improvement in consumption is a reflection of the strong consumer confidence numbers since the presidential election in November of last year. However, this behavior is not sustainable in the medium to long term. In order for consumption to continue to improve and remain the driving force of the U.S. economy, Americans will need to get higher incomes through, perhaps, higher wages and salaries, or a combination of higher borrowing and higher wages and salaries.
Trade Idea: USD/CAD – Buy at 1.2755
USD/CAD - 1.2892
Trend: Near term up
Original strategy :
Buy at 1.2785, Target: 1.2985, Stop: 1.2725
Position: -
Target: -
Stop: -
New strategy :
Buy at 1.2755, Target: 1.2955, Stop: 1.2695
Position: -
Target: -
Stop:-
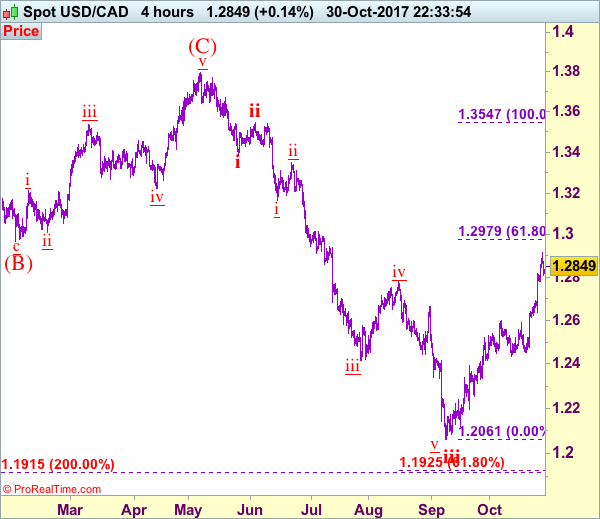
As the greenback has retreated after rising to 1.2917 late last week, suggesting consolidation below this level would be seen and pullback 1.2800 is likely, however, reckon downside would be limited to 1.2750-55 and bring another rise later, above said resistance at 1.2917 would extend the rise from 1.2061 (wave iii trough) to 1.2950, having said that, as we are still treating this rebound from 1.2061 as wave iv, reckon 1.2975-80 (61.8% Fibonacci retracement of wave iii) would limit upside and 1.3000 should hold, bring selloff later in wave v. We are keeping our count that wave v as well as wave (C) ended at 1.3794 and impulsive wave (i ii, i ii) is now unfolding with minor wave iii ended at 1.2414, followed by wave iv correction ended at 1.2778, wave v has reached our indicated downside target at 1.2100 and may extend to 1.2000.
In view of this, we are looking to reinstate long on subsequent pullback as 1.2750-55 should limit downside and bring another rise. Below 1.2725-30 would defer and suggest a temporary top is possibly formed, bring correction to 1.2690-00 but break of support at 1.2635-40 is needed to confirm, bring weakness to 1.2610-15, then test of 1.2591.
To recap, wave B from 1.3066 is unfolding as an a-b-c and is sub-divided as a: 1.2192, b: 1.2716 and wave c is a 5-waver with i: 1.1983, ii: 1.2506, extended wave iii with minor iii at 1.0206, wave iv ended at 1.0781 and wave v as well as wave iii has ended at 0.9931, hence the subsequent choppy trading is the wave iv which is unfolding as (a)-(b)-(c) with (a) leg of iv ended at 1.0854, followed by (b) leg at 1.0108 and (c) leg as well as the wave iv ended at 1.0674. The wave v is sub-divided by minor wave (i): 0.9980, (ii): 1.0374, (iii): 0.9446, (iv): 0.9913 and (v) as well as v has possibly ended at 0.9407, therefore, consolidation with upside bias is seen for major correction, indicated target at 1.3700 and 1.4000 had been met and further gain to 1.4700 would be seen later.
Markets Poised For Busy Week
Central Banks Feature Heavily as Trump Readies Fed Chair Announcement
It's been a relatively calm start to trading on Monday but that isn't likely to last long with the rest of the week packed full of major economic and political events that should ensure markets remain quite volatile.
With the Federal Reserve, Bank of Japan and Bank of England all holding monetary policy meetings this week, there'll undoubtedly be a strong focus on central banks. When it comes to the Fed though, it may not be the interest rate decision itself that attracts the most attention, rather President Donald Trump's announcement on who will succeed Janet Yellen as Chair from February, with the incumbent still in the race.
With Stanley Fischer, the vice Chair, having left the Fed recently, there's actually two posts that need filling so it's possible that two of the three frontrunners - Jerome Powell, John Taylor and Yellen - take up prominent roles at the central bank. The Fed is not expected to make any changes to monetary policy at this week's meeting with a rate hike currently priced in for December - 98% according to Fed Funds futures versus 1% this week.
Will BoE Follow Through on Interest Rate Warnings?
The BoE on the other hand is expected to raise interest rates this week, the first such move in a decade, with policy makers claiming to be concerned about above-target inflation in an environment that has so-far weathered the Brexit storm better than expected. Interestingly, despite markets strongly pricing in a rate hike - 85% as of this morning - policy makers have given the impression that they are not so convinced in recent public appearances. Should they vote in favour of a hike on Thursday, I will be very surprised if the decision is unanimous.
Major US Economic Indicators Due This Week
It's not just about central banks this week though with a whole host of economic data being released, including arguably the most important of the lot, the US jobs report. Markets may be pricing in a rate hike from the Fed in December but weak data between now and then will raise doubts about whether they will follow through. Wages are a key concern for policy makers when it comes to the shortfall in inflation, whereas job growth has been strong for some time, making the conundrum of why wage growth hasn't followed an increasing frustration.
We'll get inflation data for the US today in the form of the core personal consumption expenditure price index - the Fed's preferred measure - which is expected to show price growth remaining relatively subdued at 1.3% year over year. This will be accompanied by income and spending figures, the latter of which is expected to be particularly strong for September, with the former bouncing back to 0.4%.
Finally this week there's a number of companies that will report third quarter earnings, including 139 S&P 500 companies.
2.40% Hangs on Dual Fed Decisions
Fresh reports that Jerome Powell is the front-runner to lead the Fed (whose odds are currently at 80%) put a bid back into bonds and weighed on the US dollar Friday. At the moment, GBP is the strongest performing currency ahead of Thursday's much anticipated BoE rate hike. US core PCE came in at 1.3% as expected, while German CPI weakened to 1.5% from 1.8% but EUR regained lost ground after Trump's former campaign manger Manafort has been charged in probe. CFTC positioning data highlights a potential squeeze. One EURUSD Premium trade was closed at gain on Friday, while a new one was opened, currently at a loss. There is only one open equity index short among the Premium trades, whose stop survived the global rallies of the past 6 weeks.
Bloomberg, citing three sources, reported on Friday that Powell is the favourite to be named Fed Chair this week. Earlier in the week, reports that Taylor had won a straw poll among Republican Senators had boosted the US dollar and pushed 10-year yields above the critical 2.40%. The news that Powell could win sent yields to a 2.40% finish on the week, highlighting his primary support for tax reform. The report also helped to boost stocks and weighed on the US dollar.
The USD pullback comes after four days of gains and despite a 3.0% rise in the first look at Q3 GDP. That was better than 2.6% expected and showed the economy weathered the hurricanes, but the weakest final sales figure (after inventories) in nearly 2 years dragged USD on Friday.
The choice for Fed chair via announcement or leak could come any day this week and one of the first spots we will be looking after the news is if 10s can definitely break above 2.40%. At the same time, the FOMC decision on Friday could be a place for Yellen to tee-up a December hike and send yields and the dollar higher anyway.
CFTC Commitments of Traders
Speculative net futures trader positions as of the close on Tuesday. Net short denoted by - long by +.
- EUR +84K vs +90K prior
- GBP -1K vs +5K prior
- JPY -116K vs -101K prior
- CHF –12K vs -5K prior
- CAD +72K vs +75K prior
- AUD +57K vs +62K prior
- NZD +1K vs +7K prior
The moves are modest overall. In cable, the quick backtrack to net-short after two weeks of net-longs is a reminder of how Brexit worries outweigh a possible rate hike. Looking ahead, the real spot to watch is CAD and AUD. They are struggling and increasingly vulnerable. Positioning was flat the last time USD/CAD was at 1.29 so all of the 72,000 net longs might be underwater.
Is Trump’s Tax Reform Bullish for Equities?
The tax reform is perhaps the single most important agenda for Republicans. The consequence for falling short of the tax overhaul is dire. Should Republicans fail to deliver the tax reform, they could face rout in the mid-term elections next year. This means losing control of the Senate and possibly also the House of Representatives where they have a majority now. Recently, Treasury Secretary Steve Mnuchin has suggested that stock market could give back much of the gain if tax reform fails. Mnuchin said during a recent interview with Politico: "There is no question that the rally in the stock market has baked into it reasonably high expectations of us getting tax cuts and tax reform done". Given the high stake, the market seems to believe that some version of tax reform is likely to come out of Washington.
Reduction in corporate tax rate will boost S&P 500 Earnings Per Share
S&P 500 has gained in value more than $3.5 trillion since Trump's election last November. Some suggest that it is due to the investors expectation that the Earnings Per Share of the S&P 500 companies would get a boost, and thus increasing the valuation. One major component in the tax reform proposal is a reduction in corporate tax rate. Trump proposed a reduction from the current effective tax rate of 25.4% to 15% while he was a presidential candidate, while House Speaker Paul Ryan proposed a reduction in corporate tax rate to 20%.
An estimate by Ned Davis Research suggests that a drop of corporate tax rate from the current effective tax rate of 25.4% to 20% will boost S&P 500 EPS (Earnings Per Share) by 7.2%, while an adjustment to 15% corporate tax rate would increase S&P 500 EPS by 13.9%. The percentage increase in after-tax income is even greater for mid-cap and small-cap companies as the chart below shows:
Trump's tax reform plans passed an important hurdle last week when the Senate approved a budget measure which allows the Republicans to deliver a tax-cut package without Democratic support. The Republicans still have yet to produce the tax reform bill as the end of the year approaches. At present, there's still a lot of disagreement as to what cuts to make and how to pay for them. However, with the intense pressure to succeed on tax reform after they fail to repeal and replace Obamacare, there's a good chance that some forms of tax reform will come out either this year or in the first half of next year.
Is Tax Reform the reason for American stock markets rally?
Some argue that the expectation of tax reform and higher EPS will cause American stock market to keep rallying. However, if this is the only reason, then only American market should keep rallying. The rest of the World Indices should not keep rallying as they have nothing to do with Trump's Tax Reform. But is that really the case? An overlay of some major Indices from the West and East below (FTSE, S&P, Dow, DAX, Nikkei, and Hangseng) can give us further insight:
The six World Indices above represent various geographic regions and they look almost identical in their oscillation. They all have major low in 2009 and secondary low around February 2016. As of this writing, they all keep making a new high. Granted that not all of them make all-time historic high like S&P 500 or DJIA, but they all still keep rallying nonetheless. This simple analysis tells us that there's more than just the argument that tax reform supports American stock market. We at Elliottwave-Forecast believe there is only one market and a high degree of correlation within the same group and also across asset groups.
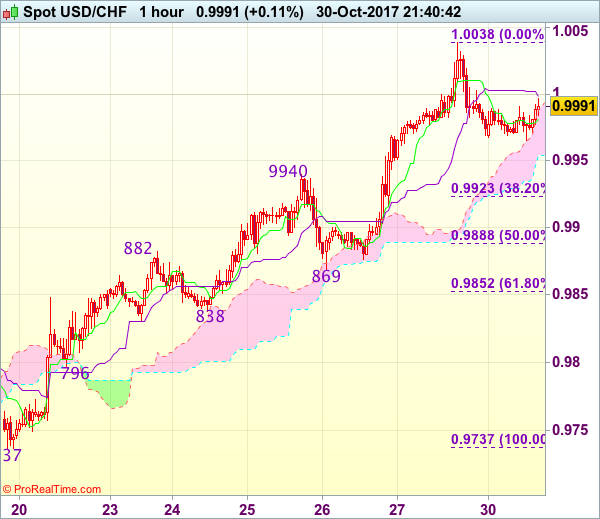
Trade Idea Update: USD/CHF – Buy at 0.9920
USD/CHF - 0.9988
Original strategy :
Buy at 0.9920, Target: 1.0030, Stop: 0.9885
Position : -
Target : -
Stop : -
New strategy :
Buy at 0.9920, Target: 1.0030, Stop: 0.9885
Position : -
Target : -
Stop : -
Dollar’s retreat after rising to 1.0038 on Friday has retained our view that minor consolidation below this level would be seen and pullback to the upper Kumo (now at 0.9956) is likely, below would bring correction to previous resistance at 0.9940, however, reckon 0.9920-25 (38.2% Fibonacci retracement of 0.9737-1.0038) would limit downside and bring another rise, above said resistance at 1.0038 would extend recent rise from 0.9421 low to 1.0050-55, having said that, overbought condition should limit upside to 1.0075-80 and price should falter below 1.0100 resistance and bring retreat later.
In view of this, we are looking to buy dollar again on pullback as 0.9920-25 should limit downside, bring another rise later. Below 0.9885-90 (50% Fibonacci retracement of 0.9737-1.0038) would defer and suggest top is possibly formed, risk test of support at 0.9869.
Trade Idea Update: GBP/USD – Sell at 1.3225
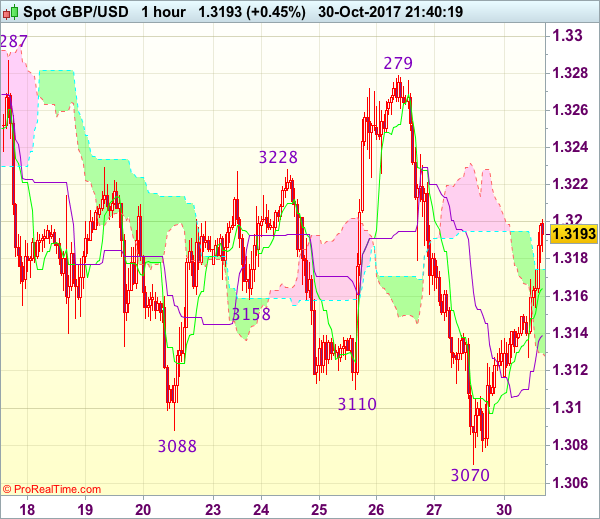
GBP/USD - 1.3183
Original strategy :
Sell at 1.3225, Target: 1.3125, Stop: 1.3260
Position : -
Target : -
Stop : -
New strategy :
Sell at 1.3225, Target: 1.3125, Stop: 1.3260
Position : -
Target : -
Stop : -
As cable found support at 1.3070 on Friday and has rebounded, suggesting consolidation above this level would be seen and corrective bounce to 1.3200, then 1.3220-25 cannot be ruled out, however, still reckon upside would be limited and bring another decline later, below 1.3100 would bring test of said support at 1.3070, break there would extend the erratic decline from 1.3338 to 1.3050, then towards recent low at 1.3027.
In view of this, we are looking to sell cable on further subsequent recovery as 1.3220-25 should limit upside. Above 1.3250 would dampen this bearish view and prolong consolidation, risk rebound to resistance at 1.3279-87 first.
Trade Idea Update: EUR/USD – Sell at 1.1685
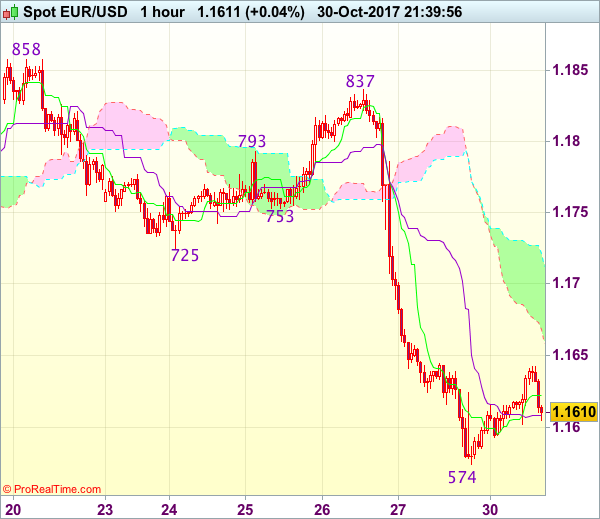
EUR/USD - 1.1614
Original strategy :
Sell at 1.1685, Target: 1.1585, Stop: 1.1720
Position : -
Target : -
Stop : -
New strategy :
Sell at 1.1685, Target: 1.1585, Stop: 1.1720
Position : -
Target : -
Stop : -
As the single currency recovered after falling to 1.1574 on Friday, suggesting consolidation above this level would be seen and corrective bounce to 1.1645-50 cannot be ruled out, however, reckon upside would be limited to the lower Kumo (now at 1.1686) and bring another decline later, below said support at 1.1574 would extend recent decline from 1.2093 top to 1.1550-55 but loss of downward momentum should prevent sharp fall below 1.1520-25 and reckon 1.1500 would hold from here.
In view of this, we are looking to sell euro on subsequent recovery as the lower Kumo (now at 1.1686) should limit upside and bring another decline. Only above previous support at 1.1725 (now resistance) would signal low is formed instead, bring retracement of recent decline to 1.1750-55 first.
Trade Idea Update: USD/JPY – Sell at 114.20
USD/JPY - 113.40
Original strategy :
Sell at 114.20, Target: 113.20, Stop: 114.55
Position : -
Target : -
Stop : -
New strategy :
Sell at 114.20, Target: 113.20, Stop: 114.55
Position : -
Target : -
Stop : -
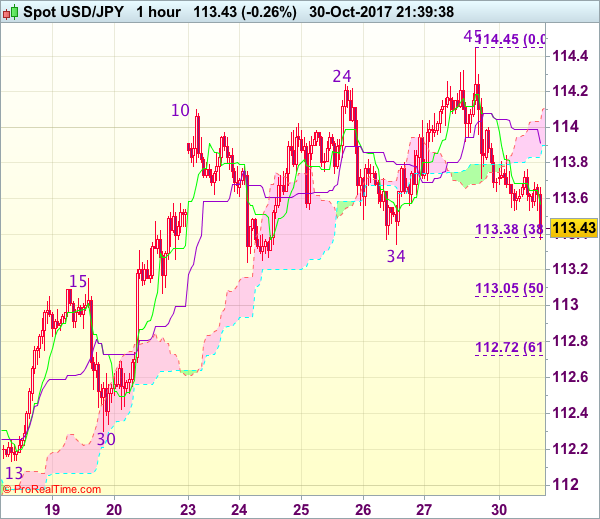
Dollar’s retreat after Friday’s brief rise to 114.45 suggests consolidation below this level would be seen and weakness to 113.34-38 (previous support and 38.2% Fibonacci retracement of 111.65-114.45), break there would add credence to our view that top has possibly been formed, bring correction of recent rise to 113.05-15 (50% Fibonacci retracement and previous resistance), however, reckon 112.70-75 (61.8% Fibonacci retracement) would remain intact, bring another rise later.
In view of this, we are looking to sell dollar on recovery as 114.20-25 should limit upside, bring another retreat. Above indicated resistance at 114.45-50 would extend recent rise from 107.32 low for further gain to 114.75-80 (61.8% projection of 111.65-114.10 measuring from 113.24), however, overbought condition should limit upside to 115.00 and risk from there is seen for a retreat later.