Sample Category Title
Market Update – Asian Session: China PMI Declines, Sending Yields Lower
Asia Summary
Asian equity markets have opened generally lower, following the mixed trading session in the US.
In the tech sector, chip giant, Samsung Electronics has gained over 1%. The company confirmed its Q3 results, announced a plan to increase capital returns to shareholders and said it plans to raise its FY17 Capex by over 80% y/y. Softbank has declined by over 5%, following the speculation that the merger between Sprint and T-Mobile could be canceled. Shares of Nintendo have risen by over 6%, as the company raised its FY forecast on demand for its Switch device.
South Korean advertising firm Cheil Worldwide has gained over 9%, as the company reported better than expected Q3 results. Shares of Lotte Shopping and Lotte Tour have outperformed. Earlier today, South Korea and China agreed to work toward improving bilateral relations.
Fast Retailing has declined by over 0.4% amid the earlier weakness seen in the S&P 500’s Consumer Discretionary sector. Australian Retailer Woolworth’s has gained over 1.5%, as Q3 revenues rose by over 3%.
Steel makers are currently trading mixed. Kobe Steel has gained over 1%, after reporting its financial results. At the same time, Nippon Steel and South Korea’s Posco have declined by over 1%. In Oct, China’s Steel PMI declined, according to an industry association.
The auto sector in Japan has traded generally lower. On Wednesday (Nov 1st), Honda is expected to release its financial results.
Japanese mega banks have added on to the losses seen in the prior session. In the brokerage space, Nomura has declined by over 2% after the company reported a decline in its quarterly profits. There has also been some weakness in the banking sector in China/Hong Kong. Shares of the Bank of China have declined by over 3%, after the company reported flat Q3 profits. China Communications Construction has dropped over 2% following its 9-month results. In the mining sector, Glencore said it would move to have its Hong Kong listing withdrawn in 2018.
Meanwhile, China’s Oct official manufacturing and non-manufacturing PMIs each declined from the prior month. The country’s sovereign 10-year bond yield has declined for the first time in 5 sessions, after yields moved to the highest level since late 2014 during the prior session.
In terms of the Chinese shorter-term rates, there has been speculation that the PBoC could announce a medium-term lending facility (MLF) by as soon as Friday. Liquidity conditions in China may tighten in the near term with around CNY1T in funds expected to mature this week, says the China Securities Journal.
In Japan, as speculated the BoJ left policy unchanged and lowered its inflation forecasts. Once again at today’s policy meeting, official Kataoka was the dovish dissenter on the belief that the central bank’s policy should target the 15-year JGB yield as opposed to the 10-year yield, which is currently the focus.
There has been little initial impact on the Yen following the policy decision. In New Zealand, the Kiwi has declined by over 0.4%, as PM Ardern confirmed plans to crack down on foreign purchases of residential properties. On tomorrow’s session, New Zealand’s Q3 employment figures are expected to be released. Ardern has previously said the incoming government plans to review the RBNZ’s mandate to see whether it should cover employment
Japanese companies expected to report results later today include, Asahi Glass, Daiichi Sankyo, FUJIFILM, Japan Airlines, JTEKT, JVC Kenwood, Mitsubishi Heavy, NEC Corp, NGK Insulators, Nippon Express, Nitto Denko, Oki Electric Industry, Omron, Panasonic, Sony, Sumitomo Heavy and TEPCO.
Key economic data
(JP) BANK OF JAPAN (BOJ) LEAVES INTEREST RATE ON EXCESS RESERVES (IOER) UNCHANGED AT -0.10%; AS EXPECTED
(NZ) NEW ZEALAND SEPT BUILDING PERMITS M/M: -2.3% V +5.9% PRIOR (1st decline in 5-months)
(CN) CHINA OCT OFFICIAL GOVT MANUFACTURING PMI: 51.6 V 52.0E
(KR) South Korea Sept Cyclical Leading Index Change: -0.2 v 0.1 prior
(KR) SOUTH KOREA SEPT INDUSTRIAL PRODUCTION M/M: 0.1% V 2.2%E; Y/Y: 8.8% V 4.8%E
(JP) JAPAN SEPT OVERALL HOUSEHOLD SPENDING: -0.3% V 0.6%E
(JP) JAPAN SEPT PRELIM INDUSTRIAL PRODUCTION M/M: -1.1% V -1.6%E; Y/Y: 2.5% V 2.0%E
(NZ) New Zealand Oct ANZ Business Confidence: -10.1 v 0.0 prior; Activity Outlook: 22.2 v 29.6 prior
(AU) Australia Sept HIA New Home Sales m/m: -6.1% v 9.1% prior
(AU) AUSTRALIA SEPT PRIVATE SECTOR CREDIT M/M: 0.3% V 0.5%E; Y/Y: 5.4% V 5.6%E
Speakers and Press
Japan
(JP) Japan said to set FY18 budget at ~¥98T v ¥97.5T set in FY17 - Nikkei
Korea
(KR) South Korea Ministry of Foreign Affairs: South Korea and China agreed to restore their bilateral relations to a "normal development path swiftly" as stronger ties meet their mutual interests
China/Hong Kong
(CN) Former China SAFE (FX regulator) official sees stronger US dollar putting pressure on the yuan – China Securities Times
(CN) PBoC said to check bank demand for medium-term lending facility (MLF) loans, with possible operations on Friday - financial press
(CN) China liquidity conditions expected to tighten with ~CNY1T in funds are due to mature this week - China Securities Journal
Australia/New Zealand
(NZ) New Zealand PM Ardern: To amend law to classify residential homes as sensitive which means non-residents can't buy existing homes; expects law to be introduced before Christmas
Asian Equity Indices/Futures (00:00ET)
Nikkei -0.2%, Hang Seng -0.2%; Shanghai Composite -0.3%; ASX200 +0.0%, Kospi +0.6%
Equity Futures: S&P500 +0.1%; Nasdaq100 +0.1%, Dax closed for holiday; FTSE100 +0.1%
FX ranges/Commodities/Fixed Income (00:00ET)
EUR 1.1653-1.1632; JPY 113.28-112.98; AUD 0.7699-0.7672;NZD 0.6882-0.6838
Dec Gold -0.1% at $1,276/oz; Nov Crude Oil -0.2% at $54.05/brl; Dec Copper -0.1% at $3.11/lb
USD/CNY *(CN) PBOC SETS YUAN REFERENCE RATE AT 6.6397 V 6.6487 PRIOR
(CN) PBoC OMO: Injects CNY300B combined CNY150B in 7-day, 14-day and 63-day reverse repos v CNY140B prior; Net injection CNY80B v CNY40B prior
Equities notable movers
Australia/New Zealand
SGH.AU Updates on recapitalization; -20.6%
AHZ.AU Reports Q1 (A$) Rev 1.9M, +23% y/y; -13%
Japan
7974.JP Reports H1 Net profit ¥51.5B v ¥38.3B y/y, Op profit ¥40.0B v loss ¥5.95B y/y, Rev ¥374B v ¥137B y/y; Raises FY18 outlook’ +4%
3092.JP Reports H1 Net ¥9.6B v ¥8.1B y/y; Op ¥13.8B v ¥10.6B y/y; Rev ¥42.7B v ¥31.6B y/y; -9%
China/Hong Kong
000338.CN Reports Q3 (CNY) Net profit 1.95B, +316.1% y/y; +7.3%
Korea
005930.KR Reports Q3 (KRW) Net 11.2T v 10.8Te; Op 14.5T v 14.5T prelim; Rev 62.1T v 62.0T prelim; +1.6%
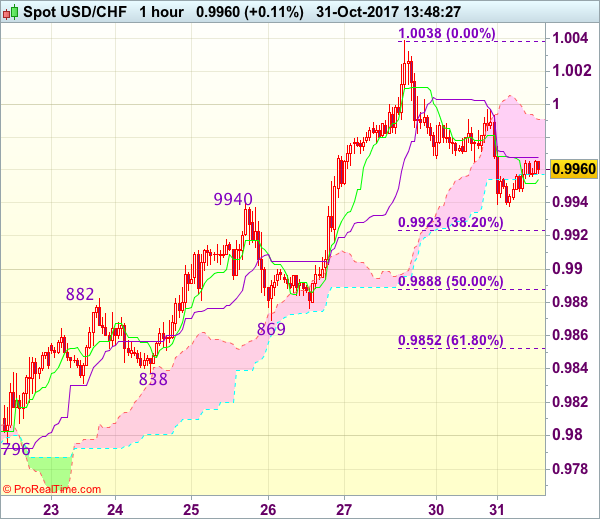
Trade Idea : USD/CHF – Buy at 0.9920
USD/CHF - 0.9958
Most recent candlesticks pattern : N/A
Trend : Up
Tenkan-Sen level : 0.9957
Kijun-Sen level : 0.9968
Ichimoku cloud top : 0.9991
Ichimoku cloud bottom : 0.9958
Original strategy :
Buy at 0.9920, Target: 1.0030, Stop: 0.9885
Position : -
Target : -
Stop : -
New strategy :
Buy at 0.9915, Target: 1.0030, Stop: 0.9880
Position : -
Target : -
Stop : -
Although dollar has recovered from 0.9938, reckon 1.0000 would limit upside and near term downside risk remains for the corrective fall from 1.0038 (last week’s high) to bring retracement of recent rise to 0.9920-25 (38.2% Fibonacci retracement of 0.9737-1.0038), however, reckon 0.9905-10 would limit downside and bring another rise later, above 1.0000 would bring retest of said resistance at 1.0038, break there would extend recent rise from 0.9421 low to 1.0050-55, then towards 1.0075-80 but price should falter below 1.0100 resistance.
In view of this, we are looking to buy dollar again on pullback as 0.9915-25 should limit downside, bring another rise later. Below 0.9885-90 (50% Fibonacci retracement of 0.9737-1.0038) would defer and suggest top is possibly formed, risk test of support at 0.9869.
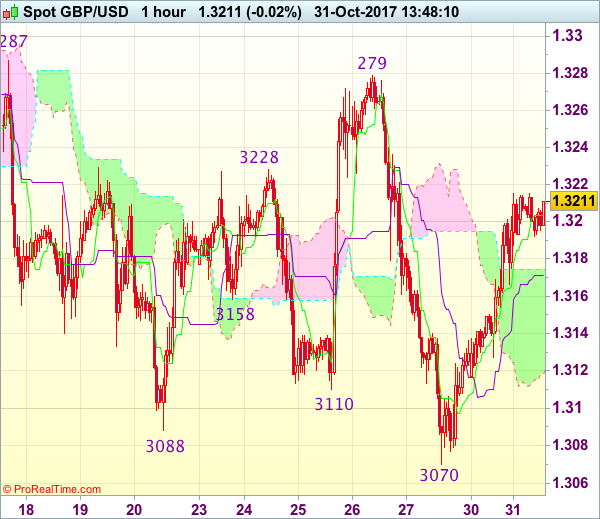
Trade Idea : GBP/USD – Sell at 1.3255
GBP/USD - 1.3207
Most recent candlesticks pattern : N/A
Trend : Near term down
Tenkan-Sen level : 1.3204
Kijun-Sen level : 1.3171
Ichimoku cloud top : 1.3175
Ichimoku cloud bottom : 1.3118
Original strategy :
Sell at 1.3255, Target: 1.3135, Stop: 1.3290
Position : -
Target : -
Stop : -
New strategy :
Sell at 1.3255, Target: 1.3135, Stop: 1.3290
Position : -
Target : -
Stop : -
As cable has maintained a firm undertone after staging a strong rebound from 1.3070, suggesting near term upside risk remains for further gain to 1.3240-50, however, as broad outlook remains consolidative, reckon upside would be limited and indicated strong resistance at 1.3279-87 would remain intact, bring retreat later, below 1.3120-25 would signal the rebound from 1.3070 has ended, bring weakness to 1.3100, then retest of 1.3070, break there would extend the erratic decline from 1.3338 to 1.3050, then towards recent low at 1.3027.
In view of this, we are looking to sell cable on further subsequent recovery as 1.3255-60 should limit upside. Only above indicated strong resistance at 1.3279-87 would abort and shift risk to the upside for the erratic rise from 1.3027 low is still in progress for further gain to 1.3300-10, then towards 1.3340-50.
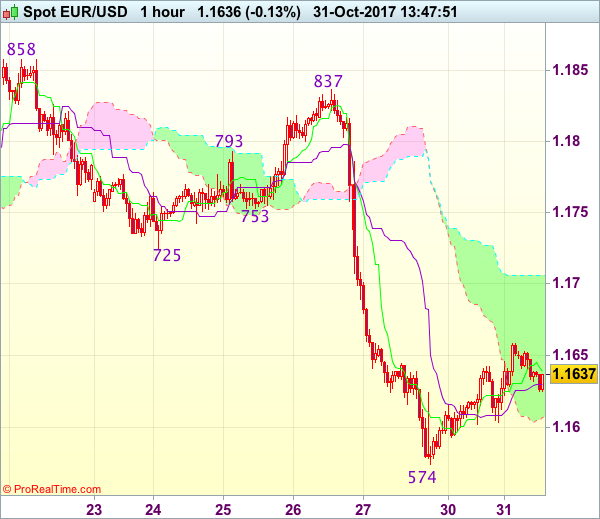
Trade Idea : EUR/USD – Sell at 1.1700
EUR/USD - 1.1635
Most recent candlesticks pattern : N/A
Trend : Down
Tenkan-Sen level : 1.1639
Kijun-Sen level : 1.1630
Ichimoku cloud top : 1.1706
Ichimoku cloud bottom : 1.1607
Original strategy :
Sell at 1.1685, Target: 1.1585, Stop: 1.1720
Position : -
Target : -
Stop : -
New strategy :
Sell at 1.1700, Target: 1.1595, Stop: 1.1735
Position : -
Target : -
Stop : -
Euro’s recovery after falling to 1.1574 late last week has retained our view that further consolidation above this level would be seen and corrective bounce to 1.1660-65 cannot be ruled out, however, reckon upside would be limited to the upper Kumo (now at 1.1706) and bring another decline later, below said support at 1.1574 would extend recent decline from 1.2093 top to 1.1550-55 but loss of downward momentum should prevent sharp fall below 1.1520-25 and reckon 1.1500 would hold from here.
In view of this, we are looking to sell euro on subsequent recovery as the upper Kumo (now at 1.1706) should limit upside and bring another decline. Only above previous support at 1.1725 (now resistance) would signal low is formed instead, bring retracement of recent decline to 1.1750-55 first.
Trade Idea : USD/JPY – Sell at 113.80
USD/JPY - 113.12
Most recent candlesticks pattern : N/A
Trend : Near term up
Tenkan-Sen level : 113.13
Kijun-Sen level : 113.37
Ichimoku cloud top : 113.90
Ichimoku cloud bottom : 113.84
Original strategy :
Sell at 114.20, Target: 113.20, Stop: 114.55
Position : -
Target : -
Stop : -
New strategy :
Sell at 113.80, Target: 112.80, Stop: 114.15
Position : -
Target : -
Stop : -
As the greenback has remained under pressure after dropping from 114.45 (last week’s high), adding credence to our view that top has been made there and consolidation with downside bias remains for this fall to bring retracement of recent upmove, hence further fall to 112.70-75 (61.8% Fibonacci retracement of 111.65-114.45) is likely, however, near term oversold condition should limit downside to 112.50 and reckon previous support at 112.30 would hold from here, bring rebound.
In view of this, we are looking to sell dollar on recovery but at a lower level as the lower Kumo (now at 113.84) should cap upside and bring another decline. Above 114.20-25 would abort and signal the retreat rom 114.45 has ended, bring retest of indicated strong resistance at 114.45-50 which is likely to hold on first testing.

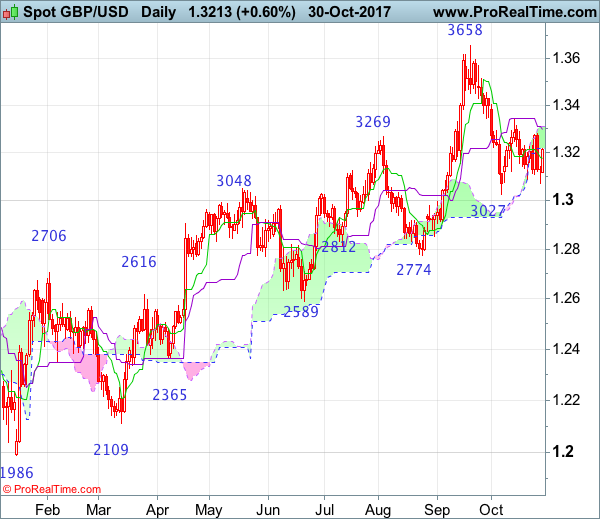
GBP/USD Candlesticks and Ichimoku Analysis
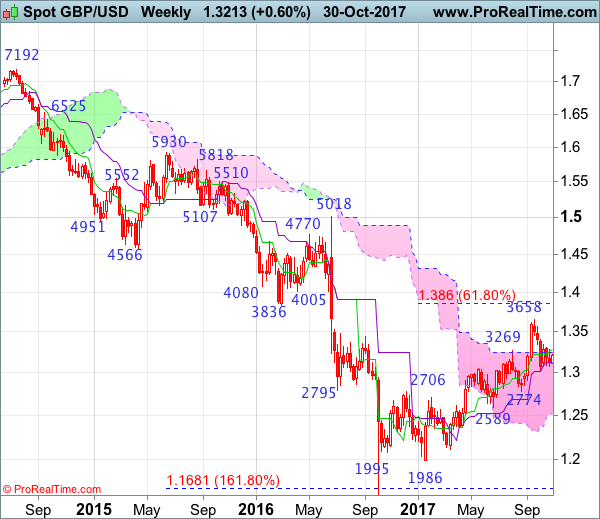
Weekly
• Last Candlesticks pattern: Shooting star
• Time of formation: 31 Jul 2017
• Trend bias: Down
Daily
• Last Candlesticks pattern: Morning star
• Time of formation: 25 Aug 2017
• Trend bias: Near term up
GBP/USD – 1.3211
Although cable fell briefly to 1.3070 late last week, lack of follow through selling on break of previous support at 1.3088 and the subsequent rebound formed a doji star (with a long lower shadow) followed by a white candlestick, suggesting further choppy trading would be seen and recovery to 1.3225-30 cannot be ruled out, however, still reckon upside would be limited to 1.3279-87 resistance area and bring retreat later. A daily close above this level would suggest the retreat from 1.3338 has ended at 1.3070, then another leg of corrective rise from 1.3027 low would take place for test of 1.3338, break there would extend gain to 1.3400, then test of previous resistance at 1.3455 which is likely to hold on first testing.
On the downside, whilst pullback to 1.3140-50 cannot be ruled out, said support at 1.3070 should remain intact and bring another rebound later. A break below this level would revive bearishness and bring retest of recent low at 1.3027 but only a drop below this level would confirm early decline from 1.3658 top has resumed and extend weakness to 1.3000, then towards 1.2940-50 later.
Recommendation: Stand aside for this week.
On the weekly chart, despite last week’s fall to 1.3070, lack of follow through selling on break of previous support at 1.3088 and the subsequent bounce suggest sterling has remained confined within near term established range, hence further sideways trading is in store and recovery to 1.3225-30 cannot be ruled out, however, as outlook remains consolidative, reckon upside would be limited to 1.3279-87, price should falter below resistance at 1.3338 and bring retreat later. Only above 1.3338 would signal the retreat from 1.3658 has possibly ended, bring a stronger rebound to 1.3400-05 and possibly towards but price should falter well below said resistance at 1.3658. In the event sterling breaks above 1.3571 resistance, this would bring a retest of this last month’s high at 1.3658, break there would extend recent erratic rise from 1.1986 low to 1.3750-60 and 1.3800 but overbought condition should prevent sharp move beyond 1.3860 (61.8% Fibonacci retracement of 1.5018-1.1986).
On the downside, expect pullback to be limited to 1.3125-30 and said support at 1.3070 should hold, bring another rebound. A weekly close below 1.3070 support would signal the rebound from 1.3027 low has ended, bring retest of 1.3027, break of this support would add credence to our view that top has been formed at 1.3658, bring further fall to 1.3000, then towards support at 1.2909, however, anticipated near term oversold condition should prevent sharp fall below previous chart support at 1.2774 and price should stay well above another previous chart support at 1.2589, bring rebound later.
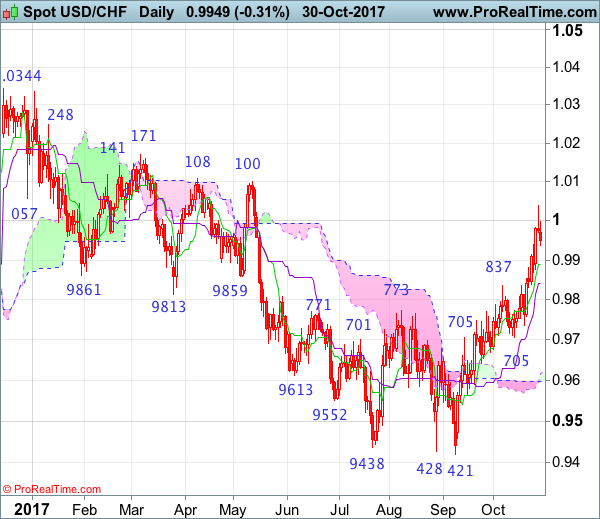
USD/CHF Candlesticks and Ichimoku Analysis
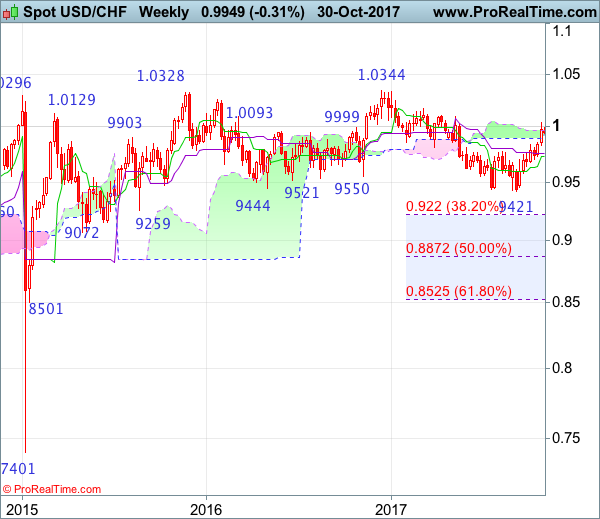
Weekly
• Last Candlesticks pattern: Shooting star
• Time of formation: 7 Mar 2017
• Trend bias: Sideways
Daily
• Last Candlesticks pattern: Morning star
• Time of formation: 9 May 2017
• Trend bias: Near term up
USD/CHF – 0.9970
Although the greenback rose briefly to 1.0039 late last week, the subsequent quick retreat from there formed a shooting star candlestick reversal pattern, hence consolidation below this level would be seen with initial downside bias for pullback to the Tenkan-Sen (now at 0.9888), however, reckon the Kijun-Sen (now at 0.9841) would limit downside and bring another rise later, above said resistance at 1.0039 would extend the rise from 0.9421 low for retracement of early decline from 1.0344 to 1.0050, then towards resistance at 1.0100 which is likely to hold on first testing.
On the downside, a daily close below the Kijun-Sen (now at 0.9841) would bring weakness to 0.9770, however, only a daily close below support at 0.9737 would signal top has been formed instead, bring at least a retracement of recent rise to 0.9700, then test of minor support at 0.9670. A drop below this level would suggest the rise from 0.9421 has ended instead, risk further fall to 0.9642 support but reckon downside would be limited to 0.9590-00 and support at 0.9565 should remain intact.
Recommendation: Buy at 0.9830 for 1.0030 with stop below 0.9730.
On the weekly chart, last week’s rally to 1.0039 formed another white candlestick, adding credence to our near term bullish view that the rebound from 0.9421 low is still in progress and upside bias remains for this move to extend further gain towards resistance at 1.0100-08, however, near term overbought condition should prevent sharp move beyond previous resistance at 1.0171 and 1.0200-10 should hold from here, risk from there is seen for a retreat to take place later.
On the downside, although initial pullback to 0.9890-00 is likely, reckon 0.9800 would limit downside and bring another rise later. Below the Kijun-Sen (now at 0.9761) would bring test of 0.9730-37 (current level of the Tenkan-Sen and previous support) but break there is needed to signal top is formed and suggest first leg of rebound from 0.9737 has ended and bring weakness to 0.9690-00, however, reckon support at 0.9642 would limit downside and price should stay above support at 0.9565 and the greenback shall stage another strong rebound next month.
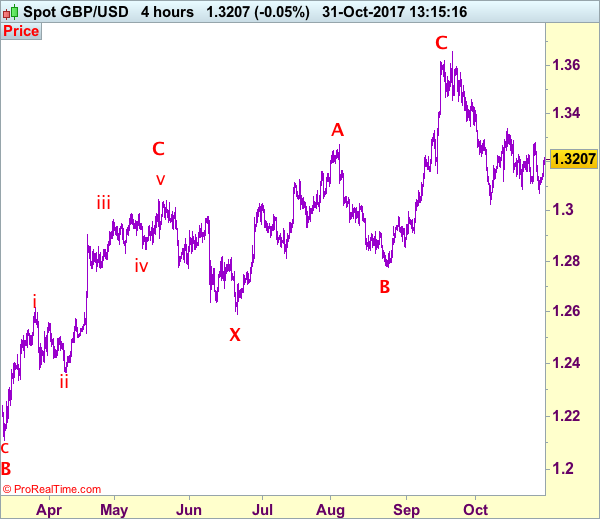
GBP/USD Elliott Wave Analysis
GBP/USD – 1.3210
Despite falling to 1.3070 late last week, lack of follow through selling on break of previous support at 1.3088 and the subsequent rebound suggest the decline from 1.3658 top is not ready to resume yet, hence further consolidation would take place and recovery to 1.3279-87 resistance cannot be ruled out, however, resistance at 1.3338 should hold from here. Only a break of 1.3338 would signal another leg of rebound from 1.3027 is underway for further subsequent gain to 1.3400 and possibly towards resistance at 1.3455. Having said that, if our view that top has been formed at 1.3658 is correct, upside would be limited to 1.3500-10 and bring another decline later.
Our preferred count on the daily chart is that cable's rebound from 1.3500 (wave (A) trough) is unfolding as a wave (B) with A ended at 1.7043, followed by triangle wave B and wave C as well as wave (B) has possibly ended at 1.7192, below support at 1.4232 would add credence to this count, then further fall to 1.4000 level would follow but reckon downside would be limited to 1.3655 support and price should stay above previous support at 1.3500.
On the downside, whilst pullback to 1.3150 cannot be ruled out, reckon 1.3100-10 would limit downside and bring another rebound later. Only a drop below said support at 1.3070 would revive bearishness and signal early rebound from 1.3027 has ended at 1.3338, bring retest of this level. Looking ahead, a drop below 1.3027 would confirm the fall from 1.3658 top has resumed for weakness to 1.3000, then towards 1.2950 but support at 1.2909 should limit downside and another previous support at 1.2852 would remain intact.
Recommendation: Short entered at 1.3300 stopped profit at 1.3250 and would stand aside for this week.
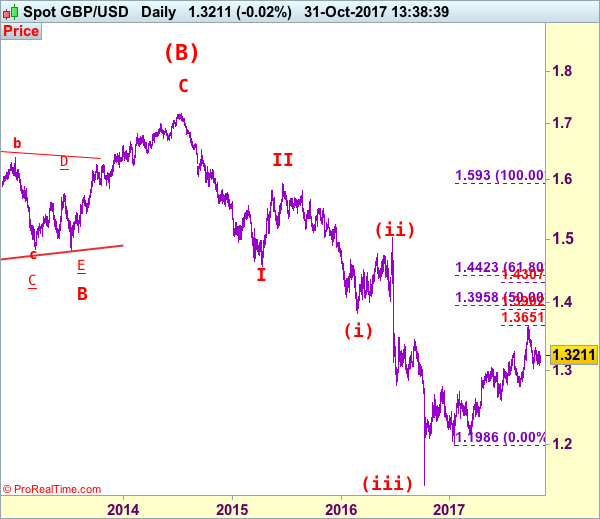
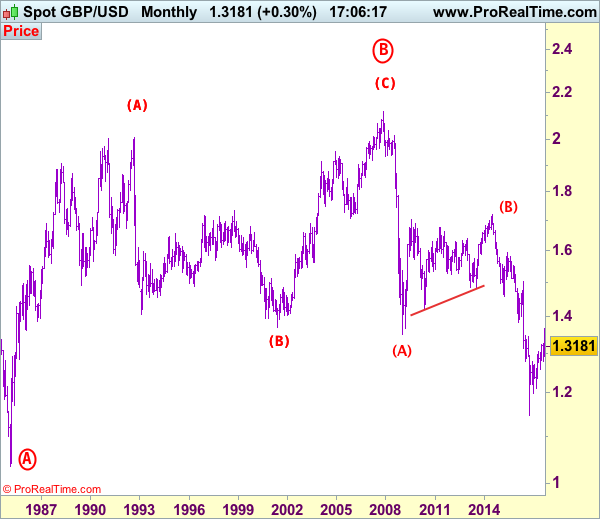
Longer term - Cable's rise from 1.0520 (Feb 1985) to 2.0100 (September 1992) is seen as [A], the decline to 1.3682 is labeled as (B) and (C) wave rally has ended at 2.1162 (9 Nov, 2007) which is also the top of larger degree wave B with circle. The selloff from there is a 5-waver with wave (A) ended at 1.3500 (23 Jan 2009), wave (B) itself is labeled as A: 1.6733, triangle wave B: 1.4813 and wave C as well as top of wave (B) ended at 1.7192 (2014), hence the selloff from there is an impulsive wave (C) with wave I : 1.4566, wave II 1.5930, an extended wave III is unfolding and already exceeded our downside target at 1.3500 and 1.3000, hence weakness to 1.2500 and possibly 1.2000 cannot be ruled out, however, price should stay well above psychological level at 1.0000.
GBP/JPY Elliott Wave Analysis
GBP/JPY – 149.35
Although sterling rose to as high as 151.40 last week, the subsequent retreat suggests consolidation below this level would be seen and pullback to 148.50-60 is likely, however, break of support at 147.75-80 is needed to signal the rebound from 146.95 has ended, then another leg of corrective decline from 152.85 top is underway for retracement of recent rise to 146.00, then towards support at 145.25 but near term oversold condition should limit downside to 144.50 and 143.95-00 should remain intact.
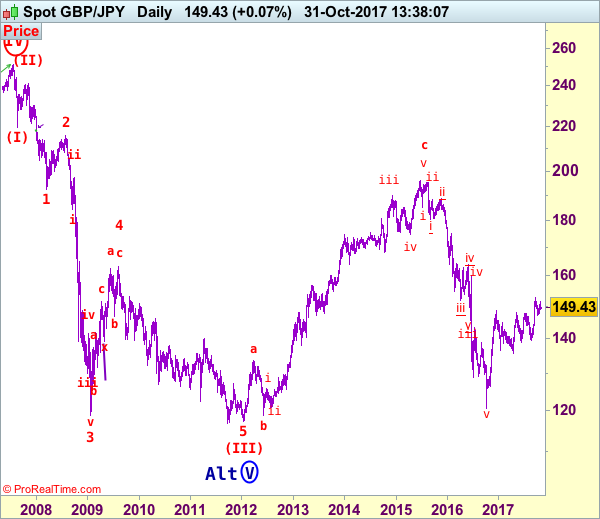
Our preferred count is that larger degree wave V with circle is unfolding from 251.12 with wave (I) 219.34, (II): 241.38 and wave (III) is subdivided into 1: 192.60, 2: 215.89 (23 Jul 2008) and wave 3 ended at 118.87 earlier in 2009. The correction from there to 162.60 is wave 4 which itself is a double three and is labeled as first a-b-c ended at 151.53, followed by wave x at 139.03, 2nd a ended at 162.60, 2nd b at 146.75 and 2nd c leg of wave 4 ended at 163.00. Therefore, the decline from 163.00 to 116.85 is now treated as wave 5 which also marked the end of larger degree wave (III), hence wave (IV) major correction has commenced for retracement of the wave (III) from 241.38 and upside target at 183.95-00 (50% Fibonacci retracement of the wave (II) from 241.38) had been met, a drop below 160.00 would suggest wave (IV) has ended at 195.85, bring decline in wave (V) for initial weakness to 130 (already met) and 120.
On the upside, whilst initial recovery to 150.50-55 cannot be ruled out, said resistance at 151.40 should remain intact and bring further consolidation. A daily close above said resistance at 151.40 would signal the rebound from 146.95 is still in progress and may extend gain to 152.00 but said recent his at 152.85 should remain intact, bring further consolidation. A break of this level would extend recent upmove from 120.50 low (wave v trough) for subsequent gain to 153.50-60, then 154.00-10, however, sharp move beyond 155.00 should not be repeated, risk from there has increased for a correction to take place later.
Recommendation: Stand aside for this week.
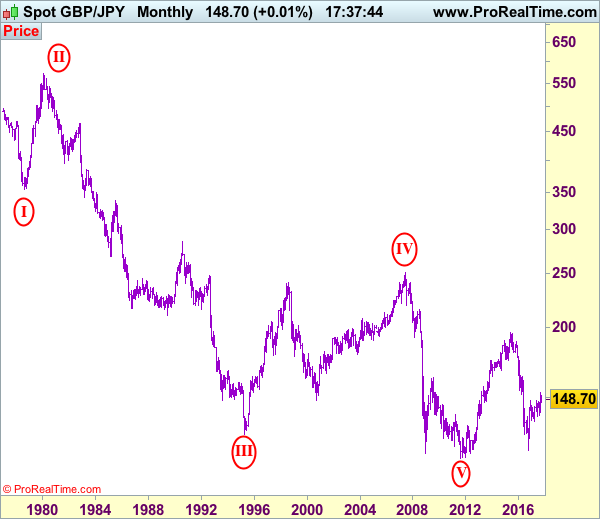
The long-term downtrend from 570.99 (29 Feb 1980) is labeled as an impulsive wave with III with circle ended at 129.77 (20 Apr 1995) and the corrective rebound to 251.12 (20 Jul 2007) is treated as wave IV with circle and the wave V with circle selloff from 251.12 has possibly ended at 116.80 (almost reached our indicated target at 116.00) and major correction has commenced from there and indicated upside target at 183.90-00 (50% Fibonacci retracement of 251.10-116.85) had been met, reckon upside would be limited to 199.80-90 (61.8% Fibonacci retracement) and bring wave (V) decline in later part of 2017.
Trade Idea: GBP/USD – Hold short entered at 1.3195
GBP/USD – 1.3210
Original strategy :
Sold at 1.3195, Target: 1.3030, Stop: 1.3255
Position: - Short at 1.3195
Target: - 1.3030
Stop: - 1.3255
New strategy :
Hold short entered at 1.3195, Target: 1.3030, Stop: 1.3255
Position: - Short at 1.3195
Target: - 1.3030
Stop:- 1.3255
As sterling has maintained a firm undertone after staging a strong rebound from 1.3070, suggesting near term upside risk remains and marginal gain from here cannot be ruled out, however, as broad outlook remains consolidative, reckon upside would be limited to 1.3240-50 and bring retreat later, below 1.3115-20 would suggest the rebound from 1.3070 has ended, bring test of this level, below there would extend weakness towards 1.3027 support. Looking ahead, a break below there is needed to confirm early decline from 1.3658 top has resumed for further fall to psychological support at 1.3000 first.
In view of this, we are holding on to our short position entered at 1.3195. Above 1.3240-50 would defer and prolong choppy consolidation, risk rebound to indicated resistance area at 1.3279-87 which is likely to hold from here. Our preferred count is that (pls see the attached chart) the wave IV is unfolding as a complex double three (ABC-X-ABC) correction with 2nd wave B ended at 1.2774, hence 2nd wave C could have ended at 1.3658.
Our preferred count on the daily chart is that cable's rebound from 1.3500 (wave (A) trough) is unfolding as a wave (B) with A ended at 1.7043, followed by triangle wave B and wave C as well as wave (B) has ended at 1.7192, the subsequent selloff is the larger degree wave (C) which is still unfolding with minor wave (III) of larger degree wave 3 ended at 1.1986, hence wave (IV) correction is in progress which could either be a triangle wave (IV) of a complex formation but upside should be limited to 1.3500 and price should falter well below 1.4000, bring another decline in wave (V) of 3 for weakness to 1.1500, then 1.1200.