Sample Category Title
EUR/CHF Rising Towards The Trend Resistance At 1.1664
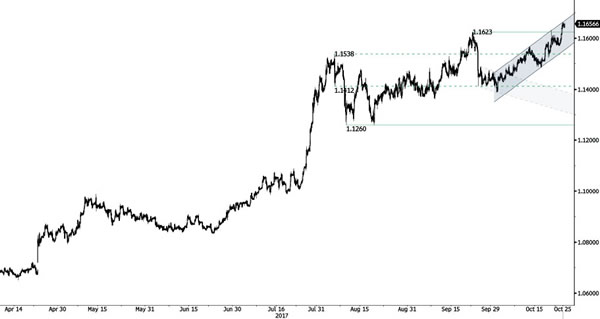
EUR/CHF recovery bounce continues testing key resistance at 1.1664 (rising trend line). Support is given at 1.1388 (02/09/2017 low). Rising channel suggest further bullish momentum.
In the longer term, the technical structure has reversed. Strong resistance is given at 1.20 (level before the unpeg). Yet, the ECB's QE programme is likely to cause persistent selling pressures on the euro, which should weigh on EUR/CHF. Supports can be found at 1.0184 (28/01/2015 low) and 1.0082 (27/01/2015 low).
EUR/GBP Bouncing
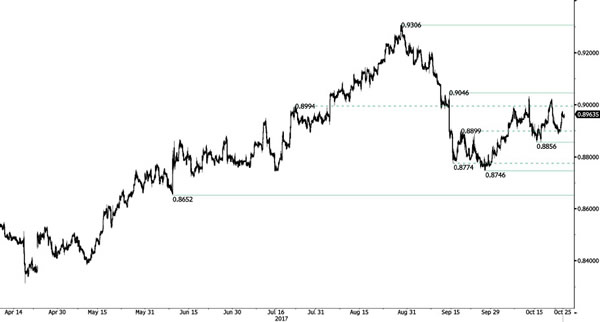
EUR/GBP is showing increasing short-term buying interest near the weak support at 0.8899 (19/09/2017 low). However, as long as prices are below the resistance at 00.9046 (05/09/2017 high), the shortterm technical structure is biased to the downside Hourly support is given at a distance at 0.8746 (27/09/2017 low).
In the long-term, the pair has largely recovered from recent lows in 2015. The technical structure suggests a growing upside momentum. The pair is trading above from its 200 DMA. Strong resistance can be found at 0.9500 (psychological level).
AUD/USD Collapse
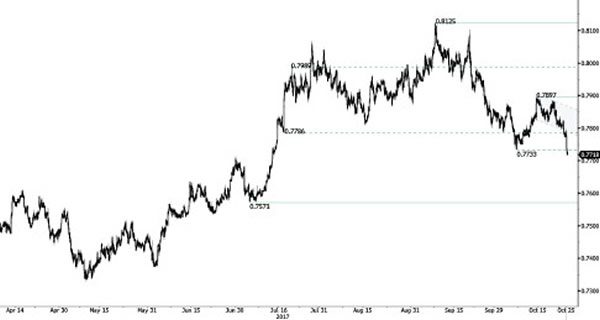
AUD/USD has weakened. Monitor the key support at 0.7571. Hourly resistance is given at 0.7897 (13/10/2017 high). Further support lies at at 0.7733 (06/10/2017 low). Expected to show continued decline
In the long-term, the trend is turning positive. Key supports stands at 0.6009 (31/10/2008 low) . A break of the key resistance at 0.8164 (14/05/2015 high) is needed to invalidate our long-term bearish view.
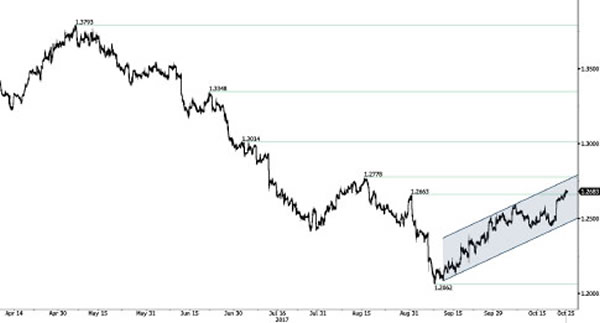
USD/CAD Easy Clear Of Resistance At 1.2636
USD/CAD break of resistance at 1.2636 suggest and extension of bullish momentum. Hourly support lies at 1.2331 (26/09/2017 high). Expected to show continued short-term bullish pressures within uptrend channel.
In the longer term, the pair has broken long-term support that can be found at 1.2461 (16/03/2015 low). Strong resistance is given at 1.4690 (22/01/2016 high). The pair is likely to head further lower
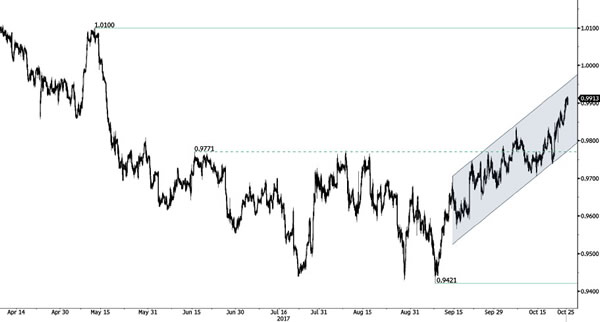
USD/CHF Strong Momentum
USD/CHF is seeing a slight pause of bullish momentum. The technical structure suggests an improving short-term buying interest. Expected to show continued bullish pressures within uptrend channel. Hourly support stands at 0.9712 (12/10/2017 low).
In the long-term, the pair is still trading in range since 2011 despite some turmoil when the SNB unpegged the CHF. Key support can be found 0.8986 (30/01/2015 low). The technical structure favours nonetheless a long term bullish bias since the unpeg in January 2015.
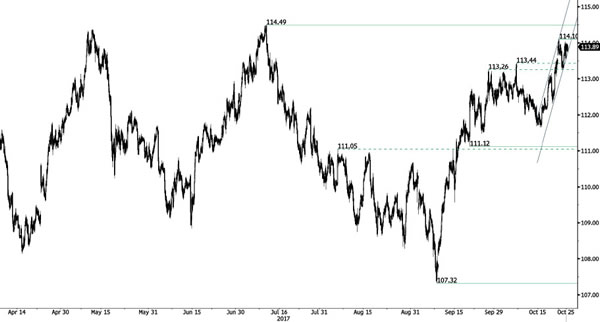
USD/JPY Weakening Short-Term Bullish Momentum?
USD/JPY has bounced back after setting a new hourly resistance at 114.10 (23/10/2017 high). Next key resistance can be found at 114.49 (11/07/2017 high). Support is located at 111.12 (20/09/2017 low).
We favor a long-term bearish bias. Support is now given at 99.02 (10/08/2013 low). A gradual rise towards the major resistance at 125.86 (05/06/2015 high) seems unlikely. Expected to decline further support at 93.79 (13/06/2013 low).
GBP/USD Further Weakness
GBP/USD has successfully tested resistance at (1.3229 reaction high) bouncing towards 1.3027 support. Key resistance stands at 1.3229 then 1.3338 (13/10/2017 high). Key support can be found at (1.3088 12/10/2017 low).
The long-term technical pattern is reversing. The Brexit vote had paved the way for further decline. Long-term support can be found at 1.1841 (07/10/2017 low). Long-term resistance given around 1.35 is at stake and indicates a long-term reversal in the negative trend. Yet, it is very unlikely at the moment.

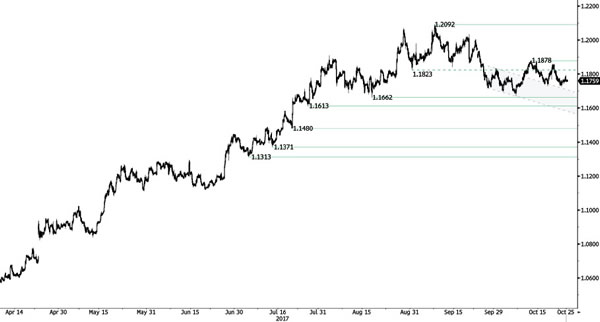
EUR/USD Bearish Pause
EUR/USD remains safety above hourly support at 1.1725 (23/10/20107 low). Break will trigger bearish extension to strong support given at a distance at 1.1662 (17/08/2017 low). Key resistance is located at 1.1878 (12/10/2017 high). Expected to show further short-term weakness.
In the longer term, the momentum is now turning largely positive. We favour a continued bullish bias. Key resistance is holding at 1.2252 (25/12/2014 high) while strong support lies at 1.0341 (03/01/2017 low).
Elliott Wave Analysis: Gold And German DAX
Gold is back at the low of the week, making a bearish trend from 1305 because of lower lows and lower swing highs, as such, we think that current weakness may resume down to 1260 Fib. equality level measured from a top of wave one and from wave two highs.
GOLD, 1H
No change on DAX; price is still slow as market awaits ECB for Thursday, when we may finally see a breakout of a current October range. There is a five sub-wave move in a contracting range, seen as a triangle that is expected to push price higher into wave five. Break above 13070 may open room for recovery to 13200/13250.
German DAX, 1H
Technical Outlook: GBPUSD – Better Than Expected UK GDP Boosts Cable And Cements Expectations Of BoE Rate Hike Next...
Cable bounced from dangerous zone after better than expected UK GDP data and is focusing again daily cloud base resistance (1.3196).
Gross Domestic Product showed stronger than expected growth in Q3 (0.4% vs 0.3% forecast) which further boosts the idea on BoE rate hike on next week's meeting.
Fresh bullish sentiment underpins cable for renewed probe through cloud base / Tenkan-sen (1.3196/1.3212), break of which would open next key barrier at 1.3228 (triple upside rejection) for retest.
Twisting 4-hr cloud (1.3207) also attracts near-term bulls.
Close above 1.3228 pivot is needed to turn near-term structure into full bullish mode for further advance and test of daily cloud top (1.3260).
Res: 1.3212, 1.3228, 1.3242, 1.3260
Sup: 1.3182, 1.3146, 1.3100, 1.3087