
Sample Category Title
Gold Price Upsides Remain Limited Above $1295 Vs US Dollar
Key Highlights
- Gold price struggled to settle above $1300 against the US Dollar and moved down.
- There is a major bullish trend line forming with support at $1270 on the daily chart of XAU/USD.
- The US Manufacturing PMI in Oct 2017 (Prelim) posted a rise from the last reading of 53.1 to 54.5.
- Today, the US New Home Sales for Sep 2017 will be released, which is forecasted to decrease by 0.9% (MoM).
Gold Price Technical Analysis
This week was mostly bearish for Gold price below $1290 against the US Dollar. The price is currently struggling and trading near a major support area at $1275-70.
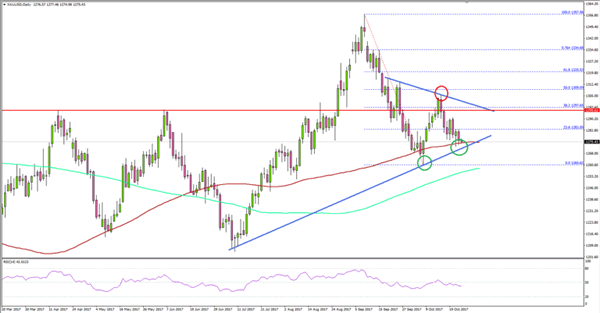
Looking at the daily chart of XAU/USD, there is a major bullish trend line forming with support at $1270. The trend line support is also close to the 100-day simple moving average (red) at $1272.
Therefore, the $1272-70 support area holds a lot of importance. A close below $1270 might ignite more losses towards the $1255 level and the 200-day simple moving average (green).
On the upside, there is a connecting bearish trend line on the same chart with resistance at $1295. As long as the price is below the $1295-1300 levels, it remains at risk of a downside break.
US Manufacturing PMI
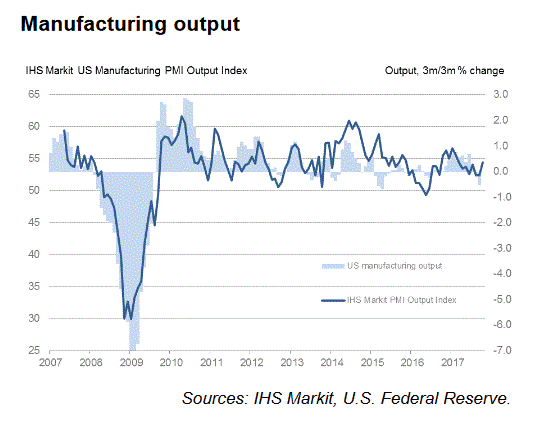
Recently in the US, the preliminary Manufacturing Purchasing Managers Index (PMI) for Oct 2017 was released by the Markit Economics. The forecast was lined up for a rise from the last reading of 53.1 to 53.5.
The actual result was above the forecast as there was a rise in the PMI to 54.5. The Services PMI is also expected to post an increase from 55.3 to 55.9 in Oct 2017, whereas the market was looking for 53.5.
Commenting on the report, the Associate Director at HIS, Tim Moore, stated:
The US economy seems to have made a strong start to the final quarter of 2017. Resilient service sector growth and an encouraging rebound in manufacturing production combined to generate one of the sharpest rises in private sector output for two-and-a-half years during October.
Overall, the result was positive and increased bearish pressure on Gold below $1290, putting it at risk of more declines.
Economic Releases to Watch Today
UK GDP for Q3 2017 (Preliminary) (QoQ) – Forecast +0.3% versus +0.3% previous.
US New Home Sales for Sep 2017 (MoM) – Forecast -0.9% versus -3.4% previous.
US Durable Goods Orders for Sep 2017 – Forecast +1% versus +2% previous.
BoC Interest Rate Decision – Forecast 1%, versus 1% previous.
EUR/JPY Daily Outlook
Daily Pivots: (S1) 132.87; (P) 133.49; (R1) 133.89; More...
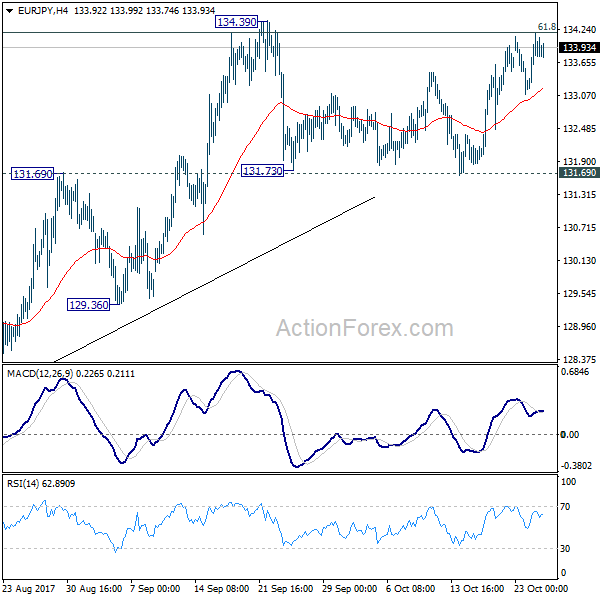
EUR/JPY continues stay in range below 134.39 and intraday bias remains neutral at this point. On the upside, decisive break of 134.39 high will confirm up trend resumption. In such case, EUR/JPY should target 141.04 long term resistance. However, firm break of 131.69 will be an early sign of medium term reversal and will target 127.55 key support level.
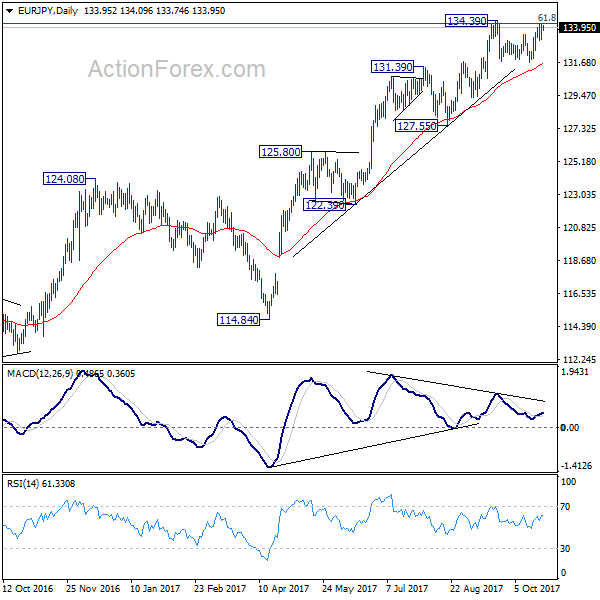
In the bigger picture, medium term rise from 109.03 (2016 low) is seen as at the same degree as the down trend from 149.76 (2014 high) to 109.03 (2016 low). 61.8% retracement of 149.76 to 109.03 at 134.20 is already met. Sustained break there will pave the way to key long term resistance zone at 141.04/149.76. However, break of 127.55 support will argue that the medium term trend has reversed and will turn outlook bearish for deeper fall.
GBP/JPY Daily Outlook
Daily Pivots: (S1) 149.11; (P) 149.60; (R1) 150.06; More
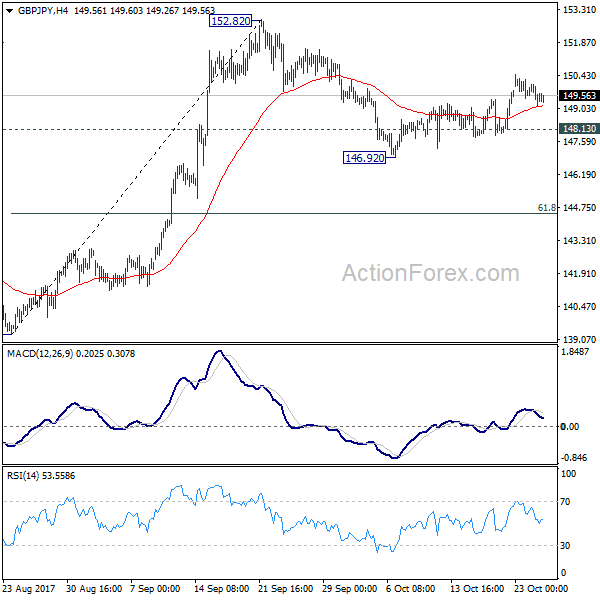
With 148.13 minor support intact, further rise is mildly in favor in GBP/JPY to 152.82 high. Decisive break there will resume whole medium term rise from 122.36. On the downside, break of 148.13 minor support will turn bias to the downside and extend the correction from 152.82. In that case, we'd expect strong support from 61.8% retracement of 139.29 to 152.82 at 144.45 to bring rebound.
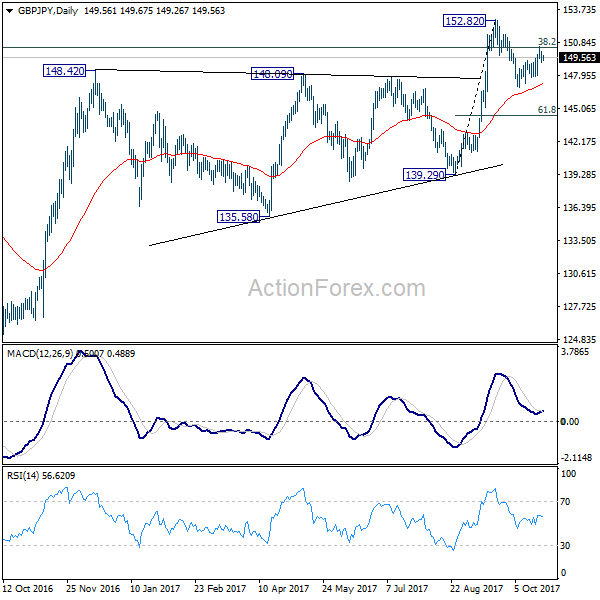
In the bigger picture, medium term rebound from 122.36 is still expected to resume after corrective pull back from 152.82 completes. Firm break of 38.2% retracement of 196.85 to 122.36 at 150.43 will carry long term bullish implications. In that case, GBP/JPY could target 61.8% retracement at 167.78. However, break of 139.29 will indicate rejection from 150.43 key fibonacci level. And the three wave corrective structure of rebound from 122.36 will argue that larger down trend is resuming for a new low below 122.26.
EUR/GBP Daily Outlook
Daily Pivots: (S1) 0.8906; (P) 0.8941; (R1) 0.8988; More...
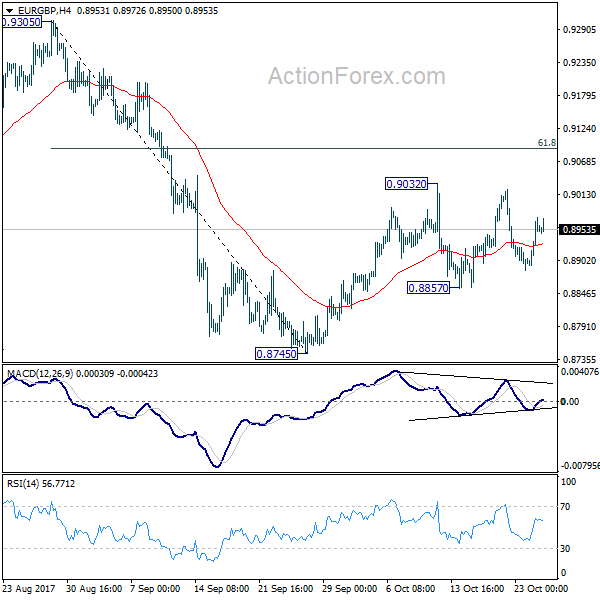
EUR/GBP is staying in range of 0.8857/9032 and intraday bias remains neutral first. As long as 61.8% retracement of 0.9305 to 0.8745 at 0.9091 holds, deeper fall is in favor. Below 0.8857 minor support will turn bias to the downside. Further break of 0.8745 will resume whole decline form 0.9305 and target 0.8303 key support level. Nonetheless, sustained break of 0.9091 will bring retest of 0.9305 instead.
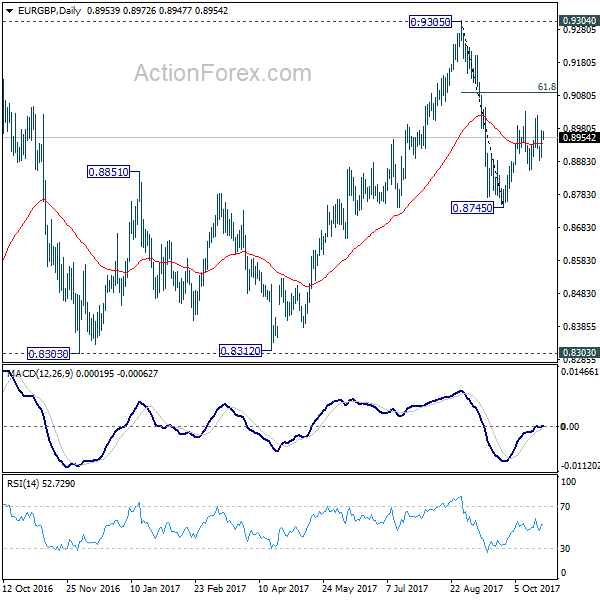
In the bigger picture, there are various ways to interpret price actions from 0.9304 high. But after all, firm break of 0.9304/5 is needed to confirm up trend resumption. Otherwise, range trading will continue with risk of another fall. And in that case, EUR/GBP could have a retest on 0.8303. But we'd expect strong support from 0.8116 cluster support (50% retracement of 0.6935 to 0.9304 at 0.8120) to contain downside.
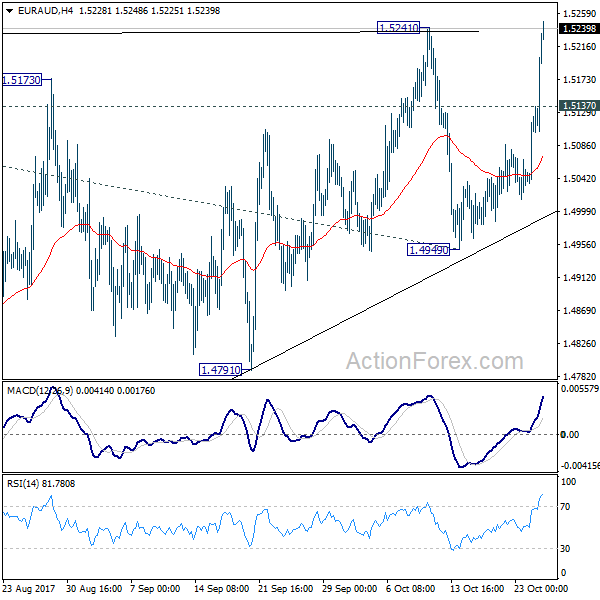
EUR/AUD Daily Outlook
Daily Pivots: (S1) 1.5060; (P) 1.5098; (R1) 1.5161; More....
The strong rally in EUR/AUD and breach of 1.5241 resistance indicates that medium term rise from 1.3624 is resuming. Intraday bias is now on the upside for 61.8% projection of 1.3624 to 1.5226 from 1.4949 at 1.5939 first. On the downside, below 1.5137 minor support will turn intraday bias neutral for consolidations. But outlook will remain cautiously bullish as long as 1.4949 support holds.
In the bigger picture, we're holding on to the view that corrective decline from 1.6587 medium term top has completed at 1.3624. Rise from 1.3624 is expected to extend to retest 1.6587. The corrective structure of the price actions from 1.5226 is affirming this view. Sustained trading above 1.5226 will target a test on 1.6587 key resistance. However, break of 1.4421 support will dampen our view and would drag EUR/AUD lower to retest key support zone around 1.3624.

XAUUSD Intraday Analysis
XAUUSD (1273.13): Gold prices were seen giving up the gains as price action fell back to the 1275 - 1274 support level. This indicates that gold prices could see some short term upside correction. Resistance is seen at 1296 which could be tested in the near term, but further gains can be expected only on a convincing breakout above this level. To the downside, gold prices could potentially slip below the current support level which will see a test of the lower support near the 1262 handle. However, watch out for the descending wedge pattern that price has consolidated into. This could suggest an upside breakout that targets the resistance level at 1296.00.

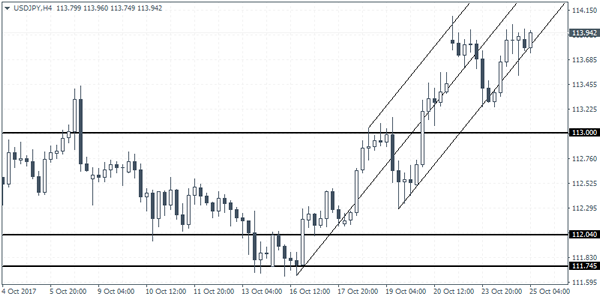
USDJPY Intraday Analysis
USDJPY (113.94): The US dollar managed to recover against the yen as price action posted a strong reversal. This came despite price reversing just above the support level that was supposed to be tested at 113.00 level. A breakout above the previous high formed at 114.00 is requiredin order for USDJPY to maintain the gains. Failure to do so could signal another leg to the downside. This will potentially see USDJPY falling back to establish support at 113.00 which is requiredin order to validate the gains to the upside.
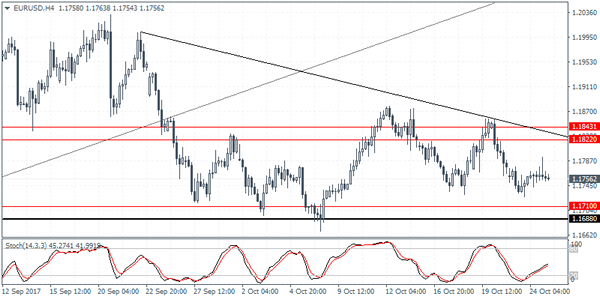
EURUSD Intraday Analysis
EURUSD (1.1756): The EURUSD was seen trading flat with price action briefly rising to intraday highs. The sideways range is expected to be maintained as price action approaches the support level at 1.1710 - 1.1688. A breakdown below this support level could signal further declines in price. On the daily chart, we notice that head and shoulders pattern that has been forming and this could be validated on a test of the neckline support. In the near term, EURUSD could remain trading within the current range, but there is a risk of an upside move. Still, as long as the resistance level of 1.1822 holds, the currency pair remains biased to the downside.
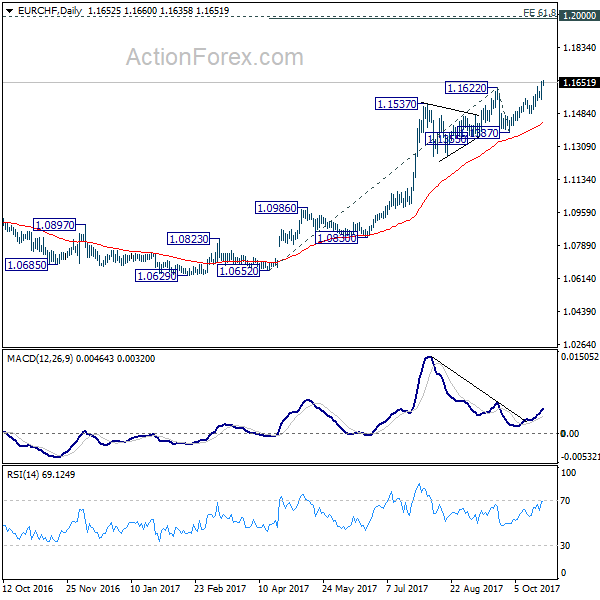
EUR/CHF Daily Outlook
Daily Pivots: (S1) 1.1592; (P) 1.1625; (R1) 1.1686; More...
EUR/CHF's rally resumed after brief consolidation and reaches as high as 1.1660 so far. Intraday bias is back on the upside. The solid break of 1.1622 resistance confirms resumption of medium term rally. Further rise should now be seen to 61.8% projection of 1.0652 to 1.1622 from 1.1387 at 1.1986, which is close to 1.2 key level. On the downside, break of 1.1560 support is needed to indicate short term topping. Otherwise, outlook will remain bullish in case of retreat.
In the bigger picture, long term rise from SNB spike low back in 2015 is still in progress. EUR/CHF should now be heading back to prior SNB imposed floor at 1.2000. For now, this will be the favored case as long as 1.1198 resistance turned support holds.

BoC Expected To Hold Rates Steady. Kiwi Extends Losses
The US dollar was seen maintaining its gains across the board although price action was subdued against the euro. The Kiwi dollar was seen extending losses after the new government reported that it will review and propose reforms for overhauling the RBNZ's mandate.
Earlier today, the inflation report from Australia showed that consumer prices rose 0.6% on the quarter ending July. This was weaker than the estimates of 0.8% but higher than the previous quarter's 0.2% increase. The trimmed mean CPI was weaker, rising just 0.4%.
Looking ahead, the UK's preliminary GDP data will be coming out today. Economists are forecasting a 0.3% increase in GDP on the quarter, which will put the economic expansion at the same pace as in the second quarter. Later in the day, the Bank of Canada will be holding its monetary policy meeting. No changes are expected as the central bank is expected to keep interest rates unchanged after raising rates in the previous two months.