
Sample Category Title
AUD/USD Elliott Wave Analysis
AUD/USD – 0.7777
As aussie has retreated after faltering below resistance at 0.7897, adding credence to our view that the rebound from 0.7733 has possibly ended at 0.7897, hence bearishness remains for a retest of this level but break there is needed to confirm the decline from 0.8125 top has resumed for retracement of early upmove to previous resistance at 0.7712, break there would bring further fall towards 0.7640-50 but near term oversold condition should limit downside and reckon support at 0.7570 would hold.
We are keeping our count that top has been formed at 1.1081 (wave 5 of V) and major correction (A-B-C-X-A-B-C) has commenced, indicated downside targets at 0.7945 (61.8% Fibonacci retracement of entire rise from 0.6007-1.1081) and 0.7750 had been met and downside bias is seen for further weakness to 0.6800, then 0.6700 but reckon 0.6500 would hold from here.
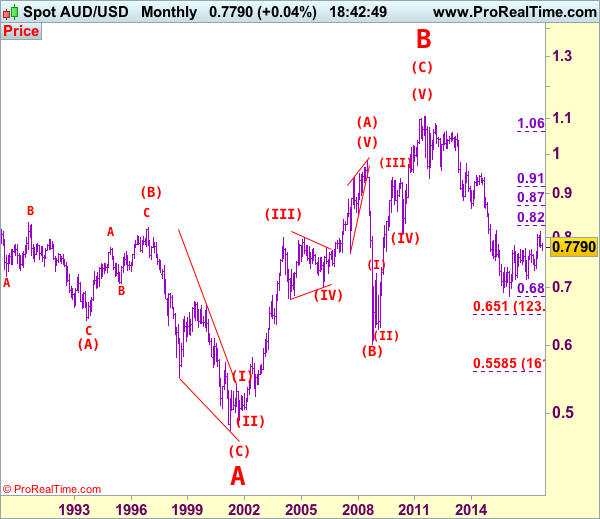
Our preferred count is that the rally from 0.6007 to 0.7270 (7 Jan 2009) is marked as wave A, the retreat to 0.6248 (2 Feb 2009) is wave B and the subsequent upmove is labeled as wave C with wave (iii) and wave (iv) ended at 0.8265 and 0.7700 respectively and wave (v) as well as 3 ended at 0.9407, then wave 4 ended at 0.8066 (instead of 0.8578). The wave 5 has met our indicated projection target of 1.1060 and could ended at 1.1081, this level is now treated as the peak of wave (C) as well as larger degree wave B, hence major fall in wave C has commenced, our initial downside target at psychological support at 0.7000 has just been met and further weakness to 0.6500 would be seen later.
On the upside, expect recovery to be limited to 0.7720-30 and bring another decline to aforesaid downside targets. Above said resistance at 0.7897 would abort and signal low has been formed instead, risk test of previous support at 0.7908, break there would signal first leg of decline from 0.8125 has ended instead, bring a stronger rebound to 0.7940-50 but upside should be limited to 0.8020 and bring another decline later. A daily close above 0.8020 would risk test of 0.8080 but only break of resistance at 0.8103 would signal correction from 0.8125 has ended, bring retest of this level first.
Recommendation: Hold short entered at 0.7870 for 0.7670 with stop above 0.7850.
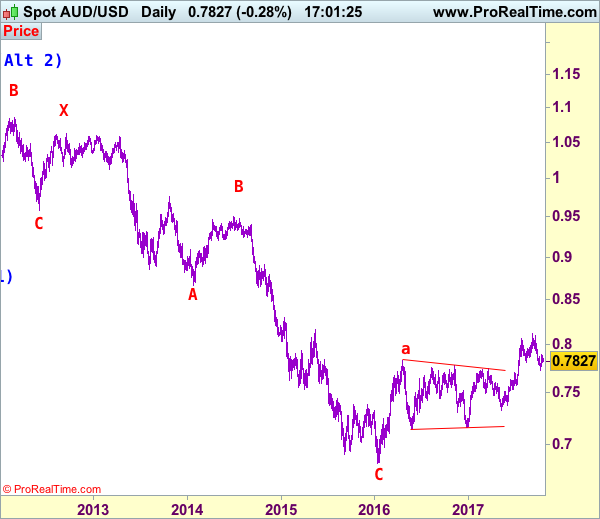
Our alternate count on the daily chart treated the top formed in 2008 at 0.9851 could be a larger degree wave I and was followed by a deep and sharp correction in wave II to 0.6007 and wave III is unfolding from there.
The long-term uptrend started from 0.4775 (2 Apr 2001) with an impulsive structure. Wave I is labeled as 0.4775 to 0.9851 (15 Jul 2008), wave II has ended at 0.6007 (Oct 2008) and wave III is still in progress which may extend further gain to 1.1265.
Loonie Extends Its Losses, Ahead Of BoC’s Interest Rate Decision
For the 24 hours to 23:00 GMT, the USD rose 0.22% against the CAD and closed at 1.2672.
In the Asian session, at GMT0300, the pair is trading at 1.268, with the USD trading 0.06% higher against the CAD from yesterday's close.
The pair is expected to find support at 1.2637, and a fall through could take it to the next support level of 1.2594. The pair is expected to find its first resistance at 1.2708, and a rise through could take it to the next resistance level of 1.2736.
This afternoon will bring the Bank of Canada's (BoC) interest rate decision. Market participants widely anticipate the central bank to stand pat on its monetary policy.
The currency pair is trading above its 20 Hr and 50 Hr moving averages.

Trade Idea : USD/CHF – Buy at 0.9840
USD/CHF - 0.9896
Most recent candlesticks pattern : N/A
Trend : Up
Tenkan-Sen level : 0.9906
Kijun-Sen level : 0.9883
Ichimoku cloud top : 0.9852
Ichimoku cloud bottom : 0.9839
Original strategy :
Buy at 0.9795, Target: 0.9895, Stop: 0.9760
Position : -
Target : -
Stop : -
New strategy :
Buy at 0.9795, Target: 0.9895, Stop: 0.9760
Position : -
Target : -
Stop : -
Yesterday’s rally above resistance at 0.9882 confirms our view that recent rise from 0.9421 low is still in progress and bullishness remains for this move to extend further gain to 0.9920, then towards 0.9940-50, having said that, near term overbought condition should limit upside and price should falter well below psychological resistance at 1.0000, bring retreat later.
In view of this, we are looking to buy dollar again on pullback as said support at 0.9838 should limit downside and bring another rise. A firm break below 0.9830 would defer and risk test of support at 0.9796 but only break of latter level would signal top is formed instead, risk retracement of recent rise to 0.9775-80, however, support at 0.973037 should remain intact.

Trade Idea : GBP/USD – Sell at 1.3185
GBP/USD - 1.3137
Most recent candlesticks pattern : N/A
Trend : Near term down
Tenkan-Sen level : 1.3130
Kijun-Sen level : 1.3169
Ichimoku cloud top : 1.3202
Ichimoku cloud bottom : 1.3158
Original strategy :
Sell at 1.3170, Target: 1.3060, Stop: 1.3205
Position : -
Target : -
Stop : -
New strategy :
Sell at 1.3185, Target: 1.3085, Stop: 1.3220
Position : -
Target : -
Stop : -
Yesterday’s selloff after meeting renewed selling interest at 1.3228 adds credence to our view that the rebound from 1.3088 has ended there and bearishness remains for another test o said support, break there would extend the fall from 1.3338 to 1.3050, then towards recent low at 1.3027 which is likely to hold from here due to near term oversold condition, bring rebound later.
In view of this, wee are looking to sell cable on minor recovery as the Kijun-Sen (now at 1.3169) should limit upside and 1.3190 should hold, bring another decline. Above 1.3200-05 would risk another test of 1.3228, break there would bring a stronger rebound to 1.3240-45 (61.8% Fibonacci retracement of 1.3338-1.3088) but still reckon resistance at 1.3287 would cap upside.

Trade Idea : EUR/USD – Stand aside
EUR/USD - 1.1763
Most recent candlesticks pattern : N/A
Trend : Sideways
Tenkan-Sen level : 1.1762
Kijun-Sen level : 1.1768
Ichimoku cloud top : 1.1792
Ichimoku cloud bottom : 1.1752
New strategy :
Stand aside
Position : -
Target : -
Stop : -
Despite yesterday’s brief fall to 1.1725, lack of follow through selling on break of previous support at 1.1730 and the subsequent rebound 1.1793 suggest further consolidation would take place and recovery to 1.1800 cannot be ruled out, however, still reckon upside would be limited to 1.1820-25 and price should falter well below resistance at 1.1858, bring further choppy trading later.
On the downside, below said support at 1.1725 would extend the fall from 1.1880 top to 1.1700 and possibly towards indicated previous support at 1.1669 but break of latter level is needed to retain bearishness and extend further subsequent decline to 1.1640-45 first. As near term outlook is still mixed, would be prudent to stand aside in the meantime.

Market Update – Asian Session: Australia CPI Weaker Than Expected
Asia Summary
Asian equity markets opened the session mostly higher. On Tuesday, the Dow rose by 0.7% amid earnings reports from Caterpillar, McDonald’s and 3M. The Nikkei 225 is attempting to have its 17th straight higher close.
Auto components manufacturer, Nidec Corp has gained over 0.5% after raising its FY profit forecasts.
Shares of technology name, Canon Inc, have gained over 1% on better than expected profits, higher guidance and plan to pay a special dividend. Nintendo has gained over 2% ahead of its earnings due on Oct 30th. In South Korea, LG Display has gained over 0.7%, as quarterly net profit and revenues beat consensus expectations.
In the financial sector, Japanese ‘mega banks’ have continued to gain following Sunday’s election results. Mitsubishi UFJ has risen by over 1.5%, while Mizuho Financial has gained over 1%.
Financials in Hong Kong are trading higher, as China’s 10-year government bond yield rose to the highest level since 2014. Shares of rail equipment company Zhuzhou CRRC are gaining, after declining earlier in the week on 9-month financial results. The Hang Seng Property index is also rising, adding on to the gains seen in the prior session.
In the Philippines, miners are trading generally higher amid speculation that the government could end the ban on open-pit mines. Global miners, Rio Tinto and BHP have traded higher on the session. On Tuesday’s session, US copper producers rose after copper traded higher by over 0.6%.
Australian retailers are trading generally lower. Wesfarmers has declined following its Q1 trading update, as the company reported a y/y decline in sales at its Coles unit. Woolworths and Harvey Norman have declined by over 1%, amid the trading update from Wesfarmers and release of Australia’s Q3 CPI data.
Following these inflation figures, the Aussie has declined by over 0.5%, as the data missed market expectations and CPI remained below the lower end of the RBA’s 2-3% inflation target. Amid the CPI data, Australia’s 3-year bond yield has declined on the session, after gaining ahead of the inflation figures.
In the Philippines, the Peso currency has hit lows against the US dollar not seen since 2006. Philippines Sept budget balance data (released on Tuesday) showed a deficit.
Looking ahead, Japanese companies seen reporting earnings later today include Chugai Pharmaceuticals, Daiwa Securities, Fanuc, Hitachi Chemical and Matsui Securities. Taiwanese tech firm UMC may also report its quarterly figures. On Thursday’s session, Australia’s ANZ Bank and South Korean chipmaker Hynix are due to report their respective results.
US companies due to report on Wednesday include Amgen, Boeing, Coca-Cola, Freeport-McMoran, International Paper, Las Vegas Sands and Visa.
Key economic data
(AU) AUSTRALIA Q3 CONSUMER PRICES (CPI) Q/Q: 0.6% V 0.8%E; Y/Y: 1.8% V 2.0%E; TRIMMED MEAN Q/Q: 0.4% V 0.5%E ; Y/Y: 1.8% V 2.0%E
(AU) AUSTRALIA SEPT SKILLED VACANCIES M/M: 0.0% V 0.3% PRIOR
Speakers and Press
Japan
(JP) Japan to consider tax benefits for companies that raise wages - Japanese Media
(JP) Japan said to consider proposing increase in the tobacco tax for fiscal year 2018 - Japanese Press
(JP) PM Abe Cabinet approval ratings rise in Asahi and Yomiuri Polls following recent elections
(JP) Japan Chief Cabinet Sec Suga: To decide on extra budget for typhoon after monitoring
Korea
(KR) South Korea and China Defense Ministers said to have held their first bilateral talks in over two years on the sidelines of a regional security forum - financial press
China/Hong Kong
(CN) China NDRC to begin checking property prices for any 'violations'
Australia/New Zealand
(NZ) New Zealand PM Designate Ardern: Grant Robertson to become Finance Minister
Asian Equity Indices/Futures (00:00ET)
Nikkei +0.2%, Hang Seng +0.7%; Shanghai Composite +0.1%; ASX200 +0.1%, Kospi +0.2%
Equity Futures: S&P500 -0.1%; Nasdaq100 -0.1%, Dax +0.1%; FTSE100 -0.0%
FX ranges/Commodities/Fixed Income (00:00ET)
EUR 1.1770-1.1753; JPY 113.97-113.75; AUD 0.7784-0.7717;NZD 0.6912-0.6881
Dec Gold -0.3% at $1,274/oz; Nov Crude Oil -0.1% at $52.42/brl; Dec Copper -0.3% at $3.19/lb
(CN) PBoC OMO: Injects CNY160B in 7 and 14-day reverse repos v CNY250B injected prior; injects net CNY0B v CNY140B prior
USD/CNY *(CN) PBOC SETS YUAN REFERENCE RATE AT 6.6322 V 6.6268 PRIO
(KR) Bank of Korea (BOK) sells KRW 2.4T v KRW2.4T offered 2-yr monetary stabilization bonds; avg yield 2.04% v 1.85% prior
(CN) China MoF sells 7-yr upsized bonds at 3.7714%, bid-to-cover 2.72x; 3-yr bonds at 3.6%; bid-to-cover 2.0x
Equities notable movers
Australia/New Zealand
FBU.NZ Guides FY18 EBIT for B+I is expected at loss NZ$160M; EBIT ex- B+I NZ$680-720M; names Ross Taylor as CEO, effective Nov 22nd ; -2.1%
WES.AU Reports Q1 Curragh coal production 3Mt v 2.5Mt y/y; Coles Sales A$9.37B v A$9.40B y/y; -2.3%
MSB.AU Teva reportedly seeking buyers for its A$40M Mesoblast stake – press; -11%
Japan
7203.JP Scaling back Mexico plant capacity by 50% and will reduce investment by 30%; -0.4%
6370.JP Raises H1 guidance Net ¥7.4B from ¥5.3B y/y; FY17/18 Net ¥15B from ¥13B; +8.7%
5486.JP Reports H1 Net ¥19.6B v ¥18.3B y/y, Op ¥32.2B v ¥31.0B Rev ¥482.4B v ¥446.1B y/y; -7.6%
China/Hong Kong
973.HK Reports H1 Net Rev €548.2M, +1.1% y/y (cc); -6.5%
Trade Idea : USD/JPY – Buy at 113.40
USD/JPY - 113.78
Most recent candlesticks pattern : N/A
Trend : Near term up
Tenkan-Sen level : 113.86
Kijun-Sen level : 113.67
Ichimoku cloud top : 113.55
Ichimoku cloud bottom : 113.39
Original strategy :
Buy at 113.40, Target: 114.40, Stop: 113.05
Position : -
Target : -
Stop : -
New strategy :
Buy at 113.40, Target: 114.40, Stop: 113.05
Position : -
Target : -
Stop : -
Dollar’s rebound after finding renewed buying interest at 113.24 adds credence to our view that the pullback from 114.10 has ended and break of this level would confirm recent rise from 111.65 has resumed for headway to 114.45-50 (50% projection of 111.65-114.10 measuring from 113.24) but reckon upside would be limited to 114.75-80 (61.8% projection) and 115.00 would hold from here.
In view of this, we are looking to buy dollar again on pullback as 113.30-40 should hold, bring another rise. Below 113.20-24 (50% Fibonacci retracement of 112.30-114.10 and said support) would defer and bring correction to 112.95-00 (61.8% Fibonacci retracement) but reckon 112.60-70 and bring another rise later.

AUD/JPY Candlesticks and Ichimoku Analysis
Weekly
• Last Candlesticks pattern: Shooting star
• Time of formation: 13 Mar 2017
• Trend bias: Down
Daily
• Last Candlesticks pattern: Bearish engulfing pattern
• Time of formation: 16 Feb 2017
• Trend bias: Near term down
AUD/JPY - 88.65
As aussie found support at 87.25 earlier this month and has rebounded, suggesting consolidation above this level would be seen, however, as long as 89.10-20 holds, mild downside bias remains for another retreat, below 87.75-80 would suggest the rebound from 87.25 has ended, bring retest of this level, break there would signal another leg of decline from 90.30 top is underway for weakness towards support at 86.60. Looking ahead, a break below there is needed to add credence to our bearish view, bring retracement of early upmove to 86.30-35 and possibly towards 86.00, having said that, support at 85.70 should remain intact, bring rebound later.
On the upside, whilst initial recovery cannot be ruled out, as long as 89.10-20 holds, prospect of another decline remains. Above said resistance would abort and suggest the first leg of decline from 90.30 top has ended, risk a stronger recovery to 89.65-70 but price should falter below said resistance at 90.30, bring another leg of corrective decline later.
Recommendation: Hold short entered at 88.20 for 86.20 with stop above 89.20

On the weekly chart, aussie found support at 87.25 and has rebounded, however, reckon upside would be limited to 89.10-20 and 89.65-70 should hold, bring another retreat later. Below said support at 87.25 would suggest a temporary top has possibly been formed at 90.30 and consolidation with mild downside bias would be seen for weakness to 86.70-75 and possibly towards support at 85.70, however, only a drop below support at 85.45 would add credence to this view, bring retracement of recent upmove to 84.95-00, then test of 83.75 (previous support level) which is likely to hold and price should stay above support at 82.55-60, bring rebound later.
On the upside, although initial recovery 89.00-10 cannot be ruled out, reckon upside would be limited and 89.65-70 should hold, bring another retreat later. A break above 89.65-70 would signal the pullback from 90.30 has ended, bring retest of this level first. Only a break of this resistance at 90.30 would extend recent upmove to previous resistance at 90.70 and possibly towards 91.50-60 but price should falter below another previous chart resistance at 92.70, bring correction later.

FOMC Preview: No New Signals, While Trump Is Set To Announce New Fed Chair Soon
We expect the Fed to maintain the Fed funds target range at 1.00-1.25% at the upcoming meeting, in line with consensus and market pricing. As it is one of the small meetings, all eyes will be on the statement, as there will be no updated projections and no press conference.
We do not think there will be major changes to the FOMC statement and we think the Fed will reiterate that it is monitoring inflation 'closely'. We think it is likely to mention the fall in employment in September. However, the Fed has already made it clear that it will see through the key figures affected by the hurricanes. The view that the weak labour market numbers are a product of the hurricanes and hence temporary is supported by initial jobless claims, which have come back to their trend level after soaring in September (see chart on the right). A hawkish move would be to mention the surprisingly strong wage growth in September. While this fits with the Fed's conviction that a tighter labour market will eventually lead to wage and hence price growth, the Fed may not want to overemphasise one month of strong wage growth, which could be partly reflective of compositional effects in employment following the hurricanes (mostly low paid workers being laid off without being paid).
Despite low inflation, we still expect the Fed to hike in December (in line with market pricing), as Fed Chair Janet Yellen recently reiterated her faith in the Phillips curve mechanism working its way through to inflation. Therefore, overall, we do not expect any new signals from the Fed at this meeting.
In general, the Fed's willingness to move on with a December hike should continue to support USD crosses near term but we maintain our view that the ECB's willingness to take tapering to the next level should ensure that EUR/USD bottoms out around the current level. For more, see FX Strategy: EUR/USD close to a bottom as ECB smells 'exit' ahead, 10 October.
We currently expect two hikes next year. However, uncertainty about monetary policy next year is particularly high, as the Fed will undergo big changes in terms of voting FOMC members. In particular, it is possible that Yellen will be replaced by either Jerome Powell (currently the most probable successor), John Taylor (less likely than Powell) or Kevin Warsh (least likely) – see table overleaf. Furthermore, Donald Trump has mentioned the possibility of choosing both Powell and Taylor as Fed Chair and Vice Chair combined. Note, though, that it is very hard to say anything conclusive about who Trump is most likely to appoint, as, in our view, he does not seem very interested in monetary policy and has expressed mutually contradictory views about his desired direction of monetary policy. If Powell is elected, he would be likely to maintain the Fed's existing tightening strategy by continuing the gradual hiking cycle. As markets have priced in a more hawkish Fed next year, he would be interpreted as a dovish pick, while Taylor would be interpreted more hawkishly. We do not know when this uncertainty will be resolved. Trump continues to say that he will make an announcement on the next Fed Chair 'very, very soon', while his advisers say a decision in November is more likely.
AUD/USD Candlesticks and Ichimoku Analysis
Weekly
• Last Candlesticks pattern: Long white candlestick
• Time of formation: 10 Jul 2017
• Trend bias: Up
Daily
• Last Candlesticks pattern: Long white candlestick
• Time of formation: 18 Jul 2017
• Trend bias: Up
Aussie met renewed selling interest at 0.7884 late last week and has dropped again since, retaining our bearish view that the rebound from 0.7733 has possibly ended at 0.7897 earlier this month and downside bias remains for a retest of this support, however, break there is needed to confirm the fall from 0.8125 top has resumed for retracement of early upmove to previous resistance at 0.7712, break there would extend weakness to 0.7660-70 and then 0.7620-30 but support at 0.7535-40 should remain intact due to oversold condition.
On the upside, expect recovery to be limited to 0.7810-15 and price should falter below the Tenkan-Sen (now at 0.7834), bring another decline later. Above said resistance at 0.7884 would risk another test of 0.7897 but only break there would signal a temporary low has been formed at 0.7733, bring retracement of the fall from 0.8125 to 0.7970-75, however, still reckon upside would be limited to 0.8000 and price should falter below resistance at 0.8103, bring another decline later.
Recommendation: Hold short entered at 0.7880 for 0.7680 with stop above 0.7850

On the weekly chart, last week’s retreat after meeting resistance at 0.7884 formed a black candlestick, retaining our bearish view that the rebound from 0.7733 has possibly ended at 0.7897, hence consolidation with downside bias remains for weakness to this support, break there would add credence to our view that top has been formed at 0.8125 and extend weakness to 0.7675-80, then possibly to 0.7630-35 (61.8% Fibonacci retracement of 0.7329-0.8125) but reckon support at 0.7535 would hold from here.
On the upside, although recovery to 0.7810-15 cannot be ruled out, reckon 0.7835 (this week’s high) would cap upside and bring another decline to aforesaid downside targets. Only break of said resistance at 0.7897 would risk a stronger rebound to the Tenkan-Sen (now at 0.7929), a weekly close above there would defer and bring further gain to 0.8020-30, however, price should falter below resistance at 0.8103 and bring another decline later. A break of 0.8103 resistance would signal the retreat from 0.8125 top has ended instead, bring retest of this level. Looking ahead, only above there would extend the erratic rise from 0.6827 low to previous resistance at 0.8163, then 0.8200 but loss of upward momentum should limit upside to previous resistance at 0.8295.
