
Sample Category Title
Bloodshed in Commodities Currencies (AUD and CAD) as Trade War 2.0 Starts, More Weakness Ahead or Bullish Reversal on...
- Trade War 2.0 may trigger a stagflation narrative as it involves not only US-China trade but with other major trading partners.
- Commodities currencies may face further headwinds due to deteriorating global economic growth prospects.
- Watch the 0.6330 key medium-term resistance on the AUD/USD and the 1.4300 key medium-term support on the USD/CAD.
On 1 February, US President Trump officially “fired” his flagship trade tariffs policy by imposing 25% tariffs on goods from Canada and Mexico and a 10% levy on products from China via the issuance of executive orders.
While tariffs-related orders have not been executed on European Union exports to the US, Trump has remarked that trade tariffs will “definitely happen” on European goods, which sparked a sell-off in the Euro and European benchmark stock indices today; the EUR/USD tumbled by 1.2% to revisit its recent 13 January swing area of 1.0190 and export-dependent Germany’s DAX shed 1.7%
Trade War 2.0 is different from the US-China Trade War which was enacted in January 2018 in terms of coverage as this time round it involves major trading partners of the US, on top of the ongoing US-China Tech War.
Trade War 2.0 may trigger negative whiplash on commodities currencies
Hence, it may trigger a widespread negative sentiment on global growth prospects, risk of stagflation narrative may be back on the radar of speculative players in the financial markets which in turn creates a negative feedback loop on higher beta commodities related currencies that has a direct correlation to global economic growth such as AUD (base metal proxy such as iron ore), CAD (oil proxy).
Let us do a deep dive into the prospects of the Aussie dollar and Loonie from a technical analysis perspective over a medium-term horizon (multi-month).
AUD/USD negative reaction at 50-day moving average
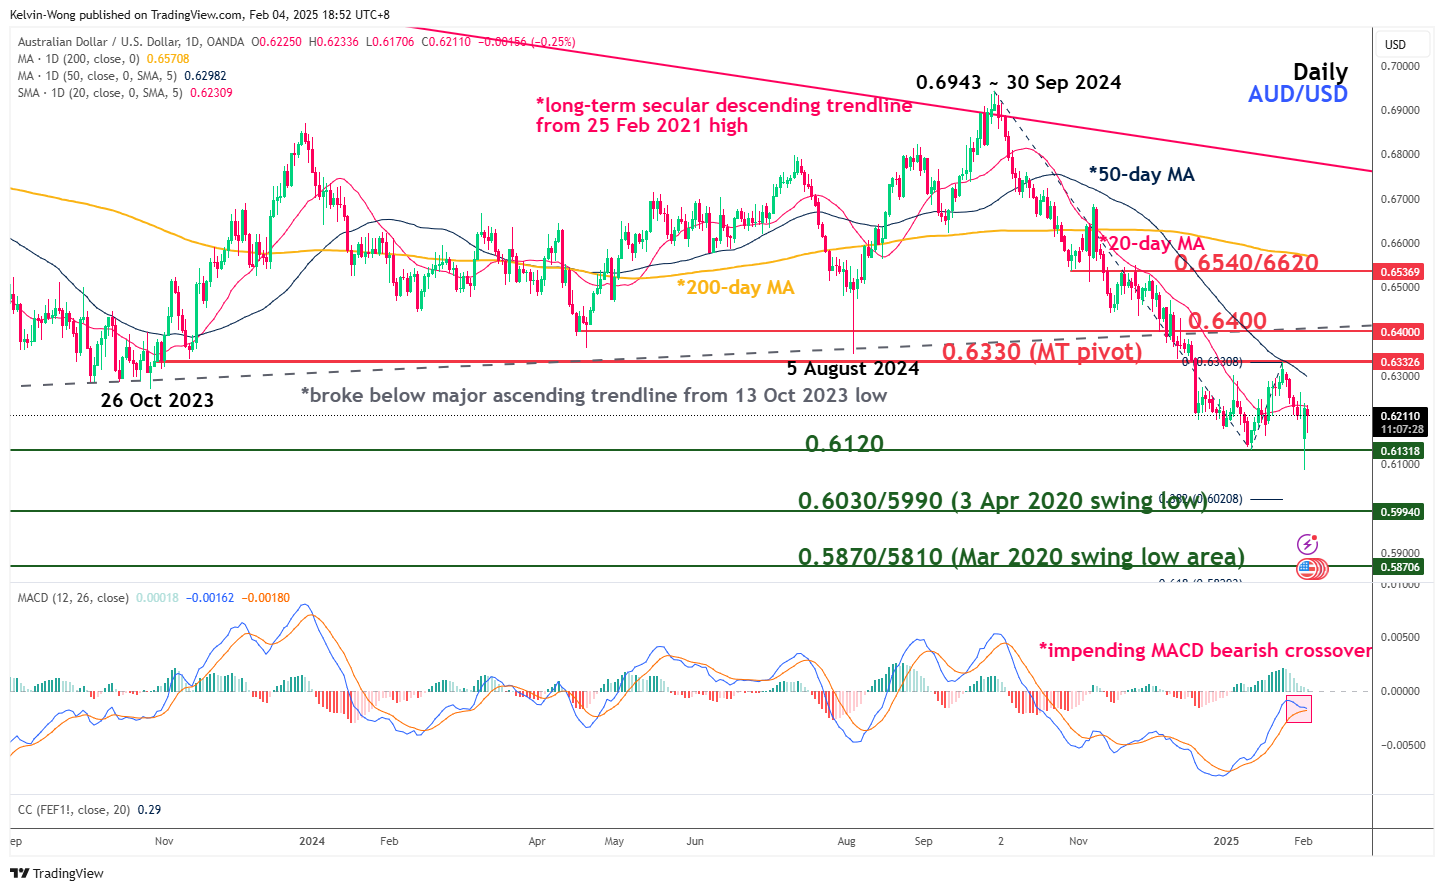
Fig 1: AUD/USD medium-term trend as of 4 Feb 2025 (Source: TradingView, click to enlarge chart)
The recent rebound seen in the AUD/USD from its recent 13 January swing low area has been stalled right at its downward sloping 50-day moving average that has acted as a resistance at around 0.6330 (see Fig 1).
Coupled with an impending bearish crossover condition being flashed out today, 3 February by the daily MACD trend indicator below its centreline suggests that the medium-term downtrend of the AUD/USD in place since its 30 September 2024 swing high of 0.6943 remains intact.
Watch the 0.6330 key medium-term pivotal resistance and a break with a daily close below 0.6120 key near-term support exposes the next medium-term supports of 0.6030/5990 and 0.5870/5810.
On the flip side, a clearance above 0.6330 invalidates the bearish scenario for the next medium-term resistance to come in at 0.6440, and above it sees the long-term pivotal resistance of 0.6540/6620 (also the 200-day moving average).
USD/CAD hit overbought condition but no clear signs of bearish reversal
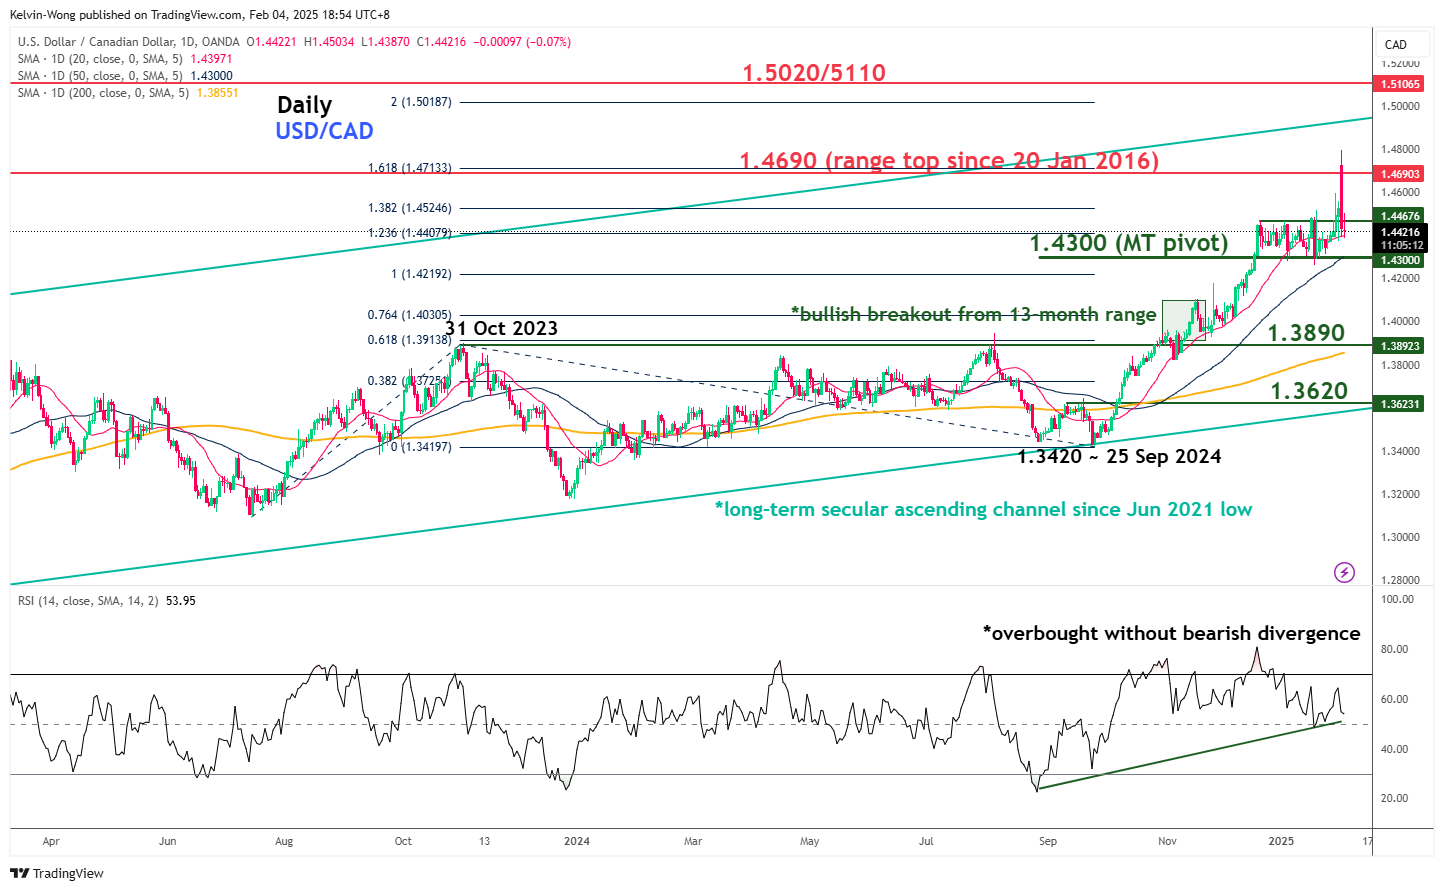
Fig 2: USD/CAD medium-term trend as of 4 Feb 2025 (Source: TradingView, click to enlarge chart)
The price actions of the USD/CAD gapped up today 3 February and right now, it is testing its long-term secular range resistance of 1.4690 which has been in place since 20 January 2016.
The daily RSI momentum indicator has reached its overbought region but has not flashed out any bearish divergence condition which suggests that the USD/CAD may stage a minor pull at this juncture before resuming its impulsive upmove sequence within its current medium-term uptrend in place since 25 September 2024 swing low of 1.3420 (see Fig 2).
Watch the 1.4300 key medium-term pivotal support (also the 50-day moving average) to hold any potential minor pull-backs and a daily close above the 1.4690 key near-term resistance sees the next medium-term resistance coming in at 1.5020/5110 (also the upper boundary of the long-term secular ascending channel from June 2021 low).
However, a breakdown below 1.4300 invalidates the bullish scenario on the USD/CAD for a potential corrective decline sequence to unfold within its major uptrend phase which exposes the next medium-term support at 1.3890 (also the 200-day moving average in the first step).
New Zealand Dollar Eyes NZ Employment
The New Zealand dollar is trading at 0.5608 in the European session, down 0.35% on the day. On Monday, NZD/USD fell as much as 1.2% but managed to recover most of these losses.
New Zealand employment expected to decline
New Zealand releases its employment report on a quarterly basis and we’ll get a look at data for the fourth quarter 2024 later today. The market estimate stands at -0.2% q/q, following a reading of -0.5% in the third quarter. Unemployment has been climbing and is expected to hit 5.1%, up from 4.8% in the third quarter.
The weak labor market is a reflection of a struggling economy. New Zealand GDP fell 1% in the third quarter which marked a second straight quarter of negative growth and means that the economy is in recession.
For the Reserve Bank of New Zealand, the weak economy is an opportunity for the central bank to continue lowering interest rates. The RBNZ meets next on Feb. 19 and is expected to chop rates by 50 basis points, which would bring the cash rate to 3.75%. The RBNZ has been aggresssive in its easing cycle and cut rates by 50 bp at its last meeting in Nov. 2024.
RBNZ policymakers are keeping a close look at US President Trump’s tariffs, which go into effect today against Canada and China. Trump has threatened other countries with tariffs, although New Zealand is off the list. Still, the tariffs could lead to higher inflation and a higher US dollar, which could help New Zealand exports but would hurt households who would face higher prices.
The US releases JOLT Job Openings later today, with a market estimate of 8.09 million for December, compared to 8.00 million in November. The US labor market has been resilient and we’ll get a look at US nonfarm payrolls on Friday.
NZD/USD Technical
- NZD/USD tested support at 0.5595 earlier. Below, there is support at 0.5549
- There is resistance at 0.5674 and 0.5720
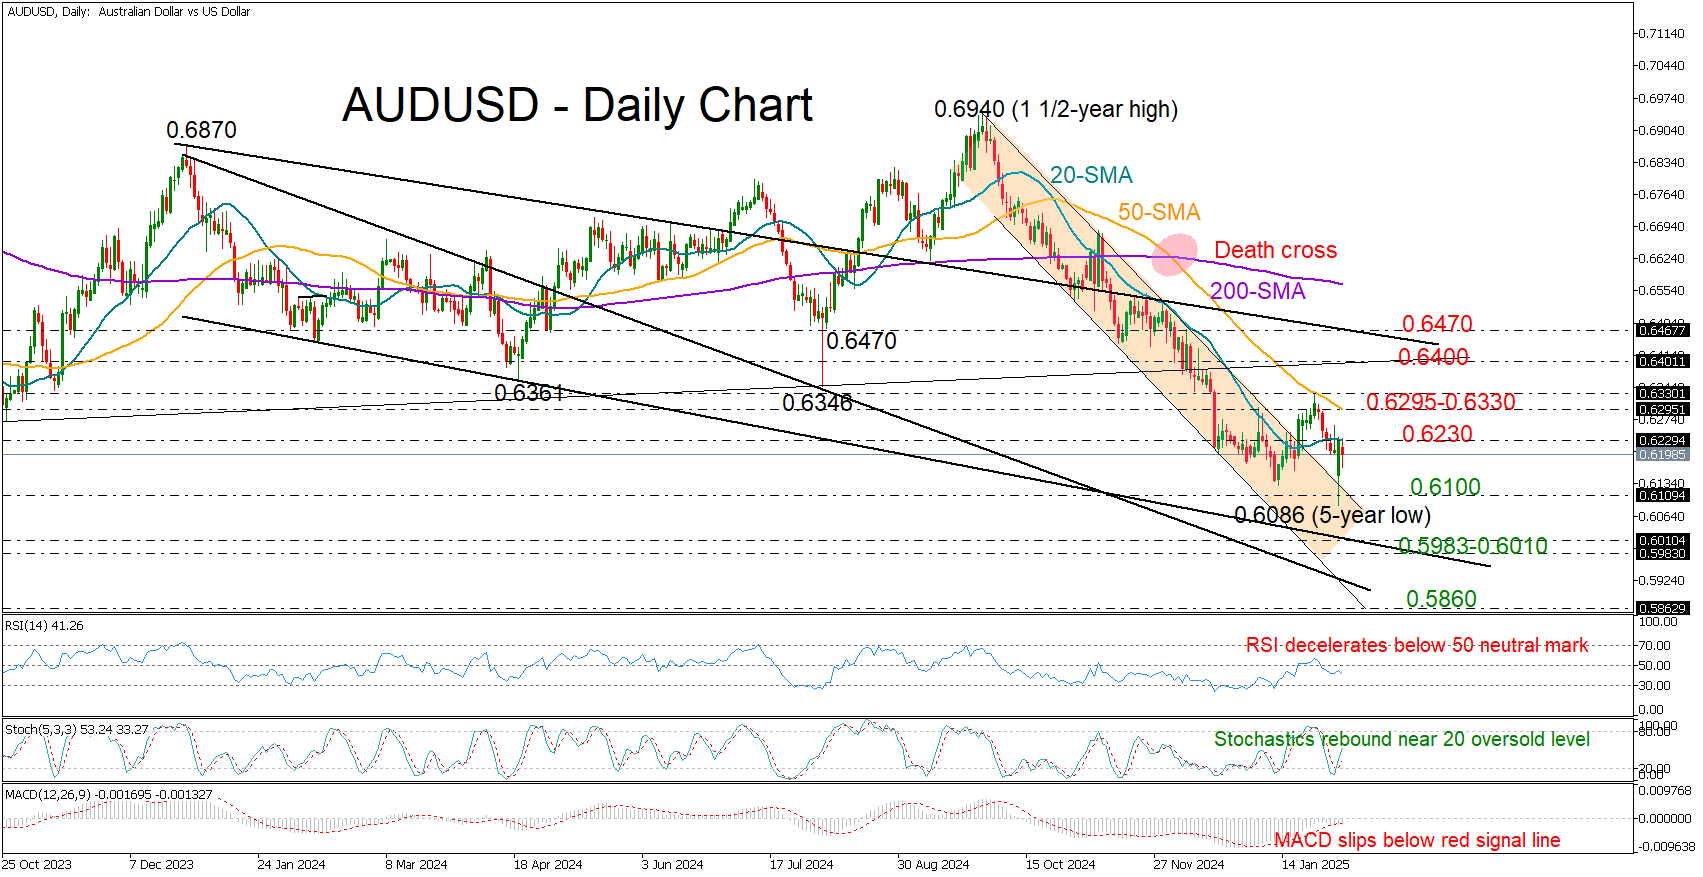
AUD/USD Stagnates as US-China Trade War Begins
- AUD/USD remains below 20-SMA as the US and China exchange tariffs.
- Downside risks persist; buyers eye 0.6330 for a bullish shift.
AUDUSD plummeted to a nearly five-year low of 0.6086 on Monday before bouncing back to the 0.6200 region. The recovery followed last-minute trade talks between the U.S. and its neighbors Mexico and Canada, which resulted in monthly delays.
On the other hand, 10% import tariffs against China went live today, prompting Beijing to retaliate with 15% levies on coal and liquefied gas and 10% tariffs on crude oil, farm equipment, and vehicles. Trade risks kept AUDUSD stagnant below its 20-day simple moving average (SMA) at 0.6230 for the fourth straight session. Markets are also factoring in a 80% probability of an RBA rate cut this month.
Technically, selling pressures could persist as the RSI and MACD keep stretching within the bearish area, casting doubt on the stochastic oscillator's rebound. Hence, the bulls may have to work harder to flag a positive trend reversal above 0.6296-0.6330, where the 50-day SMA sits, with a breakout above 0.6400 signaling stronger upside potential.
If rejection from the 20-day SMA continues, the pair may drift lower to test the 0.6100 mark, with further losses possibly driving it to the critical 0.6000-0.5983 zone. A deeper decline could target the 0.5860 support from March 2020.
In short, while AUDUSD has rebounded from its five-year low, the path forward remains uncertain. A decisive close above 0.6330 could shift the short-term trend back in favor of the bulls.
Gold: Consolidates Under New Record High, Remains Underpinned by Strong Safe Haven Demand
Gold price holds within a narrow consolidation on Tuesday and steadies above $2800, following Monday’s roller coaster, inspired by US tariffs.
Sharp dip was short-lived and followed by quick recovery that pushed the price to new all-time high, suggesting that demand for safe haven metal remains strong.
Traders remain concerned about growing risks as trade war between US and China (after President Trump put implementation of tariffs to Canada and Mexico on hold) is likely to escalate after China announced their list of measures against US companies and goods.
Growing concerns about consequences of negative impact of trade war (instability, supply disruptions, higher inflation, slower economic growth) are likely to keep gold price underpinned.
Repeated daily close above $2800 level to boost initial positive signal and push the price through cracked bull-channel trendline resistance, to validate signal.
Bulls eye targets at $2849 and $2886 (Fibo projections 123.6% and 138.2% respectively) with stronger bullish acceleration to open way towards psychological $3000 barrier.
Broken $2800 level reverted to initial support, followed by $2785 (Jan 24 high) and lower triggers at $2771 (Monday’s spike low / bull-channel trendline support.
Res: 2830; 2849; 2886; 2900.
Sup: 2800; 2785; 2771; 2758.

Crypto Market Rebounds But Faces Uncertain Growth
Market Picture
The cryptocurrency market has added 3.3% in the last 24 hours. The violent recovery from Monday’s kick-off crash has been losing traction for the past few hours. It seems that while the market has not gone into all-out sell-off mode, a reason for sustained buying is hard to find as threats of surprise tariffs persist.
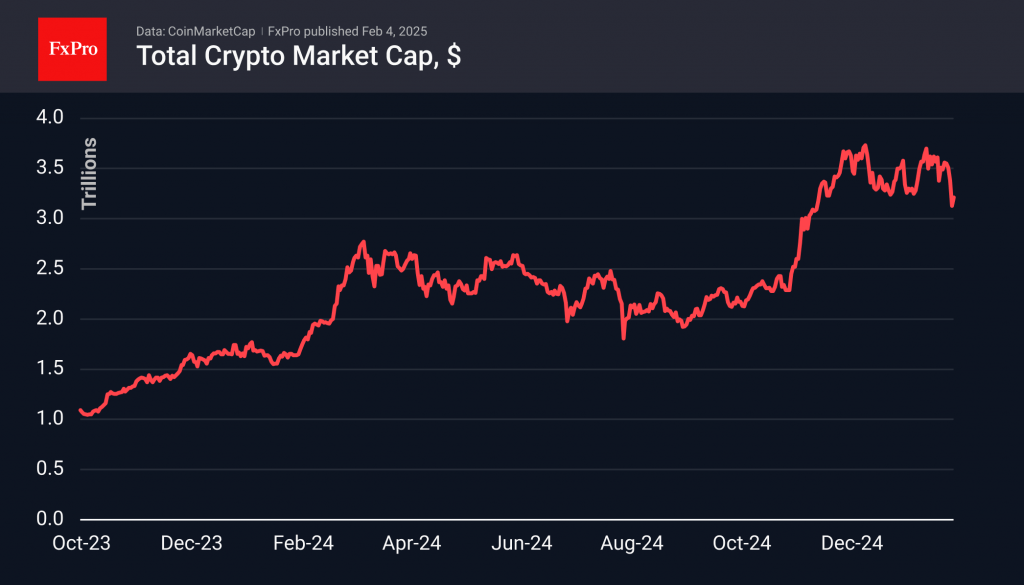
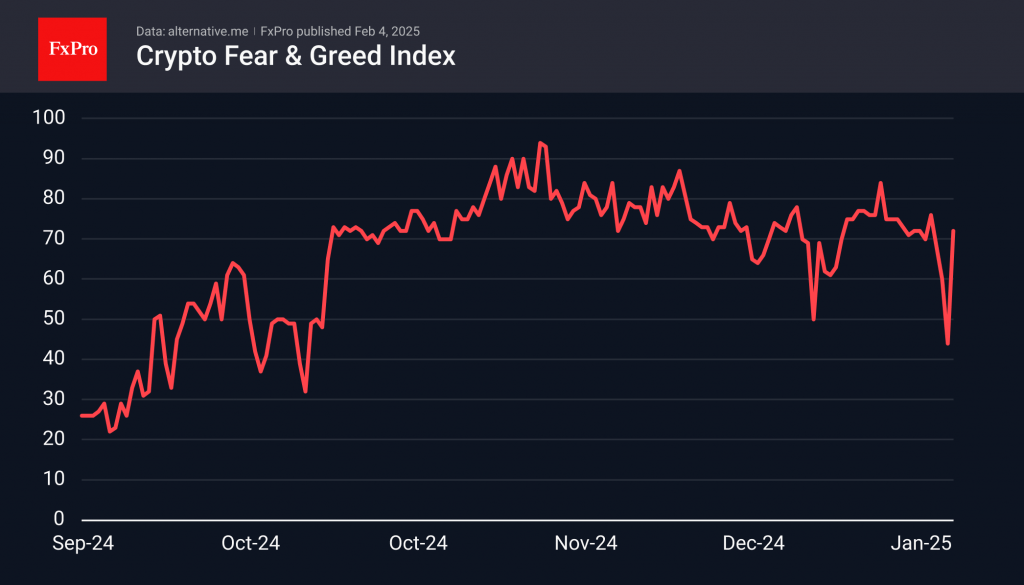
The sentiment index jumped to 72 after diving to 44. This is a quick return to the norm of recent weeks after a sharp fall on Monday.
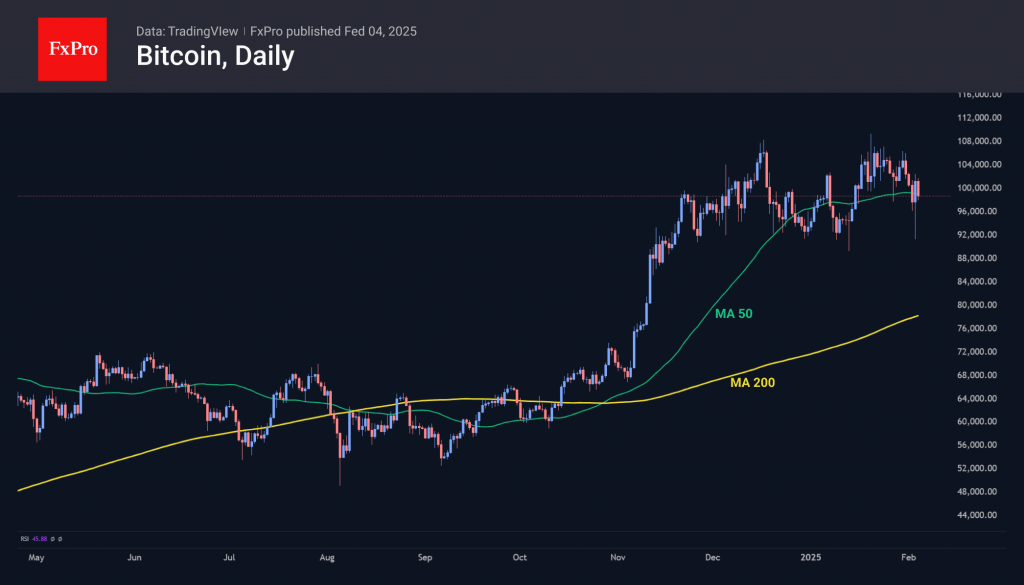
Bitcoin went from $98K to $91K on Monday, then reversed to $102K (Saturday’s level), where again, the sellers took the lead. The departure above the 50-day moving average was an important psychological victory for the bulls, but the fight for it continues.
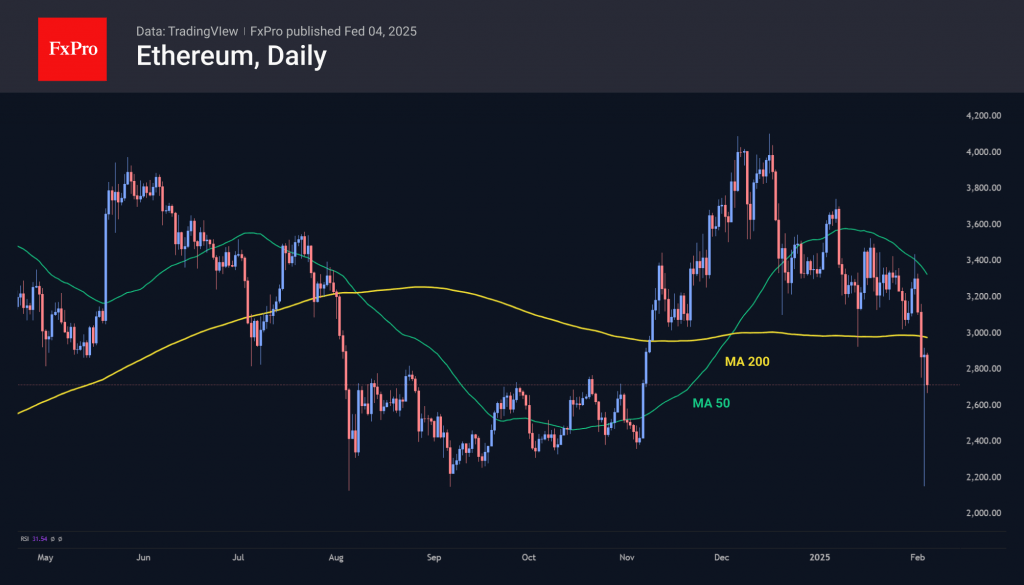
Ethereum is trading near $2700, having fallen under its 200-day moving average and entering the consolidation area from August to October last year. We often view Ethereum as the ‘canary’ of the crypto market, and it’s not feeling great.
News Background
According to CoinGlass, the massive price drop resulted in the largest liquidation in the history of the crypto market – about $2.27bn. ByBit estimates the figure to be significantly higher – at least $8bn. On that exchange alone, daily liquidations reached $2.1bn.
According to CoinShares, global investments in crypto funds last week totalled $527 million. Investments in Bitcoin increased by $486 million, in XRP – by $15 million, in Solana – by $5 million, in Ethereum – it decreased by $0.3 million.
XRP is now the second-best performing altcoin, having received YTD inflows of $105 million.
MicroStrategy paused Bitcoin purchases last week, breaking a streak of 12 weeks of continuous buying. The company holds 471,107 BTC on its balance sheet, purchased at an average price of $64,511 per coin.
On 3 February, the ‘kimchi premium’ on Bitcoin – a measure of overpricing on South Korean cryptocurrency exchanges – hit a three-year high above 11.9%. Normally, the figure does not exceed 5%.
According to Reuters, India is reconsidering its attitude towards digital assets amid a transformation in how they are perceived in other countries.
USD/CNH Chart Sees Spike in Volatility Due to Tariffs
In response to the Trump administration's 10% tariff on Chinese goods, Beijing vowed to challenge the decision at the World Trade Organization.
Moreover, Chinese authorities have:
→ imposed retaliatory tariffs of 15% on US coal and liquefied gas, and 10% tariffs on oil and agricultural machinery;
→ launched an investigation into Google for potential anti-competitive practices.
These recent developments have triggered a spike in volatility for the Chinese yuan against the US dollar. As the USD/CNH chart shows today, the ATR indicator is at its highest level since early November, when Trump celebrated his election victory.
On 9 January, in our analysis of the USD/CNH exchange rate, we noted:
→ the importance of the 7.35 level, which had acted as resistance for several months;
→ according to Wang Tao, chief economist at UBS China, the yuan may weaken to 7.6 per dollar by the end of 2025 if the Trump administration imposes higher tariffs.
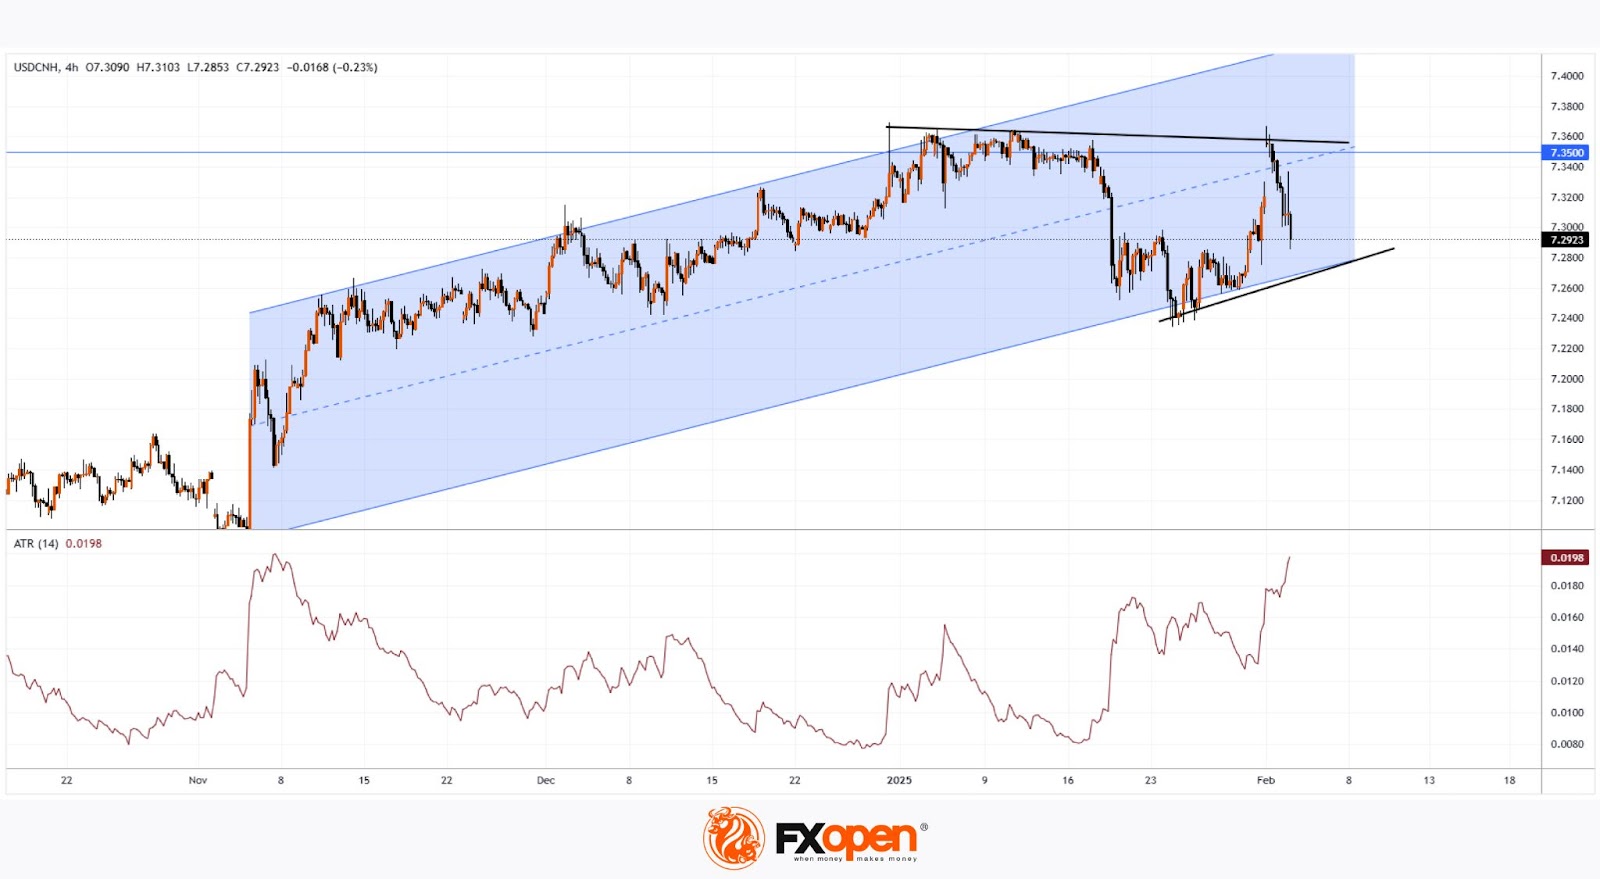
Today's technical analysis of the USD/CNH chart shows:
→ the rate is supported by the lower boundary of an expanded ascending channel (shown in blue);
→ the 7.35 level continues to act as resistance (as indicated by the red arrow).
Thus, at the beginning of February 2025, we may witness the formation of a narrowing triangle (shown by the black lines), and a breakout could lead to a significant trend movement. How realistic this assumption is largely depends on how the ongoing tariff conflict between the US and China develops.
Trade over 50 forex markets 24 hours a day with FXOpen. Take advantage of low commissions, deep liquidity, and spreads from 0.0 pips. Open your FXOpen account now or learn more about trading forex with FXOpen.
This article represents the opinion of the Companies operating under the FXOpen brand only. It is not to be construed as an offer, solicitation, or recommendation with respect to products and services provided by the Companies operating under the FXOpen brand, nor is it to be considered financial advice.
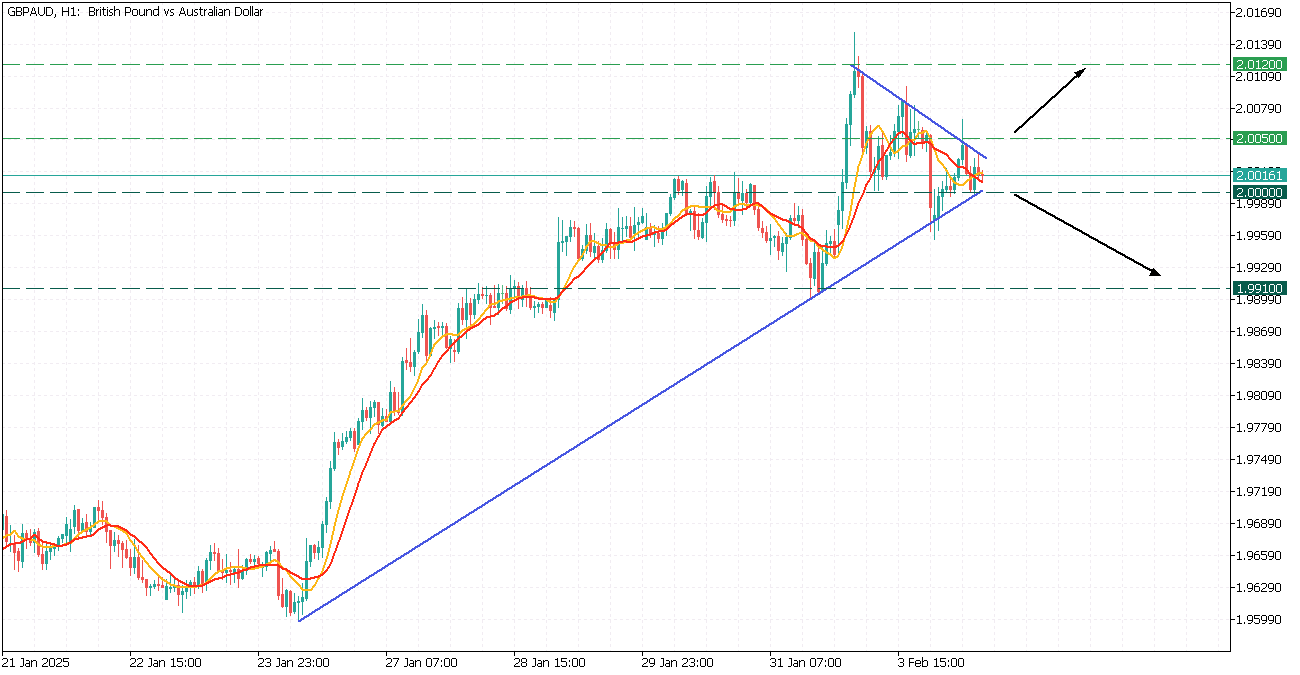
GBPAUD: Symmetrical Triangle
GBPAUD, H1
GBPAUD is navigating in an uptrend, currently forming a symmetrical triangle pattern.
- 9-MA crosses the 14-MA up; however, the price is currently sandwiched between the 2.0050 resistance and 2.0000 support, giving a mixed sentiment.
- If the price breaks above the 2.0050 resistance, it may propel the asset to 2.0120.
However, breaching below the 2.0000 support will trigger a decline toward the 1.9910 level.
Mexico and Canada Dodged US Tariff Bullet at the Very Last Moment
Markets
Mexico and Canada dodged the US tariff bullet at the very last moment. At least for now. Tariffs will be paused for a 30 day period to see whether or not a final deal can be structured with both countries over border control and the fentanyl crisis. Canadian PM Trudeau is pushing through with its C$1.3bn border-control plan announced in December and appointed a “fentanyl czar”. US President Trump was less forgiving towards China where 10% additional tariff takes effect and immediately prompted retaliation. China will levy tax on some products, eg targeting the farming and energy sector while probing Google over alleged anti-trust law breaches. We fear that Trump’s unpredictable reaction function and good-cop, bad-cop approach is hurting risk sentiment more and more with an asymmetric response: selling off on bad news and not completely recovery on positive elements. Today’s trading session could be a point in case. European and US equity futures currently hand in gains (triggered by the after market decision on Canada) for losses after this morning’s escalation with China. The tariff-related volatility is far from over with loudmouthing against the EU undoubtedly to morph into specific (verbal) threats soon. EUR/USD in the same vein rebounded from the low 1.02-area on Monday morning towards 1.0350 (just below Friday’s close), but the pair is being taken back below 1.03 this morning. The US Treasury yield curve bear flattened yesterday with daily yield changes ranging between +5.1 bps (2-yr) to +0.4 bps (30-yr). Markets currently fear upside inflation risks from the tariff treats more than they do downside growth risks. First Fed comments tended to confirm this with the likes of Chicago Fed Goolsbee saying that Trump policies could slow the Fed’s cutting cycle and Atlanta Fed Bostic also inclined to wait a while before a next move. Boston Fed Collins would try to look through the impact of tariffs if inflation expectations stay anchored, but she’s equally not in a hurry to make additional policy rate adjustments. The US manufacturing ISM’s first 50+ reading since October 2022 failed to make it to the headlines, but also strengthens the pause card. Details showed production output rising again (52.5) on the back of a significant rise in new orders (55.1) and new export orders (52.4) with companies going back to hiring (50.3). Manufacturers have been running down their inventories for over two years and seem to become more sensitive to rising demand. On the inflation side, priced paid accelerated from 52.5 to 54.9. Higher-than-expected EMU January CPI (2.5% Y/Y headline and 2.7% Y/Y core) went unnoticed but marks a contrast with yesterday’s Pavlov reaction that US tariffs would be buffered by easier monetary policies outside of the US.
News & Views
French prime minister Bayrou pushed through his 2025 budget bill in parliament yesterday using Article 49.3 to avoid a vote. He did so because his government lacks a majority. Meanwhile France is relying on emergency legislation to avoid a state shutdown until a full annual budget is adopted. Bayrou’s predecessor, Barnier, pulled the same move late last year, triggering a vote of no-confidence that ultimately ended up in a collapse of the minority government. The far-left La France Insoumise in response to Bayrou already said it will table such a motion once again. A vote is likely to happen already today. But unlike Barnier, Bayrou is expected to survive due to some concessions he made to the Socialists including preserving spending for healthcare, education and pensions. In turn, the latter will not support the motion. Bayrou is targeting a smaller fiscal consolidation than his predecessor, with a €50bn saving effort (compared to Barnier €60bn) aimed to reduce the deficit to 5.4% of GDP this year. French OATs outperformed both the periphery and Bunds vs. swap yesterday.
The Bank of International Settlements pressed the likes of the Fed and ECB to revamp the way they approach interest rate setting, more specifically to avoid the mistakes made (of waiting too long to raise rates) in the wake of the pandemic. Outgoing BIS chief Carstens said "The post-pandemic experience calls for rebalancing the frameworks towards the risks posed by inflation surges”. He is more a fan of scenario analyses rather than the current forward guidance approach. Carstens said that while central banks still need to “respond forcefully” when rates are at or near zero if required, they also should use “decisive monetary tightening” when inflation rebounds. The merits of make-up strategies – compensate inflation undershoots with overshoots – should be reconsidered, he added. Both the Fed and ECB are currently conducting a strategic review with the results expected around the middle of the year.
Enjoying the Ride?
Headline hunting about the latest on Trump and his tariff threats is what traders are up to. The news of a month of delay for the tariffs targeting Mexico landed soon after the US opening bell and similar news about Canada came in later in the day. As such, by the end of Monday, both Mexico and Canada managed to talk and agree with Trump to delay the start date for 25% tariffs by a month by sending 10’000 troops to their respective US borders. The saga will continue in a month.
On the European front, nothing more than increased threats and mounting tensions among politicians. Polish PM Donald Tusk called the prospect of a trade war ‘unnecessary and stupid’, the Stoxx 600 recovered most of losses but appetite remains limited. There is one bright spot in Europe however and it’s the Brexited Britain - that could finally benefit from the costy Brexit decision by avoiding a trade war between the EU and the US. Look at sterling shining like a new penny against the euro...
On the Chinese front, Xi and Trump are set to discuss the 10% tariffs this week, but China isn’t waiting to strike back. Beijing has already announced retaliatory measures, including an antitrust probe into Google and a 15% tariff on U.S. coal and LNG imports.
The markets recovered from early losses but futures are in the negative. The US yields were stable on Monday, the 10-year yield fell and rapidly recovered as the US Treasury pulled its estimate for current quarter borrowing lower. The US dollar gave back most of early session gains and the dollar index closed the session lower than where it started. The peso, the Canadian dollar and the euro jumped. Gains in the EURUSD were also backed by a stronger-than-expected CPI reading printed in the eurozone yesterday, that showed that the core inflation on annual basis didn’t ease in January, while both core and headline figures printed negative numbers on a monthly basis. The euro is under a decent selling pressure again this morning.
Anger against the Trump / Musk duo grows by the day. Canadian fans in Ottawa and Toronto loudly booed the American national anthem at NHL and NBA games. Social media exploded with calls to boycott US products, and some Canadians are reportedly looking to sell their winter homes in Florida. More importantly, Canada promised to hit back in ways that could cripple the US car industry, leading to major job losses. Ontario has also threatened to cancel its contract with Starlink. Inside the US, Tesla sales plunged by around 12% in California last year and annual registration for Model 3 sedan dropped by a third. Outside the US, Tesla sold a little more than 1100 cars in France in January – its second biggest EV market in Europe and could expect to do worse if Musk continues to support far-right candidates in critical elections. You see, a typical Tesla buyer is not necessarily a far-right voter. Anyway, Tesla was down 5% yesterday. Beyond Musk and his political ambitions, Tesla relies on Canadian suppliers for key auto components, including aluminum, steel, and batteries, and its new Gigafactory in Nuevo León is expected to produce next-gen EVs. If nothing, Trump’s trade policies are a mathematical disaster for the company. As such, buying Tesla shares for Musk will certainly prove to be an unprofitable trade.
Let’s talk about something else, please
Alphabet is due today after the bell and expectations are strong, with a 12% revenue increase expected and a jump in earnings per share from $1.64 to $2.12 a share. Google Cloud on the other hand is projected to have grown around 32%. But investors are skeptical about any slowdown in growth as they are facing massive AI investments. A company like Google is in the perfect spot to benefit from AI investments given that they have access to a huge amount of data. But investors want to see the AI investments bear fruit to digest a pledge for more investment – especially after DeepSeek awakened the idea of doing things for cheaper price last week. Consequently, the earnings need to be good to counter 1. the AI worries and 2. Trump worries.
AMD is also due to report after earnings today, their cheaper chips could be an alternative to Nvidia’s expensive chips for companies willing to buy performant chips at a lower price. AMD has so far been unable to convince investors to come back despite a more than 60% discount to the share price from last year’s peak levels.
On the economic calendar, the monthly avalanche of US jobs data begins today with job openings data. Any strength in data will further fuel the Fed hawks and help push back the expectation of the next rate cut further down the road. For now, the first rate cut is being priced in for June – the earliest.
US JOLTs Out Today as Tariff Plans Stall
In focus today
Today, the US JOLTs labour turnover data for December will be released. The number of job openings, a key measure of labour demand for the Fed, has stabilised in recent months following a steady decline since 2022. The Fed's Daly and Bostic are scheduled to speak in the evening.
In Sweden, the Minutes from last week's Riksbank meeting will be released at 9:30 CET. The meeting resulted in a unanimous decision to cut rates by 25bp. Despite no dissenters, the Board is divided, where governor Thedéen is in the hawk camp. The Minutes will give interesting insights into their reasoning, including what lies in the assessment that the "forecast for the policy rate made in December essentially holds [...]".
Yesterday, we published a research piece in which we discuss tensions in the Arctic. We think Donald Trump's strong interest towards Greenland is not surprising when you consider the ever-deepening Sino-Russian collaboration, the gradually increasing activity on northern waterways, and the business interests of Trump's inner circle in the Arctic.
New feature from the Danske Bank Global Research team: Personal customers in Denmark, Sweden and Finland now have access to a selection of research articles in Danske Bank's Mobile App. You will find the new feature under Investments.
Economic and market news
What happened overnight
North America and tariffs, just hours before tariffs on Mexico and Canada were set to take effect, Trump agreed to immediately pause the anticipated tariffs for one month with Mexico and Canada, averting a damaging trade war in the region. This comes as Mexico and Canada have agreed to enhance border enforcement to combat drug trafficking. Consequently, market sentiment improved on the headlines from both Mexican, Canadian and US officials.
China and the US, the 10% tariff levied on China is set to take effect today. This morning, China's finance ministry announced a package of tariffs including a 15% tariff on US coal and LNG, and a 10% tariff on crude oil, farm equipment and some autos. These new tariffs are scheduled to take effect on 10 February.
What happened yesterday
In the euro area, HICP inflation increased to 2.5% y/y in January, slightly above expectations (cons: 2.4%, prior: 2.4%). The increase was entirely due to energy inflation while food declined. Core inflation was unchanged at 2.7% (cons: 2.6%, prior: 2.7%). The January inflation print showed the same picture as in the many last months with a continued softer momentum in underlying inflation amid energy prices affecting the headline reading. We also got euro area PMI, which climbed to 46.6 in January, as the manufacturing industry showed some signs of stabilisation, bringing PMI closer to the 50-mark separating growth from contraction.
In France, the French prime minister passed another part of the 2025 budget through parliament without a majority, exposing him to a no-confidence vote on Wednesday. The Socialist Party plans to abstain, and the far-right National Rally previously supported the budget, suggesting the Prime Minister may survive. However, uncertainty remains due to potential defiance from Socialist members and the RN's unconfirmed stance.
In the US, the ISM January manufacturing PMI rose to 50.9 (cons: 49.8, prior: 49.3) showcasing a strong performance and marking the highest reading since September 2022. Increases were observed in production, prices paid, employment and new orders. Especially a strong uptick in order-inventory balances according to both PMI and ISM, which signals positive momentum for manufacturing growth.
In Sweden, the manufacturing PMI for January rose to 52.9 (prior: 52.4), marking the sixth consecutive month in the growth zone, above the 50-mark. This stands out, as France and Germany remained below the 50-mark for January.
Equities: Global equities were lower yesterday by approximately 1%, with cyclicals underperforming defensives. It was a classic risk-off mode following the tariff announcement from Trump. However, please also note the relatively small magnitude of the drop and the rebound following the postponement of tariffs against Mexico and Canada. While the uncertainty persists, we also draw the conclusion that this is more than ever a president who is open to discussion, hence often barking much more than he bites. In the US yesterday, Dow -0.3%, S&P 500 -0.8%, Nasdaq -1.2% and Russell 2000 -1.3%. As Trump is set to speak with China later today on tariffs, hopes are that we will see a softer outcome on tariffs against China. Consequently, Asian markets are rebounding sharply this morning, led by China. US and European futures are marginally higher this morning.
FI: The potential trade war between US and Mexico and Canada has been delayed as the tariffs on both Mexican and Canadian goods have been delayed a month after Mexico promised to send more troops to the border between US and Mexico and Canada would introduce a new government official that will deal with problems on fentanyl (a fentanyl-Czar). This is good news for the bond market.
FX: The best performers among major currencies since Friday is ... MXN, BRL an CAD. Well, that is one way of summarising the recent buzz and heightened volatility following the US tariff news being 'on' and then (for now) 'off'. Yesterday, a deal was struck between the US and Mexico which delays the tariffs for 30 days to give time for negotiations - the MXN rallied on the news after previously being sold off. Late Monday night, a similar deal was stuck between the US and Canada, which was followed by a 1.3% drop in USD/CAD. EUR/USD still hovers around 1.03. EUR/NOK has erased yesterday's losses, now at 11.75. The SEK holds on to gains vs EUR at 11.46. EUR/DKK is stable.