
Sample Category Title
USD/JPY Daily Outlook
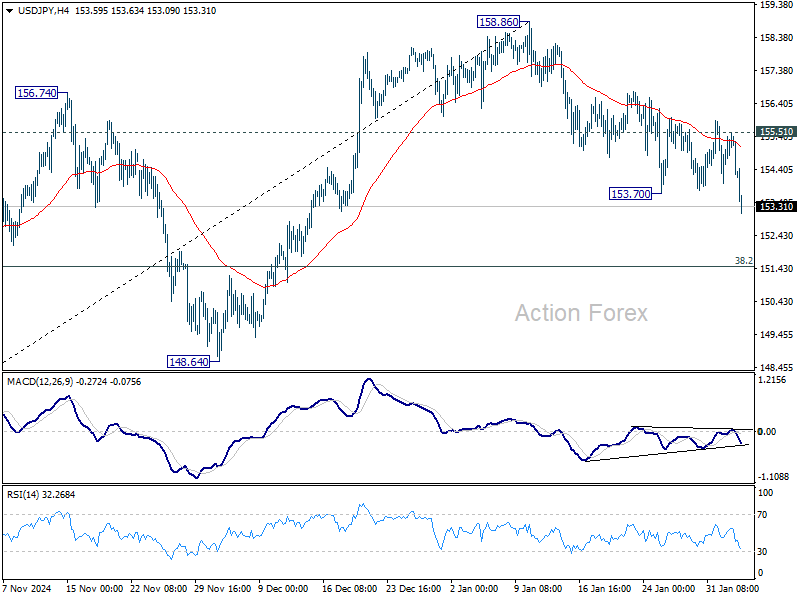
Daily Pivots: (S1) 153.84; (P) 154.68; (R1) 155.18; More...
USD/JPY's fall from 158.86 short term top resumed by breaking through 153.70 and intraday bias is back on the downside. Deeper decline should be seen to 38.2% retracement of 139.57 to 158.86 at 151.49. Strong support could be seen from there to bring rebound. But further fall will remain in favor as long as 155.51 resistance holds, in case of recovery. Sustained break of 151.49 will raise the chance of bearish reversal.
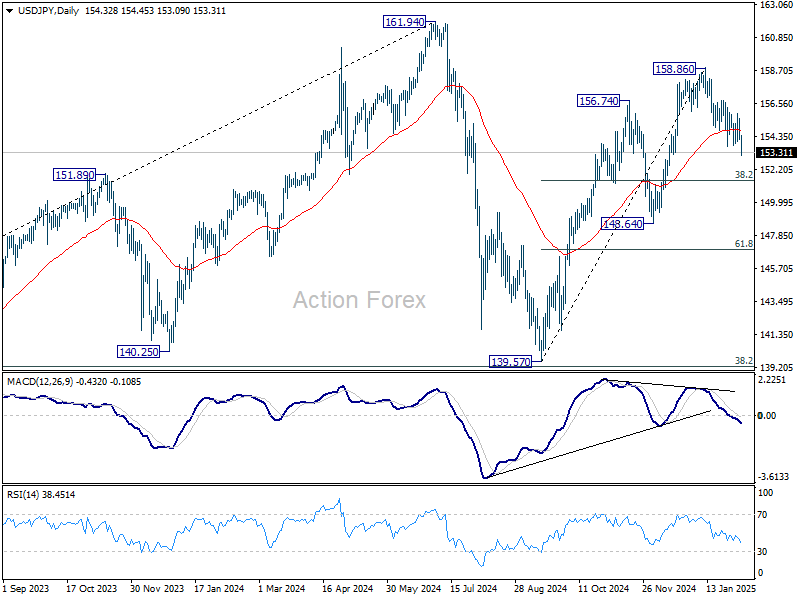
In the bigger picture, price actions from 161.94 are seen as a corrective pattern to rise from 102.58 (2021 low). The range of medium term consolidation should be set between 38.2% retracement of 102.58 to 161.94 at 139.26 and 161.94. Nevertheless, sustained break of 139.26 would open up deeper medium term decline to 61.8% retracement at 125.25.
Yen Rises on Strong Wage Data, Gold Continues March to 3000
Japanese Yen gained significant ground in the Asian session, supported by stronger-than-expected nominal wage growth, which bolstered the likelihood of further BoJ rate hikes. Additionally, continued rise in real wages for the second consecutive month, despite being largely driven by seasonal bonuses, adds to the argument that wage pressures could help sustain inflation near the 2% target.
Supporting this outlook, BoJ monetary affairs director Kazuhiro Masaki told parliament that the central bank is prepared to continue adjusting monetary support and raising rates if underlying inflation progresses toward its 2% target. These remarks reaffirm the expectation that Japan’s interest rate normalization will proceed gradually but steadily this year.
While Yen leads gains in the forex market, overall sentiment is mixed, with trade war concerns temporarily fading into the background. Canadian Dollar is currently the strongest performer this week, followed by Yen and Swiss Franc. Dollar lags behind as the weakest, joined by Euro and New Zealand Dollar. Sterling and Australian Dollar are treading a middle ground .
With trade-related uncertainty easing, attention is now shifting back toward key economic events. US ISM Services PMI is due later today. Tomorrow, BoE is expected to announce a 25bps rate cut, but the MPC voting split and economic projections will be crucial in setting future rate expectations. To close the week, US Non-Farm Payrolls and Canada’s employment report will be in focus on Friday.
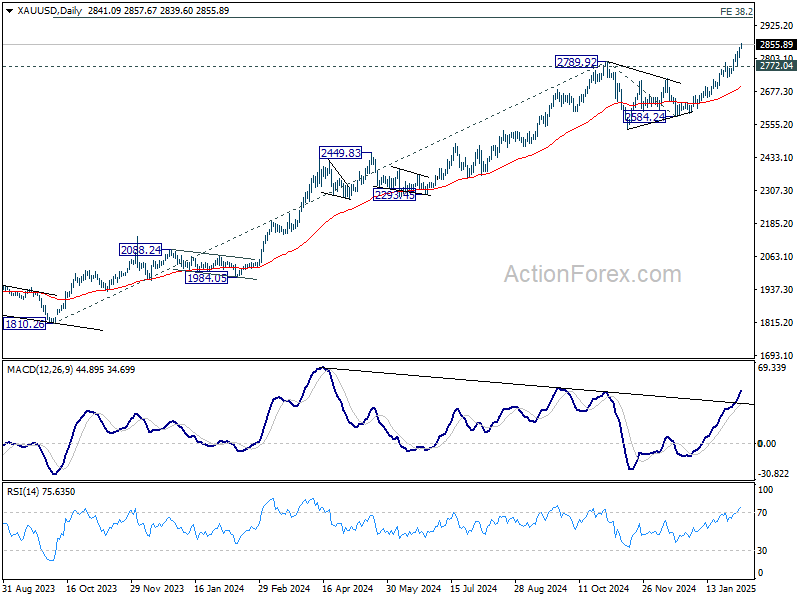
Technically, Gold's record run continues with strong momentum and remains on track to 3000 psychological level, which is close to 38.2% projection of 1810.26 to 2789.92 from 2584.24 at 3074.07. Attention is on whether Gold would lose momentum on overbought condition as it approaches this level. But in any case, outlook will stay bullish as long as 2772.04 support holds.
In Asia, at the time of writing, Nikkei is down -0.10%. Hong Kong HSI is down -0.69%. China Shanghai SSE is down -0.36%. Singapore Strait Times is down -0.14%. Japan 10-year JGB yield is up 0.0191 at 1.295. Overnight, DOW rose 0.30%. S&P 500 rose 0.72%. NASDAQ rose 1.35%. 10-year yield fell -0.030 to 4.513.
Fed’s Jefferson and Daly signal no urgency for rate cuts
Fed Vice Chair Philip Jefferson reaffirmed the cautious approach to policy easing, stating that while a "gradual reduction" in monetary policy restraint towards neutral remains the most likely scenario, there is no urgency to change the current stance.
"I do not think we need to be in a hurry to change our stance," he said in a speech overnght.
He emphasized that policy decisions will continue to be guided by incoming data and the evolving economic outlook, noting that monetary policy is "not on a preset course."
Jefferson outlined a "range of scenarios" for future policy moves. If economic activity remains robust and inflation fails to sustainably decline toward 2% target, Fed could maintain its restrictive stance for longer. Conversely, if the labor market weakens unexpectedly or inflation cools faster than expected, the central bank may need to ease policy at a quicker pace.
Meanwhile, San Francisco Fed President Mary Daly echoed similar sentiments, describing the US economy as "in a very good place." She emphasized that the central bank is in a strong position to "wait and see" before making any policy moves.
Japan’s nominal wage growth surges 4.8% yoy in Dec, real wages rise for second month
Japan’s labor market showed strong wage growth in December, with labor cash earnings surging 4.8% yoy, significantly above expectations of 3.8% yoy and accelerating from 3.9% yoy in the prior month. This marks the 36th consecutive month of annual wage increases.
Regular pay, which includes base salaries, rose 2.7% yoy, while special cash earnings—mainly reflecting winter bonuses—jumped 6.8% yoy, providing an additional boost to workers' disposable income.
Real wages, which adjust for inflation, climbed 0.6% yoy, marking the second straight month of positive growth. This improvement comes despite a notable acceleration in consumer inflation, with the price index used to calculate real wages—excluding rent but including fresh food—rising 4.2% yoy, up from 3.4% yoy in November and reaching the highest level since January 2023.
China’s Caixin PMI services PMI drops to 51.0
China’s Caixin Services PMI slipped to 51.0 in January, down from 52.2 and below expectations of 52.3. PMI Composite also edged lower from 51.4 to 51.1, marking a four-month low, as both manufacturing and services sectors struggled to gain momentum.
According to Caixin Insight Group, while supply and demand conditions showed improvement, services growth lagged behind, pointing to weaker consumer activity.
Wang Zhe, Senior Economist added, "Employment in both sectors fell significantly, and overall price levels remained subdued, particularly factory-gate prices in manufacturing."
New Zealand’s unemployment rate rises to 5.1%
New Zealand’s labor market softened further in Q4, with unemployment rate climbing from 4.8% to 5.1%, in line with expectations and marking the highest level since 2016, excluding the brief spike following the 2020 Covid lockdown.
Employment fell by -0.1% in the quarter, slightly better than the expected -0.2% decline, but still reflecting ongoing weakness in job creation. Meanwhile, wage growth continued to moderate, with the labor cost index rising 0.6% qoq, bringing the annual rate down to 3.3% from 3.8%.
The latest data supports the case for further monetary easing by RBNZ, which remains committed to swiftly bringing the OCR down from the current 4.25% toward neutral level. A 50bps rate cut is still widely anticipated at the upcoming policy meeting this month.
USD/JPY Daily Outlook
Daily Pivots: (S1) 153.84; (P) 154.68; (R1) 155.18; More...
USD/JPY's fall from 158.86 short term top resumed by breaking through 153.70 and intraday bias is back on the downside. Deeper decline should be seen to 38.2% retracement of 139.57 to 158.86 at 151.49. Strong support could be seen from there to bring rebound. But further fall will remain in favor as long as 155.51 resistance holds, in case of recovery. Sustained break of 151.49 will raise the chance of bearish reversal.
In the bigger picture, price actions from 161.94 are seen as a corrective pattern to rise from 102.58 (2021 low). The range of medium term consolidation should be set between 38.2% retracement of 102.58 to 161.94 at 139.26 and 161.94. Nevertheless, sustained break of 139.26 would open up deeper medium term decline to 61.8% retracement at 125.25.
Elliott Wave View: Bitcoin (BTCUSD) Short Term Pullback to Find Support
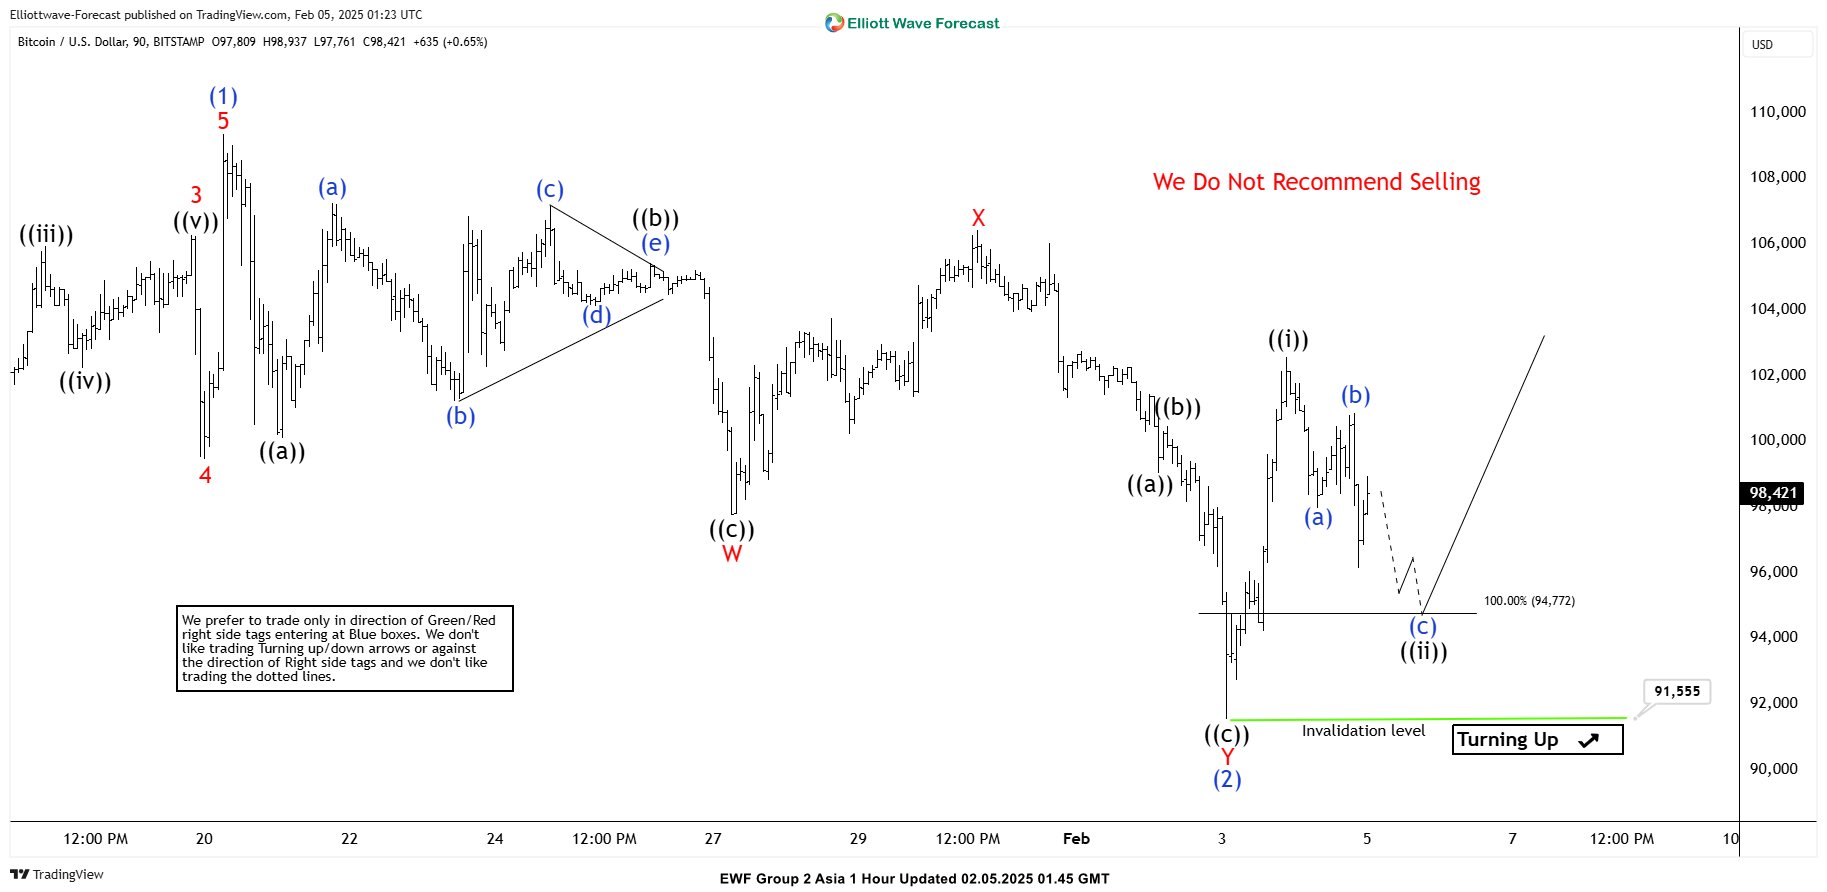
Short Term Elliott Wave View in Bitcoin (BTCUSD) suggests that cycle from Jan 13, 2025 low is in progress as a 5 waves impulse / diagonal. Up from Jan 13, 2025 low, wave (1) ended at 109,356. Wave (2) pullback unfolded as a double three Elliott Wave structure. Down from wave (1), wave ((a)) ended at 100,087 and wave ((b)) ended at 105,424. Wave ((c)) lower ended at 97,750 which completed wave W in higher degree. Wave X ended at 106,447.
The crypto-currency has resumed lower in wave Y. Down from wave X, wave ((a)) ended at 99,038 and wave ((b)) ended at 100,473. Wave ((c)) lower ended at 91,555 which completed wave Y of (2) in higher degree. The instrument has turned higher in wave (3) but it needs to break above wave (1) to rule out any double correction. Up from wave (2), wave ((i)) ended at 102,569. Expect pullback in wave ((ii)) to find support in 3, 7, or 11 swing against 91,555 for further upside.
BTCUSD 90 Minutes Elliott Wave Chart
Bitcoin (BTCUSD) Video
https://www.youtube.com/watch?v=b0Iq9daJvKQ
WTI Crude Oil Prices Drop: Can Bulls Defend Key Support?
Key Highlights
- WTI Crude Oil prices started a fresh decline below the $76.20 support.
- It dipped below a declining channel with support at $72.30 on the 4-hour chart.
- Gold prices extended the surge and broke the $2,825 resistance.
- EUR/USD is attempting to start a fresh increase above the 1.0300 pivot level.
WTI Crude Oil Price Technical Analysis
WTI Crude Oil price started a major decline amid Trump’s trade war. There was a steady decline below the $77.50 and $76.20 levels.
Looking at the 4-hour chart of XTI/USD, the price traded below a declining channel with support at $72.30. There was a close below the $75.00 level, the 100 simple moving average (red, 4-hour), and the 200 simple moving average (green, 4-hour).
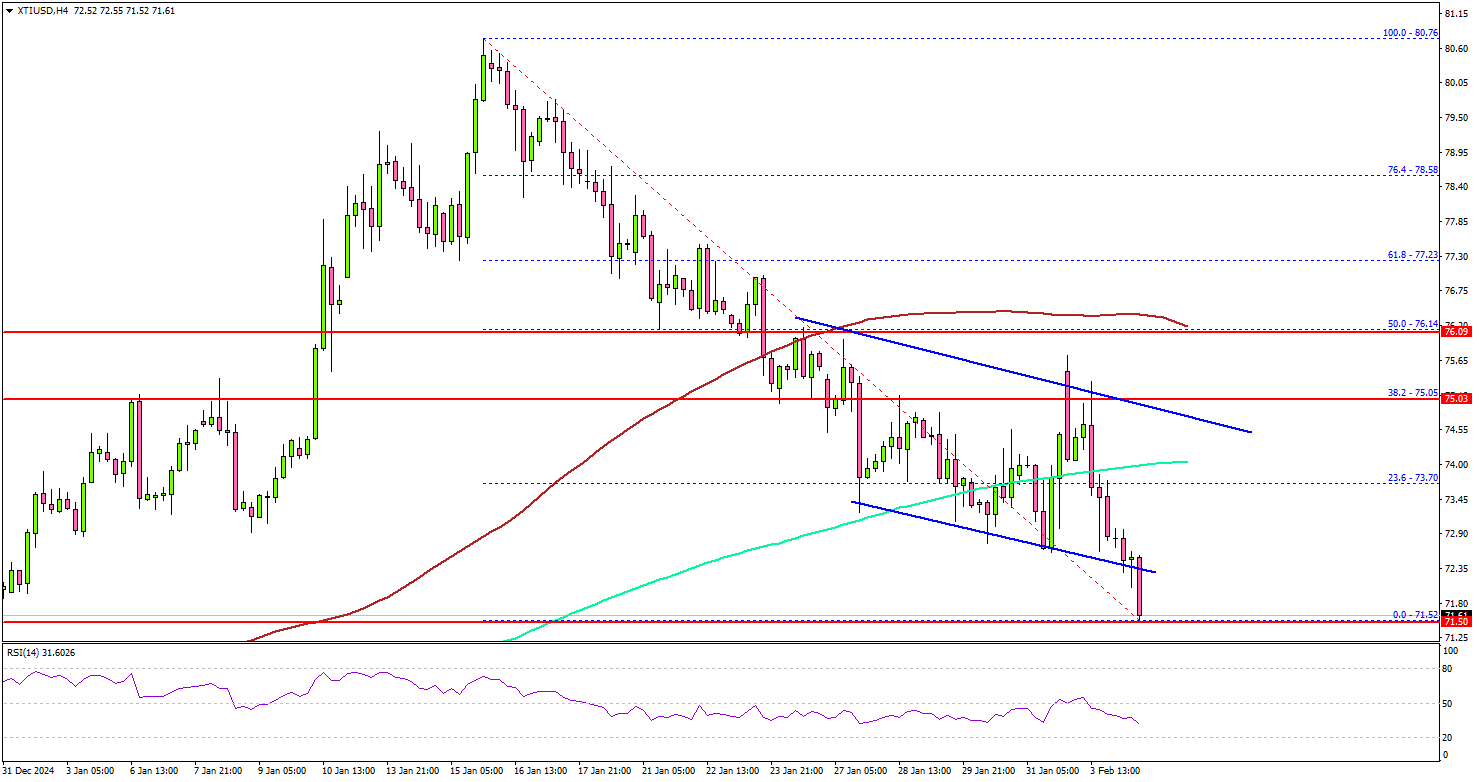
The price even spiked toward the key support at $71.50. If the bulls remain active, the price might recover. On the upside, the price is facing hurdles near the $73.50 level.
The main hurdle is now near the $75.00 zone, above which the price may perhaps accelerate higher. In the stated case, it could even visit the $77.50 resistance. Any more gains might call for a test of the $78.80 resistance zone in the near term.
On the downside, the first major support sits near the $71.50 zone. A daily close below $71.50 could open the doors for a larger decline. The next major support is $68.60. Any more losses might send oil prices toward $65.00 in the coming days.
Looking at Gold, there was a steady increase above the $2,835 level and the price is showing signs of more gains.
Economic Releases to Watch Today
- Euro Zone Services PMI for Jan 2024 – Forecast 51.4, versus 51.4 previous.
- UK Services PMI for Jan 2024 – Forecast 51.2, versus 51.3 previous.
- US Services PMI for Jan 2024 – Forecast 52.8, versus 52.8 previous.
- US ISM Services Index for Jan 2024 – Forecast 54.2, versus 54.1 previous.
China’s Caixin PMI services PMI drops to 51.0
China’s Caixin Services PMI slipped to 51.0 in January, down from 52.2 and below expectations of 52.3. PMI Composite also edged lower from 51.4 to 51.1, marking a four-month low, as both manufacturing and services sectors struggled to gain momentum.
According to Caixin Insight Group, while supply and demand conditions showed improvement, services growth lagged behind, pointing to weaker consumer activity.
Wang Zhe, Senior Economist added, "Employment in both sectors fell significantly, and overall price levels remained subdued, particularly factory-gate prices in manufacturing."
Fed’s Jefferson and Daly signal no urgency for rate cuts
Fed Vice Chair Philip Jefferson reaffirmed the cautious approach to policy easing, stating that while a "gradual reduction" in monetary policy restraint towards neutral remains the most likely scenario, there is no urgency to change the current stance.
"I do not think we need to be in a hurry to change our stance," he said in a speech overnght.
He emphasized that policy decisions will continue to be guided by incoming data and the evolving economic outlook, noting that monetary policy is "not on a preset course."
Jefferson outlined a "range of scenarios" for future policy moves. If economic activity remains robust and inflation fails to sustainably decline toward 2% target, Fed could maintain its restrictive stance for longer. Conversely, if the labor market weakens unexpectedly or inflation cools faster than expected, the central bank may need to ease policy at a quicker pace.
Meanwhile, San Francisco Fed President Mary Daly echoed similar sentiments, describing the US economy as "in a very good place." She emphasized that the central bank is in a strong position to "wait and see" before making any policy moves.
Japan’s nominal wage growth surges 4.8% yoy in Dec, real wages rise for second month
Japan’s labor market showed strong wage growth in December, with labor cash earnings surging 4.8% yoy, significantly above expectations of 3.8% yoy and accelerating from 3.9% yoy in the prior month. This marks the 36th consecutive month of annual wage increases.
Regular pay, which includes base salaries, rose 2.7% yoy, while special cash earnings—mainly reflecting winter bonuses—jumped 6.8% yoy, providing an additional boost to workers' disposable income.
Real wages, which adjust for inflation, climbed 0.6% yoy, marking the second straight month of positive growth. This improvement comes despite a notable acceleration in consumer inflation, with the price index used to calculate real wages—excluding rent but including fresh food—rising 4.2% yoy, up from 3.4% yoy in November and reaching the highest level since January 2023.
New Zealand’s unemployment rate rises to 5.1%
New Zealand’s labor market softened further in Q4, with unemployment rate climbing from 4.8% to 5.1%, in line with expectations and marking the highest level since 2016, excluding the brief spike following the 2020 Covid lockdown.
Employment fell by -0.1% in the quarter, slightly better than the expected -0.2% decline, but still reflecting ongoing weakness in job creation. Meanwhile, wage growth continued to moderate, with the labor cost index rising 0.6% qoq, bringing the annual rate down to 3.3% from 3.8%.
The latest data supports the case for further monetary easing by RBNZ, which remains committed to swiftly bringing the OCR down from the current 4.25% toward neutral level. A 50bps rate cut is still widely anticipated at the upcoming policy meeting this month.
Takeaways of Trump 2.0 Two Weeks In
Summary
A lot has happened since President Trump took office for his second term. In this report, we examine a few of the key takeaways from President Trump's first few weeks in office, including why the European Union could be Trump's next tariff target and why Trump has less leverage over China this time than during the first trade war. Tariffs and associated uncertainties should be consistent with a stronger U.S. dollar, although we acknowledge that “tariff fatigue” may set in and become less supportive of the greenback over time.
“Escalate to negotiate” tactics are still the preferred course of action for President Trump. During the first two weeks of his second administration, President Trump has threatened tariffs and other forms of economic consequences on a number of U.S. trading partners and geopolitical allies. Those nations already being targeted include Canada, Mexico, Colombia and Panama—countries likely singled out due to their heavily reliance on the United States. Trump has seemingly reverted to his negotiation style of exploiting that reliance on the U.S. to seek concessions on perceived issues related to immigration, trade imbalances, cross border flow of narcotics (Canada, Mexico, Colombia and China) and geopolitical alignment (Panama). In approaching discussions with each nation, Trump has escalated threats meaningfully—particularly tariff threats but also expropriation—as a platform for negotiations. Trump has indeed secured concessions from all of these nations, and while “a deal” may not be finalized with any country just yet, drawing from President Trump's first term would suggest de-escalation is a plausible next step, at least in the very near term. To that point, we believe, for now, the U.S. administration will not impose direct tariffs on Canada, Mexico or Colombia after recent arrangements. In the case of Panama, secured concessions are also likely to shift Trump's focus away from the Panama Canal for the time being, but possibly longer-term if Panamanian authorities pursue additional appeasements to the U.S. government.
Expect a similar escalate-style approach to discussions with the European Union. President Trump has consistently referred to the high likelihood that the European Union will be targeted for tariffs. In our view, now that tariff decisions on Canada, Mexico and China have been made, despite those decisions perhaps being short-term in nature, Trump is now likely to direct focus toward the EU. With that said, Trump may suggest a lower tariff rate relative to the tariffs proposed on other U.S. trading partners, but ultimately with the intention of seeking concessions from EU countries. In our view, one area Trump might focus on is getting EU countries to increase their defense spending commitments in the context of the stipulations of the joint NATO defense pact. In the scope of concessions, defense spending may be the easiest to achieve as countries can make those budget decisions on their own as opposed to at the EU level. To that point, Trump may also use tariffs as means to seek access to EU markets—for example, related to agriculture products—while Trump has also called on Europe to buy more oil and gas from the United States. However, those “wins” may be more challenging as the EU as an economic bloc regulates market access, not individual countries, while purchases of oil and gas will also largely reflect the decisions of private sector rather than government entities. Achieving concession on market access or achieving purchase targets may be tricky.
Trump's “negotiate from a position of power” approach may not work as well on China this time. Yes, China has plenty of economic vulnerabilities that could be exploited, most relevant of which to the U.S. is China's export driven economic model. But the U.S.-China trade relationship is significantly weaker today relative to Trump's first term. The U.S. imports significantly fewer goods relative to 2017, while China has found replacement trade partners intra-Asia and has set up manufacturing capabilities in Mexico to circumvent tariffs. U.S. tariff influence may not be as powerful, as China has made some necessary adjustments. In fact, an argument can be made the U.S. has become more dependent on China as a source of critical imports. Maybe a greater U.S. dependency on China is why Trump implemented softer tariffs relative to the tariffs proposed on Canada, Mexico and Colombia. And maybe why China opted for a more strategic and targeted retaliation rather than matching U.S. tariffs dollar for dollar. China may not want a trade war, but in our view, China is also unlikely to back down from one. Lastly, a question we have been asking ourselves is: what concessions can China even offer the United States? Buy more U.S. products. But if China has developed new trade relationships, is turning more inward looking, and possibly at the point where authorities' deploy large fiscal stimulus, what incentive does China have to make a new trade deal with the United States?
Dynamics surrounding further U.S. dollar strength remain in place...although we expect a fair amount of volatility along the way. Further tariff threats are likely to induce market participants to seek out safe haven currencies, in particular the U.S. dollar. As far as threats, as mentioned, we believe Trump will target the EU next, which may unsettle market participants' sentiment toward risk assets. We also think the Trump administration will pursue a universal tariff as well as further tariffs on China. Combined with threats directed toward the European Union, a universal tariff and sharply higher tariff rates on China should prompt investors to continue directing capital toward the U.S. dollar. However, —and this is where Trump's negotiation strategies come into play for FX markets—if Trump continues to make deals with foreign nations to delay or avoid tariffs, the U.S. dollar could also experience episodes of weakness as markets experience a relief rally. We observed sharp dollar depreciation as tariffs on Mexico and Canada were delayed, while only modest levies on China and soft retaliation also prompted dollar weakness. We are also cognizant of the markets' ability to become fatigued with tariffs. Meaning constant tariff threats, especially on countries with little influence over global financial markets or the global economy, could be ignored by market participants, especially if threats do not yield any trade policy changes. Should a tariff fatigue set in, the dollar would be driven by more economic fundamentals (i.e., central bank monetary policy, etc.) rather than headlines. Essentially, a tariff fatigue scenario by itself is neutral for the dollar, but market participants would seek alternative catalysts for FX markets.
First Impressions: NZ Labour Market Statistics, December Quarter 2024
The unemployment rate rose to 5.1% in the December 2024 quarter, in line with market expectations. Wage growth is moderating broadly as expected.
- Unemployment rate: 5.1% (prev: 4.8%, Westpac f/c: 5.0%, RBNZ f/c 5.1%)
- Employment change: -0.1% (prev: -0.6%, Westpac f/c: -0.2%, RBNZ f/c -0.3%)
- Labour costs (private sector): +0.6% (prev: +0.6%, Westpac f/c: +0.6%, RBNZ f/c +0.5%)
- Average hourly earnings (private sector, ordinary time): +1.3% (prev: +1.2%)
New Zealand’s labour market continued its steady softening at the end of last year. The unemployment rate rose from 4.8% to 5.1% in the December quarter, the highest level since 2016 (other than a brief spike after the 2020 Covid lockdown). Wage growth in turn has continued to moderate, though it remains higher than pre-Covid levels.
The results were broadly in line with market expectations, and with the Reserve Bank’s forecasts in its November Monetary Policy Statement. Some of the details were marginally stronger than the RBNZ had assumed, none of this is likely to be persuasive; the RBNZ has already stated that the base case for its policy review later this month will be a 50bp OCR cut, unless there was conclusive evidence otherwise.
The number of people employed fell by 0.1% for the quarter. This was actually slightly better than we expected based on the Monthly Employment Indicator and was backed by the various employment measures in the Quarterly Employment Survey (QES) which were at or close to flat. There were modest downward revisions in earlier quarters, however, leaving employment down 1.1%y/y – a fraction weaker than the RBNZ’s forecast.
The fall in employment was partially offset by a slight drop in the participation rate to 71.0% (from a downwardly revised 71.1% in the September quarter). As we’ve noted previously, youth participation in particular has dropped off markedly in the last year or so, having risen sharply during the period of labour shortages in 2021-22.
The rise in the unemployment rate reflects the fact that while the level of unemployment has more or less flattened out, the working-age population has continued to grow in the meantime (up 0.4% for the quarter and 1.4% over the last year). Even with the economy expected to pick up over 2025, we think it will be towards the end of this year before we see jobs growth outstripping population growth.
Turning to wages, the Labour Cost Index (LCI) rose by 0.6% for the private sector, in line with our forecast. The public sector was more subdued than in previous quarters with a 0.5% increase. (There was a 3.9% pay increase for schoolteachers in December, but as we noted, the timing of the LCI survey meant that it may not be recorded until next quarter.)
The unadjusted analytical LCI, which strips out pay increases that are related to higher productivity, rose by 0.9% for the quarter. That took the annual growth rate down from 4.9% to 4.2%, its lowest since December 2021. Fewer roles have seen pay increases over the last year, and the average size of those increases has moderated.