
Sample Category Title
Gold: Stagflation Fears Supporting Fresh New All-Time Highs
- 5-year and 10-year US breakeven inflation rates have just staged a major bullish breakout from a two-year plus of basing formation.
- Trade War 2.0 involves the US and other major trading partners that may disrupt international trade and dampen global economic growth.
- The resurgence of stagflation risk has triggered bullish movements on Gold (XAU/USD).
- Watch the US$2,716 key medium-term support on Gold (XAU/USD).
The recent three weeks of sideways movements of the US Dollar Index since its 52-week high of 110.18 printed on 13 January had a positive knock-on effect on gold prices.
Gold (XAU/USD) has staged a bullish breakout from its prior two-month range configuration on 21 January and rocketed by 4.4% to print a fresh intraday current all-time high of US$2,865 at this time of the writing.
Global trade tensions have triggered stagflation fears
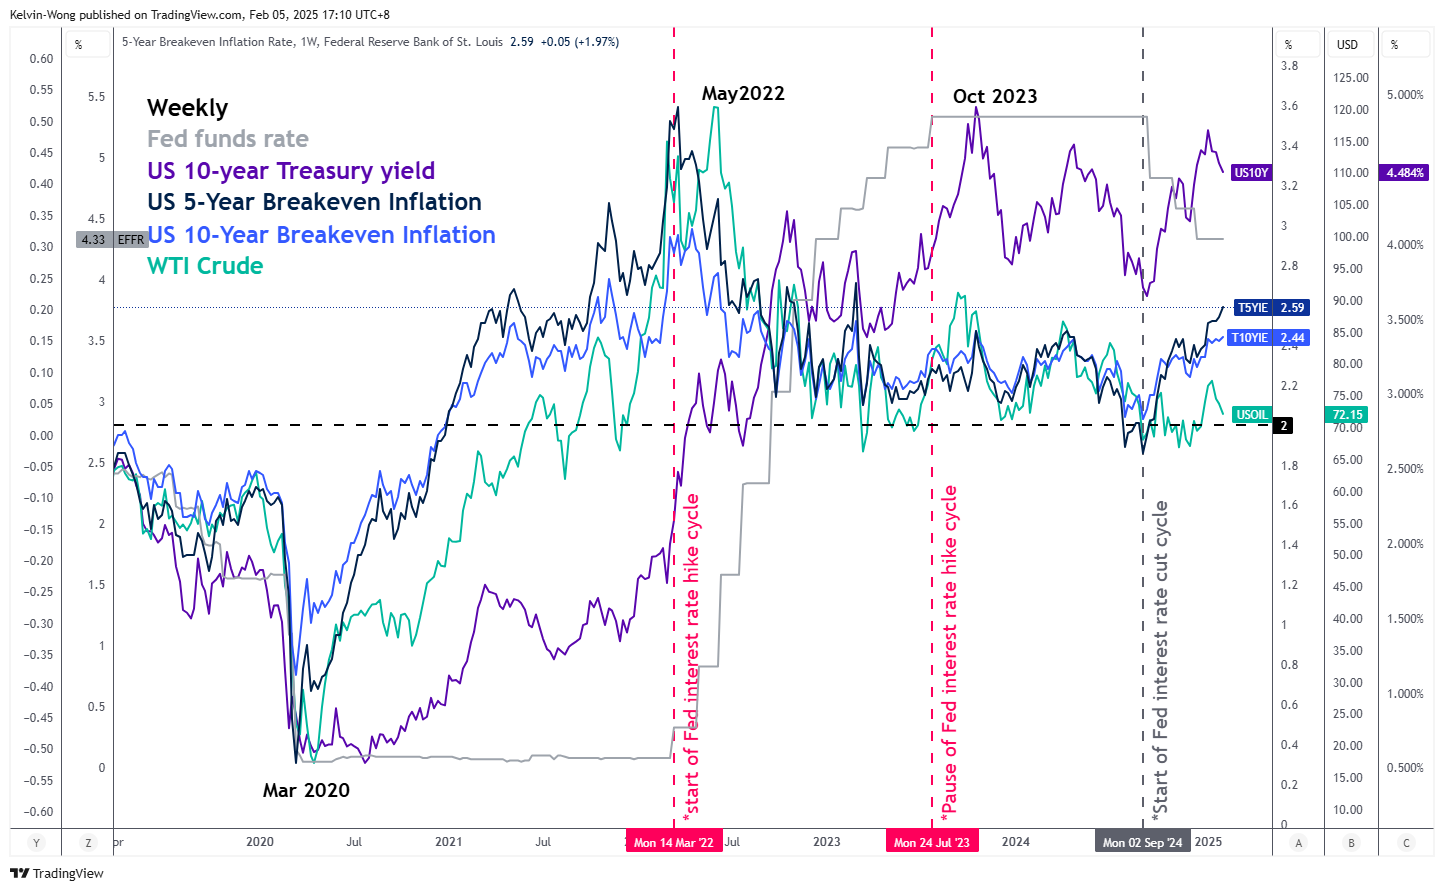
Fig 1: 5-year & 10-year US breakeven inflation rates major trends as of 4 Feb 2024 (Source: TradingView, click to enlarge chart)
US President Trump kickstarted Trade War 2.0 on Saturday, 1 February ordered sweeping tariffs on goods from Canada, Mexico, and China.
Even though the 25% trade tariffs on Canada and Mexico have been delayed for a month, the10% tariffs targeted on Chinese goods are now “lived” and Chinese policymakers have retaliated by imposing 10% to 15% levies on US energy and agricultural exports to China with a targeted kick-in deadline on next Monday, 10 February.
In addition, China has also drawn up plans to disrupt key mineral supply chains in the US and curb business operations of US companies on the mainland. Google has been singled out for antitrust violations, and new export control orders have been issued on tungsten and other critical minerals used in electronic, aviation, and defence industries.
Trade War 2.0 is different from the US-China Trade War 1.0 enacted in January 2018 in terms of coverage as this time round it involves major trading partners of the US, on top of the ongoing US-China Tech War.
Hence, countries that have a significant trade surplus with the US will be at risk of being targeted by Trump’s trade tariffs policy; the European Union, Japan, South Korea, and ASEAN export-dependent countries such as Vietnam, and Malaysia.
If trade negotiations are not able to reach the “middle ground” between the US and the targeted countries, tit-for-tat retaliation measures may escalate, and global trade is likely to be disrupted which in turn can cripple global growth prospects and ignite inflationary pressures.
Market-transacted financial instruments have started to price in a further uptick in US inflationary expectations as derived from the movements of both the 5-year and 10-year US breakeven inflation rates that have been trending upwards since the start of the current Fed’s interest rate cut cycle on September 2024.
Both the 5-year and 10-year US breakeven inflation rates have just staged a major bullish breakout from a two-year plus of basing formation to rally towards 2.59% and 2.44% respectively as of 4 February 2025, above the Fed’s long-term inflation target of 2% (see Fig 1).
These observations suggest the odds of a stagflation environment have increased.
Medium-term bullish momentum remains intact for Gold
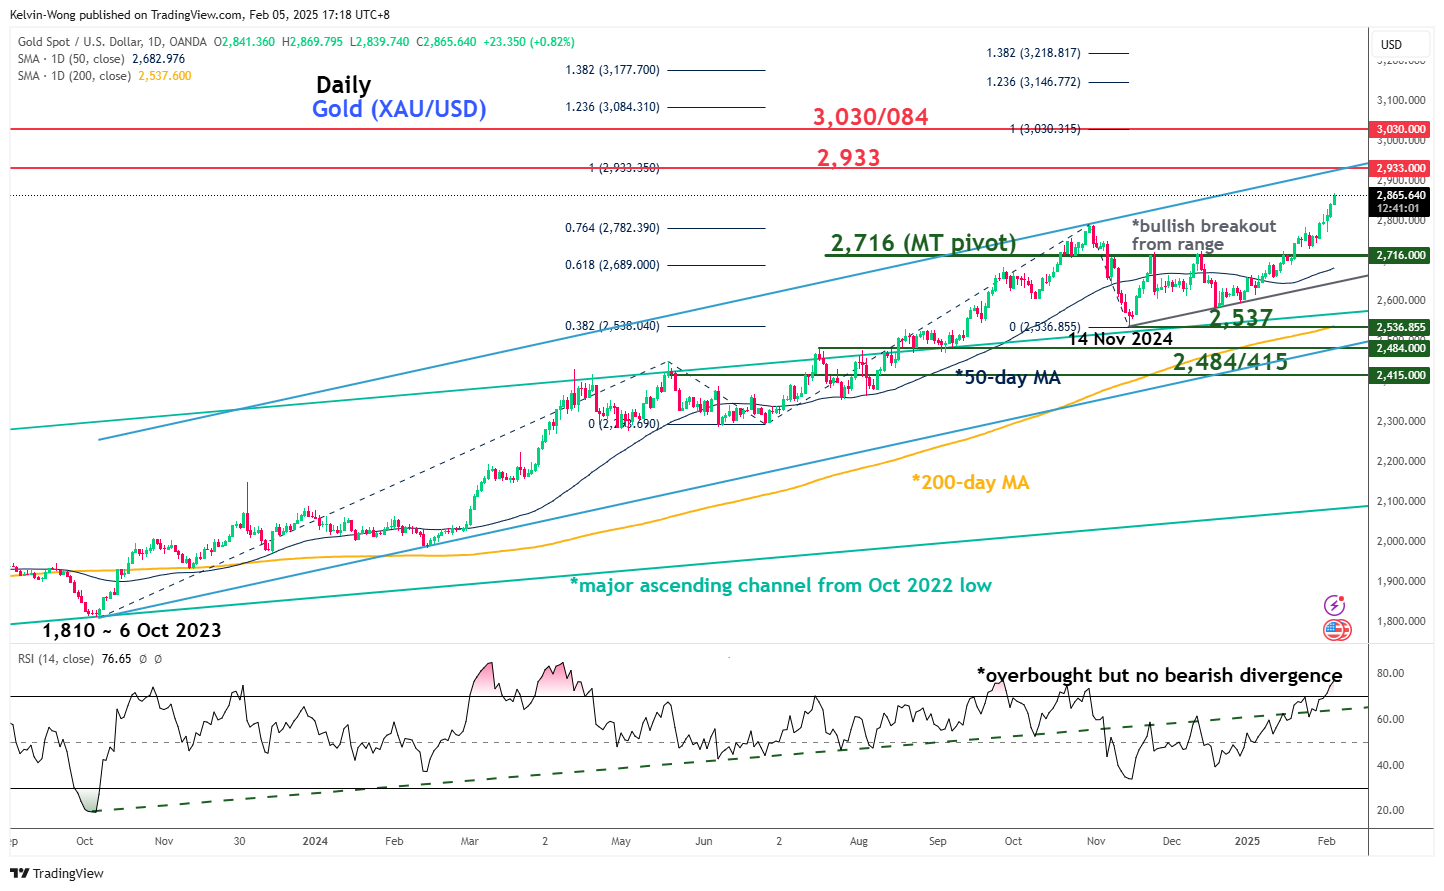
Fig 2: Gold (XAU/USD) medium-term & major trends as of 5 Feb 2025 (Source: TradingView, click to enlarge chart)
Key technical elements of Gold (XAU/USD) have remained constructive for the continuation of its impulsive upmove sequence within its ongoing medium-term (multiweek) and major (multi-month) uptrend phases.
The daily RSI momentum oscillator has reached an overbought region, but it has not flashed out any bearish divergence condition which suggests that the price actions of Gold (XAU/USD) may stage a minor pull-back after its recent swift rally in the past week rather than a medium-term bearish reversal movement.
Watch the US$2,716 key medium-term pivotal support (also the 50-day moving average) with the next medium-term resistances coming in at US$2,933 and US$3,033/3,084 (see Fig 2).
On the other hand, a break below US$2,716 invalidates the bullish scenario for Gold (XAU/USD) to kickstart a potential multi-week corrective decline within its major uptrend phase to expose the next medium-term support at US$2,537 (also the 200-day moving average).
WTI Oil Futures Pivot Within 70 Area
- WTI Oil futures turn higher after reaching 70 zone.
- Technical signals reflect persisting caution.
- Bullish outlook could emerge above 74.00-74.88.
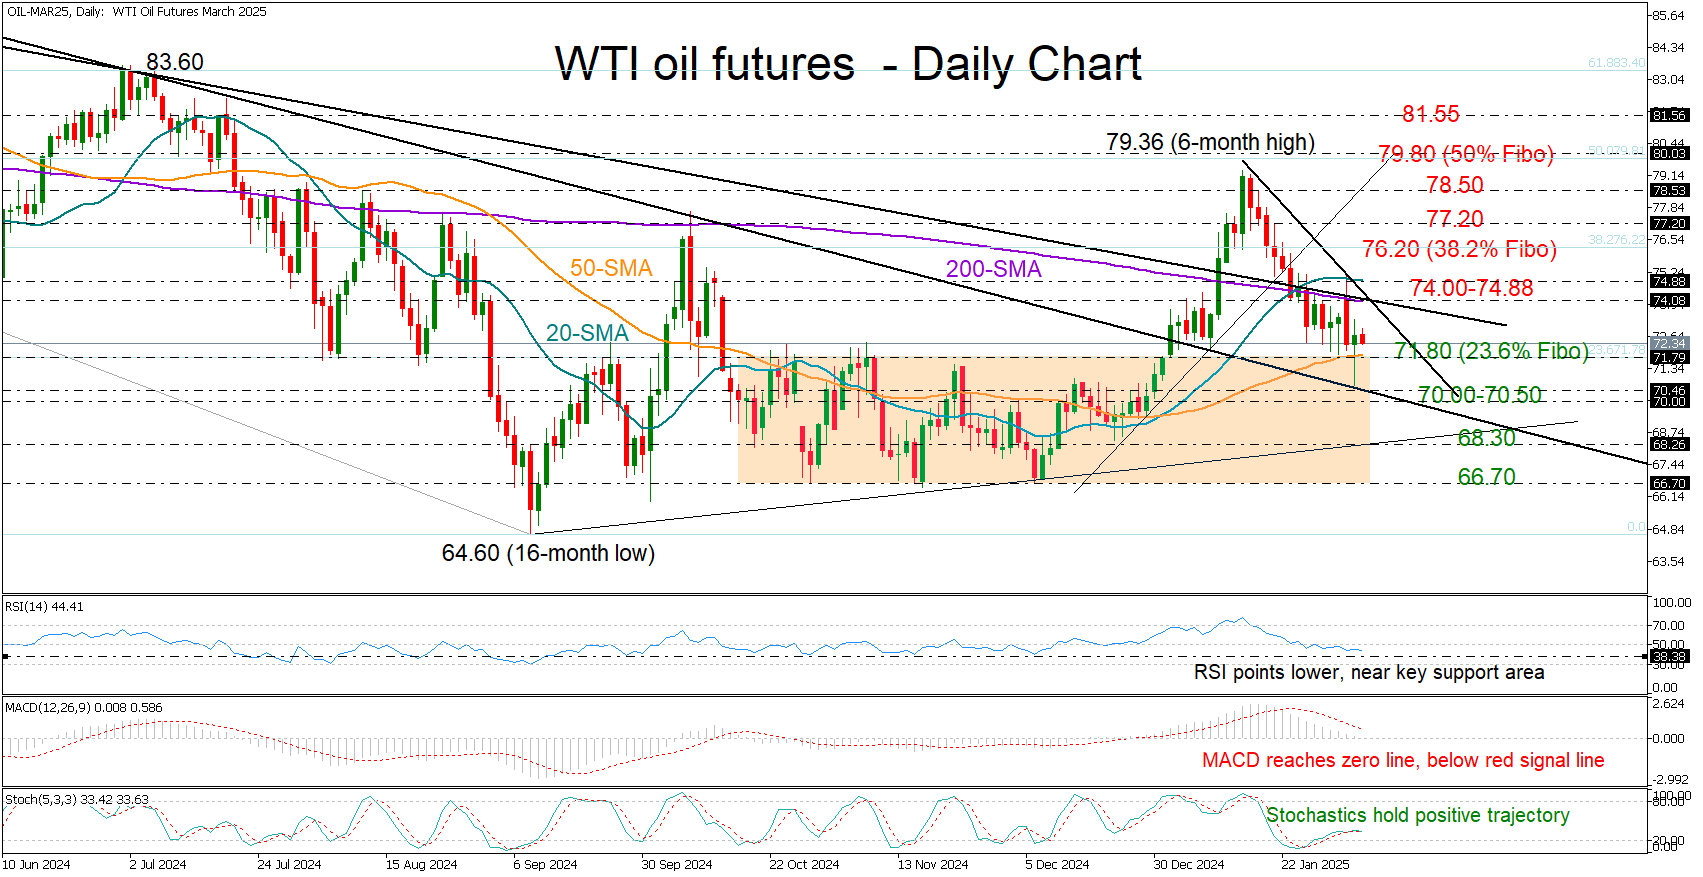
WTI oil futures have been in decline for three weeks, shedding 6% since January’s peak of 79.36. Tuesday’s sharp pullback drove the price to 70.66, but fresh buying interest at a key trendline from the 2023 high helped lift it back above the 50-day simple moving average (SMA).
Technically, downside risks persist as the RSI and MACD continue to slow. However, the RSI is nearing a key pivot zone, and the stochastic oscillator, despite losing momentum, still holds a positive trajectory, leaving room for a potential rebound.
The 74.00-74.88 region, formed by the 200- and 20-day SMAs and key resistance lines, remains a significant barrier. A decisive breakout above this zone could trigger a rally towards 76.20, aligning with the 38.2% Fibonacci retracement of the 2023-2024 downtrend. Further gains could target 77.20 and 78.50, with the 50% Fibonacci retracement at 79.80 acting as the next ceiling.
Conversely, a drop below the 50-day SMA and the 71.80 support area, which overlaps with the 23.6% Fibonacci level could bring the 70.00-70.50 zone back into focus. A deeper decline may test 68.30, while a break below 66.70 would send stronger bearish signals.
WTI oil futures continue to face a blurry outlook after three weeks of losses. A strong move above 74.00-74.88 might be crucial to shifting momentum in favor of the bulls.
USD/JPY: Falls to 7-Week Low as Strong Japanese Wage Growth Boosts Bets for BoJ Rate Hike
USDJPY fell nearly 0.9% in Asian – early European trading on Wednesday as the dollar remains at the back foot for the third straight day, while yen received fresh boost from stronger than expected rise of earnings in Japan that adds to scenario of more BoJ rate hikes.
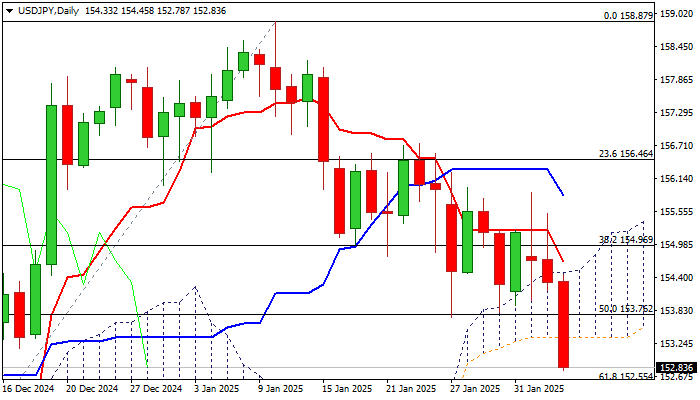
Today’s drop below temporary base / 50% retracement of 148.64/158.87 (153.76) and base of thickening daily cloud (153.36) generated fresh signals of continuation of short-term downtrend from 158.87 (2025 peak, posted on Jan 10).
Bears cracked 200DMA (152.77) which marks the upper boundary of 152.77/41 support zone, consisting of 200DMA / Fibo 61.8% / 100DMA.
Firm break here is needed to validate reversal signal and open way for deeper correction of Sep/Jan 139.57/158.87 rally and expose targets at 151.50 (Fibo 38.2% of 139.57/158.87) and 151.00 (round figure).
Caution on potential headwinds bears may face at this zone, with limited upticks to offer better selling opportunities as daily studies are in predominantly bearish configuration.
Releases of US ADP private sector payrolls report, Dec trade balance and January Services PMI will be closely watched today.
Res: 153.36; 153.76; 154.49; 154.70.
Sup: 152.55; 152.36; 152.00; 151.50.
Cryptocurrency Market Takes a Wait-and-See Approach
Market Picture
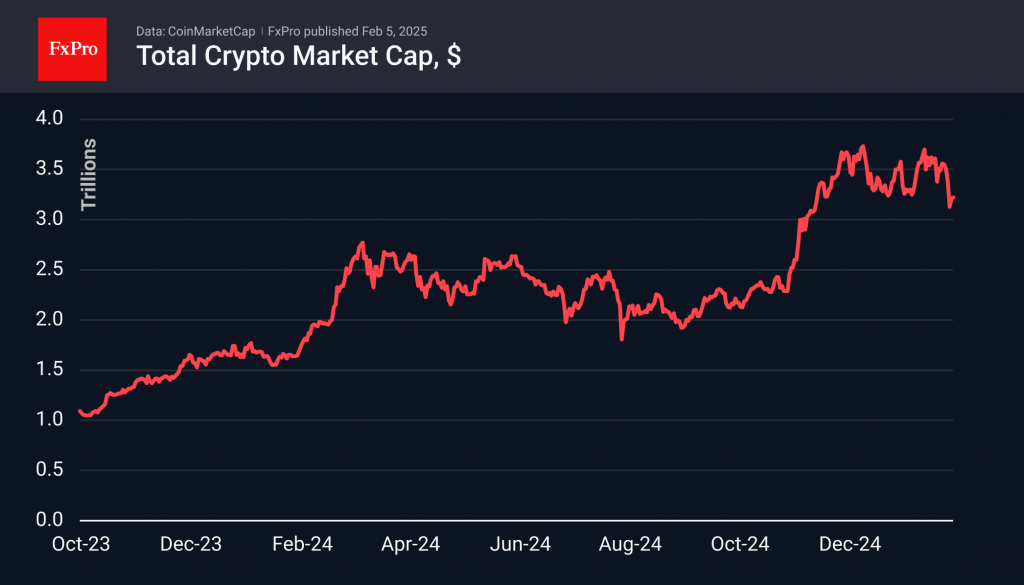
The cryptocurrency market remains in the same position as the previous day, with minor changes at the end of the 24 hours and a capitalisation of $3.21 trillion. Increased buying volumes met market dips, but a new info catalyst is needed for real growth.
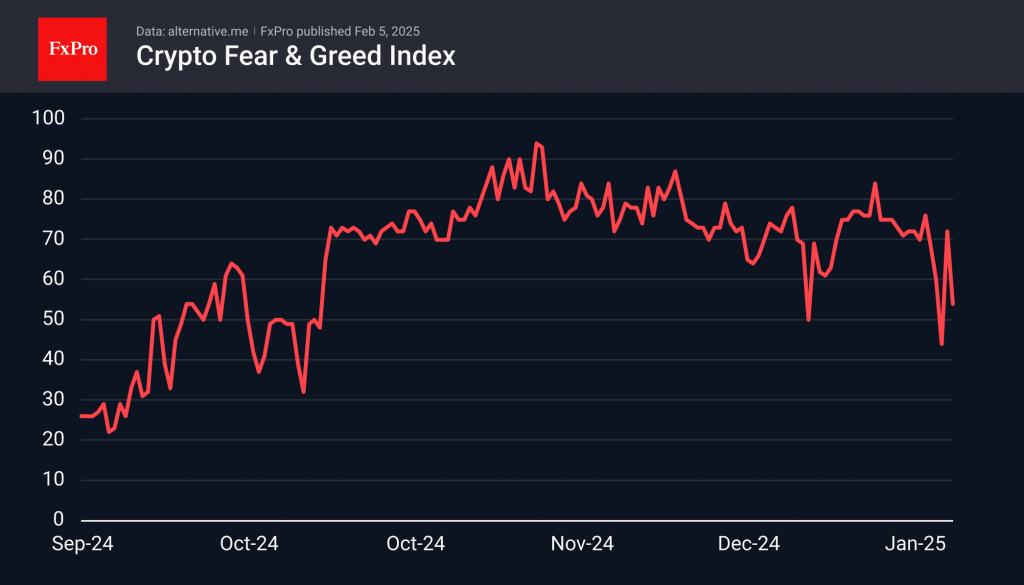
The Altcoin Season Index fell to 36, indicating that the first cryptocurrency was the driver of growth. The crypto market sentiment index lost 18 points to 54 (Neutral). Sentiment volatility does not necessarily mean that a reversal is imminent, but it does delay the start of a full-fledged rally. The corrective pause continues.
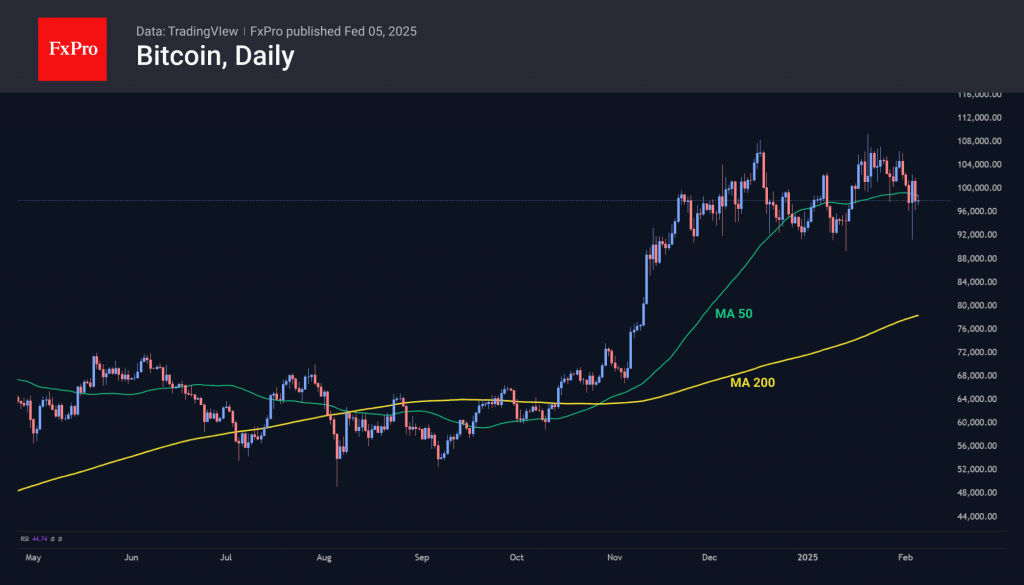
Bitcoin is trading around the 97,500 level and continues to oscillate around its 50-day moving average. The market seems to have found a short-term balance here. However, it is not very positive that the price is trading below the psychologically significant 100,000 level.
News Background
According to CryptoQuant, the cryptocurrency market has been ‘cleansing’ itself of excessive leverage following the drop on February 3rd. The last time there was such a large liquidation of derivatives and a sharp reversal of the rising trend in open interest was in August 2023.
On February 3rd, daily trading volume in US spot Ethereum ETFs reached a December record of $1.5 billion, of which $736 million was in BlackRock’s ETHA.
Most Ethereum validators supported increasing the network’s gas limit – the maximum amount that can be used for transactions in a single block. This improves network performance without the need for a hardfork.
As noted by CryptoQuant, the funding rate for perpetual BTC contracts has turned negative. In the last six instances, this has served as a harbinger of bullish momentum.
Eurozone PPI rises 0.4% in Dec, flat annually
Eurozone PPI increased by 0.4% mom in December, slightly below market expectations of 0.5% MoM. On a year-over-year basis, PPI was unchanged, above expectations of a -0.1% yoy decline.
Breaking down the monthly price changes in Eurozone, energy prices saw the biggest increase at 1.4%, followed by durable consumer goods (+0.2%). Capital goods, intermediate goods, and non-durable consumer goods all edged up by 0.1%.
At the EU level, PPI rose 0.4% mom and 0.1% yoy. The biggest price gains were seen in Bulgaria (+5.1%), Croatia (+2.4%), and Slovakia (+1.5%). On the other hand, Ireland (-1.5%), Romania (-1.3%), and the Netherlands (-0.4%) saw the largest declines.
UK PMI services finalized at 15-month low, stagflation concerns rise
UK PMI Services was finalized at 50.8 in January, slipping from December’s 51.1, marking its joint-lowest level in 15 months. PMI Composite edged up slightly to 50.6, indicating that overall economic activity remains stagnant, with minimal expansion.
According to Tim Moore, Economics Director at S&P Global Market Intelligence, "stagflation conditions appeared to take a firmer hold", with weak output growth coupled with persistent cost pressures. Input cost inflation accelerated for the fifth consecutive month, reaching its highest level since April 2024.
Renewed decline in new business volumes adds to signs that the UK’s economic outlook remains weak, as firms report softening demand conditions. Business confidence has also taken a hit, with expectations for future activity dropping to their lowest level since December 2022.
The most concerning development is the sharp deterioration in employment trends, as service providers cut jobs at the fastest pace in four years. The "twin perils" of shrinking workloads and rising payroll costs has forced many firms to halt recruitment.
Eurozone PMI services finalized at 51.3, no major growth leap expected
Eurozone Composite PMI was finalized at 50.2 in January, up from 49.6 in December, marking the first month of economic expansion since August. However, PMI Services Index was finalized at 51.3, down from prior month's1.6, suggesting that while the services sector remains in growth territory, momentum is fading.
Among individual countries, Spain led the expansion with a Composite PMI of 54.0. Germany’s index climbed to 50.5, hitting an eight-month high, signaling tentative stabilization. Italy remained in contraction at 49.7, while France improved slightly to 47.6.
According to Cyrus de la Rubia, Chief Economist at Hamburg Commercial Bank, the services sector has been instrumental in preventing a broader economic contraction in the Eurozone. Modest but accelerating new orders and employment offer some optimism that the sector could gain momentum in Q1 2025. However, rising costs in services, particularly due to wage pressures, remain a concern for the ECB.
The services outlook is "modest", with business expectations declining slightly and staying below historical averages since mid-2024. Political uncertainties in the Eurozone, including Germany’s upcoming elections and France’s fragile government, continue to weigh on sentiment.
"No major growth leaps are expected in this sector for now," de la Rubia added.
EUR/USD Recovers While USD/CHF Takes Hit
EUR/USD started a fresh increase above the 1.0310 resistance. USD/CHF declined and now struggling below the 0.9120 resistance.
Important Takeaways for EUR/USD and USD/CHF Analysis Today
- The Euro started a decent recovery wave from the 1.0210 zone against the US Dollar.
- There was a break above a connecting bearish trend line with resistance at 1.0340 on the hourly chart of EUR/USD at FXOpen.
- USD/CHF declined below the 0.9160 and 0.9120 support levels.
- There was a break below a major bullish trend line with support at 0.9100 on the hourly chart at FXOpen.
EUR/USD Technical Analysis
On the hourly chart of EUR/USD at FXOpen, the pair started a recovery wave after a major decline, as mentioned in the last analysis. The Euro cleared the 1.02700 resistance to move into a short-term bullish zone against the US Dollar
The bulls pushed the pair above the 50-hour simple moving average and 1.0310. The pair cleared the 50% Fib retracement level of the downward move from the 1.0467 swing high to the 1.0210 low.
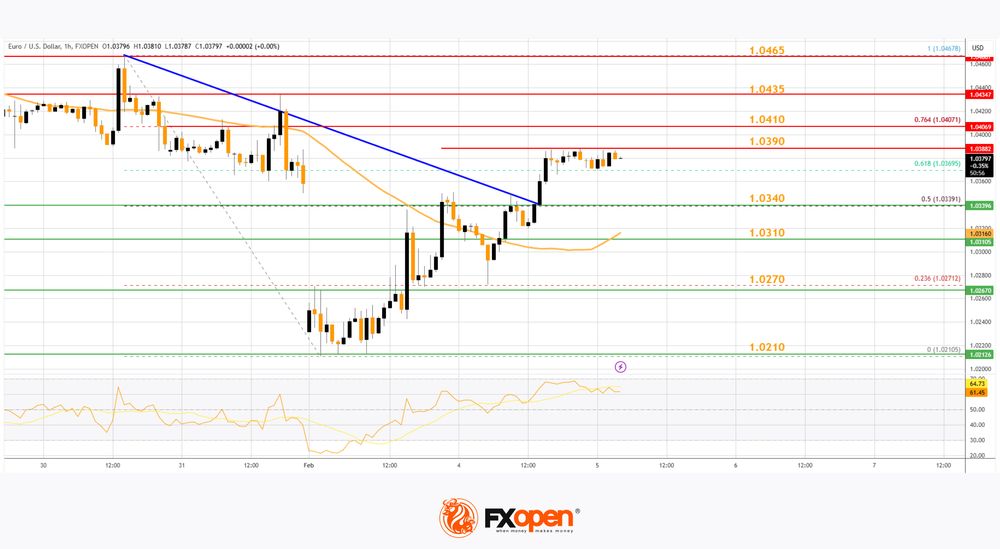
Besides, there was a break above a connecting bearish trend line with resistance at 1.0340. Immediate resistance on the EUR/USD chartis near the 1.0390 zone. The first major resistance is near the 1.0410 level and the 76.4% Fib retracement level of the downward move from the 1.0467 swing high to the 1.0210 low.
An upside break above the 1.0410 level might send the pair toward the 1.0465 resistance. The next major resistance is near the 1.0500 level. Any more gains might open the doors for a move toward the 1.0550 level.
Immediate support on the downside is near the 1.0340 level. The next major support is the 1.0310 level. A downside break below the 1.0310 support could send the pair toward the 1.0270 level. Any more losses might send the pair into a bearish zone toward 1.0210.
USD/CHF Technical Analysis
On the hourly chart of USD/CHF at FXOpen, the pair started a fresh decline from well above the 0.9180 zone. The US Dollar dropped below the 0.9160 support to move into a negative zone against the Swiss Franc.
The bears pushed the pair below the 50-hour simple moving average and 0.9075. Finally, the bulls appeared near the 0.9040 level. A low was formed near 0.9039 and the pair is now consolidating losses.
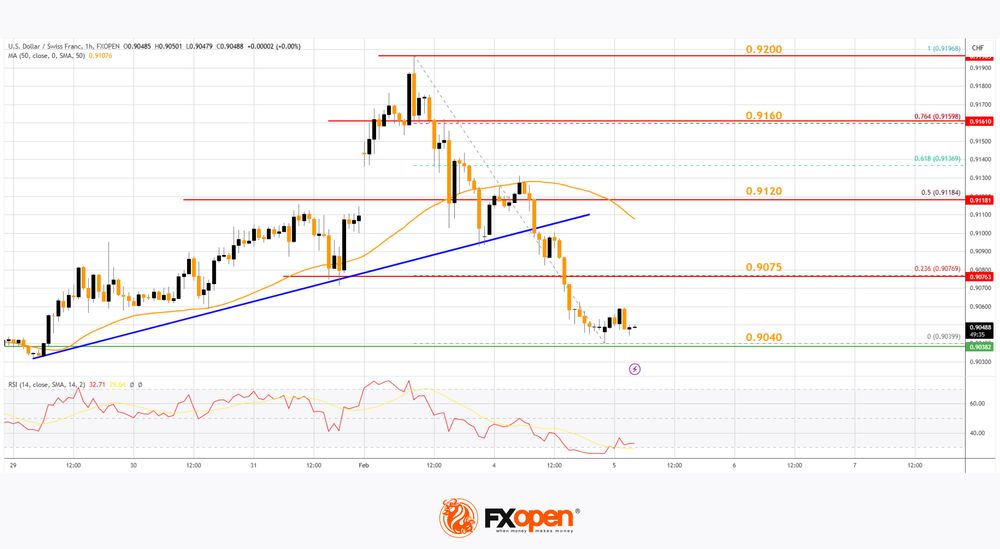
On the upside, the pair could face resistance near the 0.9075 level and the 23.6% Fib retracement level of the downward move from the 0.9196 swing high to the 0.9039 low. The next major resistance is near the 0.9120 level.
The 50% Fib retracement level of the downward move from the 0.9196 swing high to the 0.9039 low is also near 0.9120, above which the pair could test the 0.9160 zone.
If there is a clear break above the 0.9160 resistance zone, the pair could start another increase. In the stated case, it could even surpass 0.9200.
On the downside, immediate support on the USD/CHF chart is 0.9040. The first major support is near the 0.9020 level. The next major support is near 0.9000. Any more losses may possibly open the doors for a move toward the 0.8880 level in the coming days.
Trade over 50 forex markets 24 hours a day with FXOpen. Take advantage of low commissions, deep liquidity, and spreads from 0.0 pips. Open your FXOpen account now or learn more about trading forex with FXOpen.
This article represents the opinion of the Companies operating under the FXOpen brand only. It is not to be construed as an offer, solicitation, or recommendation with respect to products and services provided by the Companies operating under the FXOpen brand, nor is it to be considered financial advice.
NZD/USD Analysis: Recovery from 27-Month Low
This morning, New Zealand’s labour market data was released, showing unfavourable results. The unemployment rate rose to 5.1% in Q4, the highest since Q3 2020, signalling economic slowdown and reinforcing expectations of a rate cut by the Reserve Bank of New Zealand at its meeting in late February.
However, the weak labour market figures were widely anticipated and already priced in. A greater source of uncertainty is the ongoing trade war between the US and China, a key trading partner for both Australia and New Zealand.
Donald Trump stated that he is "in no rush" to speak with Xi Jinping after China retaliated against the 10% US tariffs on Chinese imports.
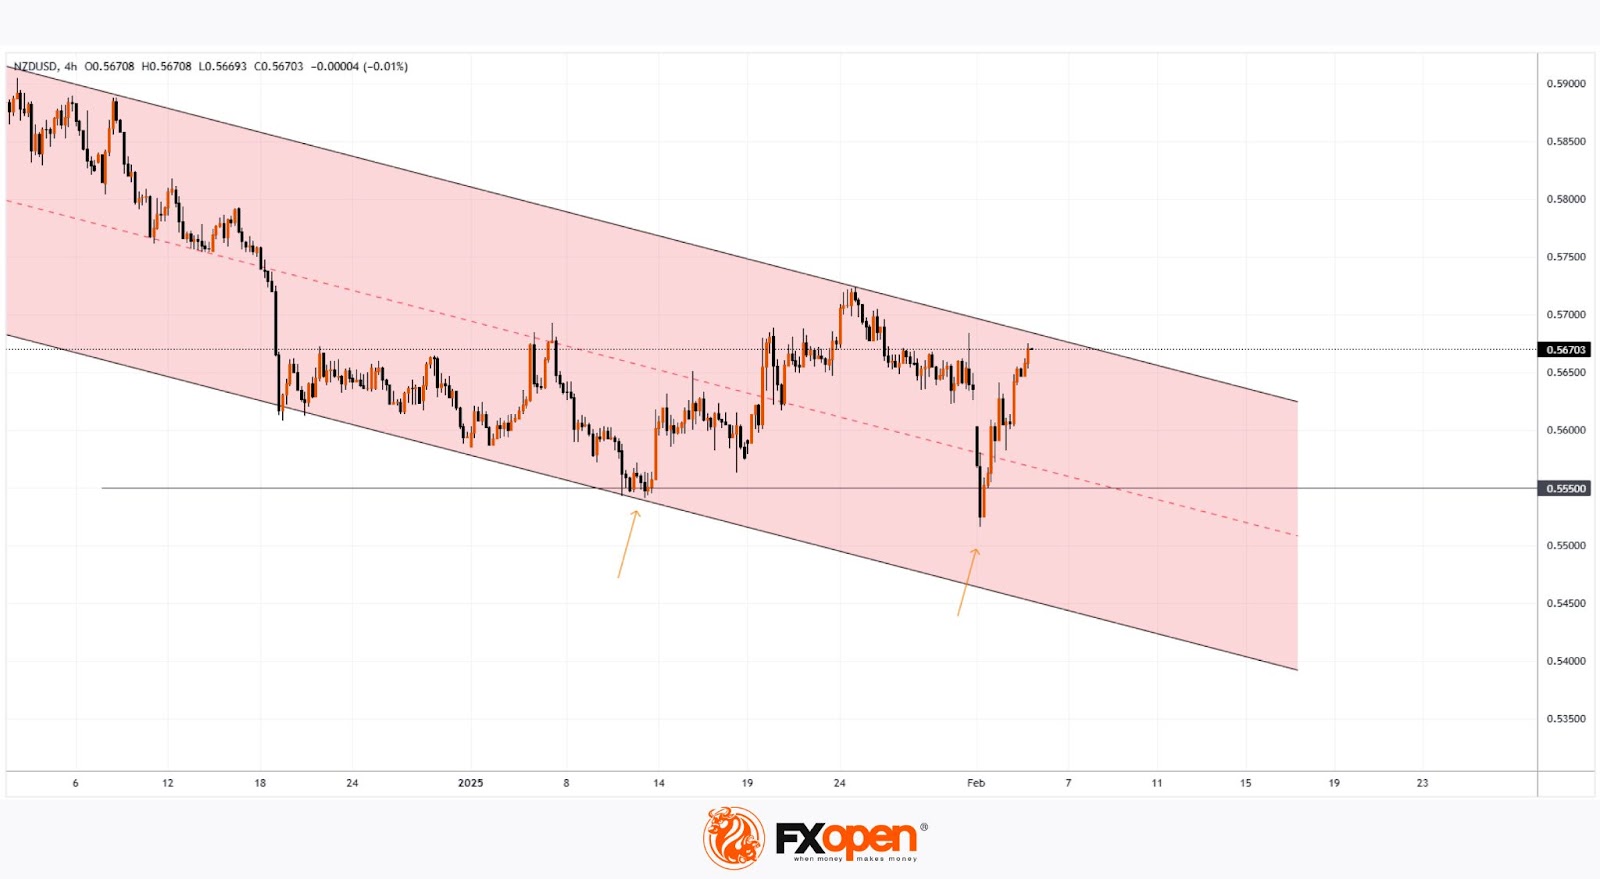
Technical analysis of the NZD/USD chart shows that:
→ The pair remains in a downward trend (marked in red), driven by a strengthening US dollar. The price is currently near the upper boundary of this trend.
→ The 0.555 level acted as support twice in 2025, as indicated by arrows. Notably, the price also reversed upwards from this area in 2022.
It is possible that buyers will gain confidence and attempt to break the upper boundary of the channel. The future trajectory of NZD/USD will largely depend on news related not only to central bank interest rate decisions but also to government actions on tariffs.
Trade over 50 forex markets 24 hours a day with FXOpen. Take advantage of low commissions, deep liquidity, and spreads from 0.0 pips. Open your FXOpen account now or learn more about trading forex with FXOpen.
This article represents the opinion of the Companies operating under the FXOpen brand only. It is not to be construed as an offer, solicitation, or recommendation with respect to products and services provided by the Companies operating under the FXOpen brand, nor is it to be considered financial advice.
US Data to Lose Some Market Moving Potential Short Term
Markets
he tariff story was a blitzkrieg at the start of this week, but it’s back to the trenches now as Mexico and Canada are given a month to come up with border control measures to slow migrants and drugs getting in the US while China retaliated on the opening 10% tariff hit. EMU stock markets gained around 1% with key US indices winning up to 1.35% for Nasdaq. EUR/USD managed to claw back to Friday’s levels just below 1.04. US yields lost 3.5 bps (2-yr) to 4.7 bps with the belly of the curve outperforming the wings even as Fed vice-chair Jefferson and SF Fed Daly joined the chorus of “caution” when it comes to adjusting policy rates further. Today’s US eco calendar contains ADP employment change and the services ISM. With US money markets currently positioned for a longer pause (next rate cut only fully discounted in July), we expect US data to lose some market moving potential short term with Trump-related volatility name of the game for now.
The ECB at the end of last year presented its new “wage trackers”. ECB Lagarde at several press conferences already referred to them with the message that they point to slowing wage growth and are more useful that the outdated/backward looking quarterly negotiated wage figures. Q4 2024 figures will for example be only released on February 25 with the previous and “latest” Q3 number clocking in at an EMU high of 5.4% Y/Y. The headline ECB wage tracker measures negotiated wage growth with smoothed one-off payments in the euro area. The ECB will publish four subseries on Wednesday in the week following the monetary policy meeting, which is today. In December, the tracker pointed to strong negotiated wage growth of 4.7% in 2024, easing to 3.2% this year. In monthly terms, this indicator is expected to peak at 5.4% at the end of 2024, the highest value recorded since the series began in January 2013. Today’s wage trackers are one of three key inputs this week for the central bank. January EMU inflation numbers were the first one on Monday. Both headline (2.5% Y/Y) and core CPI (2.7% Y/Y) were slightly above consensus, but didn’t get the usual media coverage in light of the tariff escalation. Finally, on Friday ECB staff is expected to publish insights on the level of neutral rates (r*) in Europe. ECB Lagarde dodged questions on the matter at last week’s presser, referring to this paper instead. It could be key in determining the remaining policy room to lower rates beyond the March meeting (25 bps cut to 2.5% expected). We stick to the view that the market reflex to put eggs in the ECB’s basket when it comes to shielding the EMU economy from whatever potential hit (eg tariffs) is the wrong one in a context where inflation remains stubbornly above the 2% inflation target. EMU money markets are again positioned too dovish (1.75% EoY policy rate) in our view.
News & Views
The New Zealand unemployment rate continued to increase in the final quarter of 2024. Rising to 5.1% from 4.8% in the quarter before, it was the highest since 2020Q3 (5.2%) compared to a series low of 3.2% end 2021. The employment rate eased to 67.4% from 69% a year ago. The annual fall reflected 32k fewer employed people which was the biggest decline since 2009. New Zealand’s participation rate fell slightly to 71% and is now below the peak seen prior to the pandemic. Wages (including overtime) grew 0.6% q/q and 3.3% in the year to the December quarter, this too is down from the 3.8% in 2024Q3. The numbers are broadly in line to marginally below expectations. The kiwi dollar shrugged though. NZD/USD (around 0.566) is already trading at weak levels with the overall US-Sino trade war narrative casting a long shadow over the currency. Equally, NZ money markets price in already a substantial amount of additional monetary easing of 125 bps+ in 2025 from the 4.25% currently.
The Financial Times citing officials reported that the EU is planning to hit US big tech should president Donald Trump slap tariffs on the bloc using its so-called “anti-coercion instrument”. This tool, dubbed a “bazooka”, is said to be the toughest response available without breaching international law and was created during Trump’s first term. It can be deployed when the EU determines a country is using tariffs to force changes in policy. A wide range of retaliatory measures include “revoking the protection of intellectual property rights or their commercial exploitation, for example software downloads and streaming service”, or “block foreign direct investment or restrict market access for banking, insurance and other financial services firms”. While the EU has a large trade surplus with the US in the goods sector (>€150bn in 2023), it’s running a >€100bn trade deficit in services.