Sample Category Title
Could Friday’s NFP Report Trigger More Dollar Sell-off?
- January’s job growth could dip below 200K.
- The labor market remains strong overall.
- USD/JPY in bearish mode; a single rate cut still provide support.
The first Nonfarm Payrolls (NFP) report of the year –and the last of Biden’s era –will be published this Friday, making it a key event for traders. Trump’s escalating-de-escalating tariff policies have dominated market sentiment, this jobs report could still fuel fresh volatility.
Next Fed rate cut on hold
While a risk-off mood could stay in play as a US-China trade war is on hold and investors are uncertain about how soon and if trade negotiations between the US and its neighbors Mexico and Canada will bear fruit before the monthly deadline, fundamentals may take center stage in the coming sessions. The Fed kept interest rates steady after three consecutive cuts – starting with a bold 50bps reduction in September - but left traders wondering when the next move will take place.
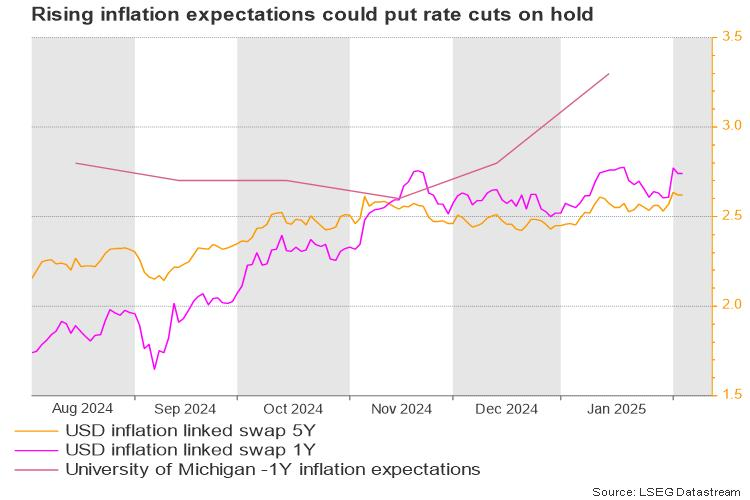
Futures markets are pricing in 46bps of rate cuts by year-end – almost two additional cuts – but recent Fed commentary suggests the central bank may not rush to further ease monetary policy. With inflation expectations turning higher and economic indicators holding firm, the Fed may hesitate to drive interest rates lower. Following the stickiness’ in December’s core PCE price index, the ISM manufacturing PMI survey for January suggested that inflation pressure remains alive, and the economy is growing at a heathy pace, with the manufacturing sector finally contributing to the expansion after remaining stagnant for two years.
What to watch on Friday
The NFP report is projected to show that 170K new jobs were added in January – a slower pace than December's 256K. However, the unemployment rate is expected to hold near historic lows at 4.1% , and average hourly earnings may tick down to 3.8% from 3.9% previously, staying within the 2024 range.
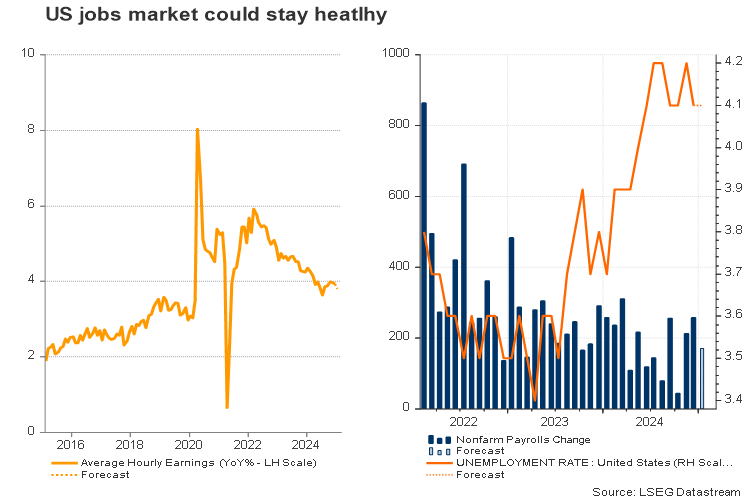
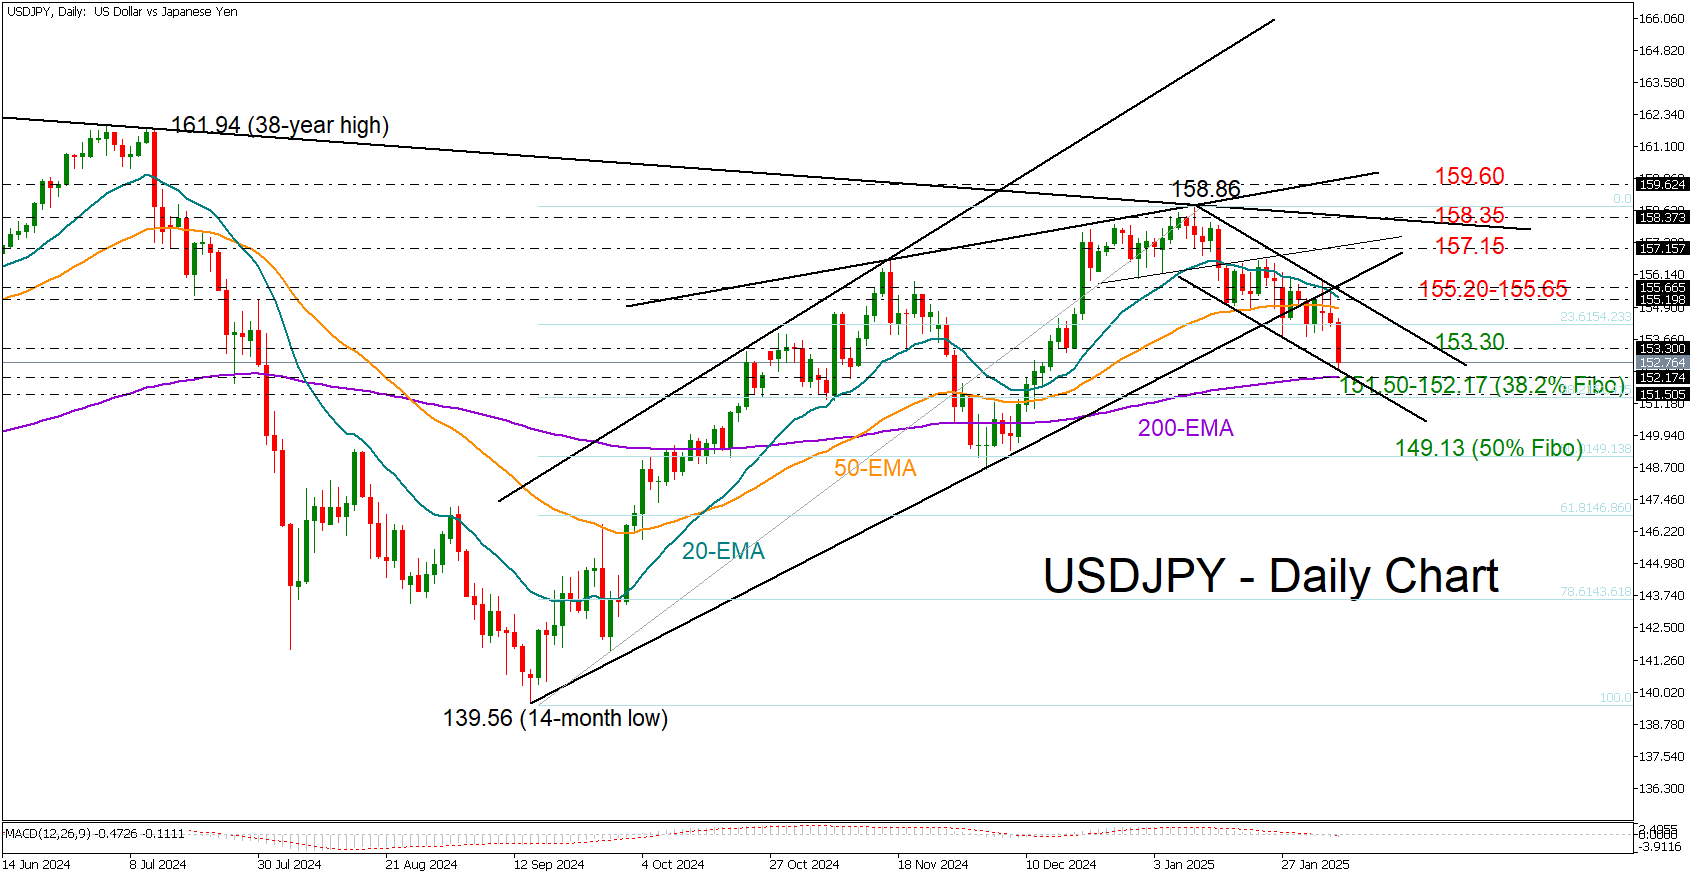
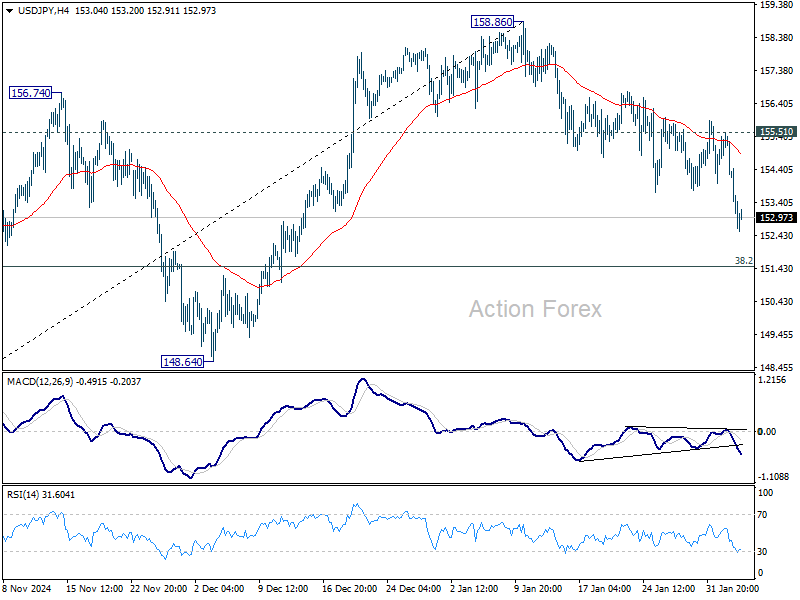
Historically, January has delivered strong job gains above 200K, both pre-pandemic and in the past two years. A downside surprise could spark a dollar sell-off, pushing traders to fully price in a second rate cut - especially if the unemployment rate rebounds and wage growth slows at a faster pace. In this scenario, USDJPY could accelerate its decline, breaking below the 200-day EMA at 152.17. A breach of the 151.50 support level could open the door for a drop towards 149.10.
In the event of a classic stronger-than-expected report, showing more than 200k new jobs, the odds of a second rate cut could diminish, offering relief to USDJPY. However, a rally towards the constraining 20-day exponential moving average at 155.20 remains to be seen, especially as Japanese wage data keeps a rate hike by the BoJ on the table.
The bigger picture
The Fed is likely to stay on hold unless inflation moves convincingly towards its 2.0% target and the outlook on fiscal and trade policies becomes clearer. While the total number of rate cuts for 2025 remains a puzzle, a single cut could stay in play, even if Friday’s jobs report beats expectations by a wide margin as the year has just started. In such a scenario, the U.S. dollar could advance, particularly against the European and antipodean currencies, which are vulnerable to a relatively more aggressive monetary easing.
US Eco Data Lost Importance at Volatile Start of Trump 2.0
Markets
The ECB updated its wage tracker, published a first time after last December’s policy meeting. The headline indicator’s path is broadly unchanged with wages expected to remain sticky in Q1 and Q2 of this year (4.9% Y/Y and 4.5% Y/Y respectively) before “collapsing” in the second half of next year to 2.2% Y/Y in Q3 and 1.5% Y/Y in Q4 (marginally up from 1.4% in December). Just like January CPI’s on Monday (marginally above consensus) they won’t really move the needle in the ECB’s compass. That leaves Friday’s staff paper on neutral rates as the one to watch. The pre-pandemic 1.75%-2.50% for R* risks seeing a higher bottom with implication on the central bank’s policy path beyond the expected 25 bps rate cut in March (to 2.5%). If any, it suggests that the current implied market rate bottom by year-end (1.75%) is too low. While being at the topic of the ECB, it’s maybe worth mentioning an article published today at the central bank’s blog titled “What happens when US and euro area monetary policy decouple?”. The authors conclude that spillovers from US monetary policy initially work in the opposite direction to ECB monetary policy, but then later in the same direction. For instance, a surprise tightening of US policy leads to an initial increase in euro area inflation (on average over the three months after the announcement) as the euro weakens. However, over time, tighter US monetary policy drags down euro area inflation much like tighter ECB policy would. The blogpost thus suggest that the ECB should hold its nerve and look through the initial inflationary impact in such scenario. Markets didn’t respond to the ECB data releases, but interest rates did show sensitivity to comments from ECB chief economist Lane. He warned that the inflation slowdown might take longer than thought and that the ECB must avoid moving too slowly, to avoid hurting the economy, or too quickly as new upside inflation risks might emerge. The comments, coming from a known dove on the ECB board, caused an underperformance at the front end of EUR rate curves, which erased daily losses of up to 5 bps to currently trade flat on the day. The euro failed to profit, trading flat in the 1.04 area. US eco data lost importance at the volatile start of Trump 2.0 especially since Fed governors collectively steer in the direction of a prolonged pauser to counter any inflationary risks. January ADP employment change showed another solid 183k job gain (vs 150k expected) including an upward revision (176k from 122k) to December data. The US services ISM is up for release later today. General risk sentiment turned again somewhat more sour with (very) long core bonds profiting the most. First questions are being raised over whether the US economy will be able to weather the president’s explosive policy mix.
News & Views
Czech retail sales unexpectedly showed strong momentum at the end of 2024. Retail trade (except motor vehicles) in real terms rose 1.2% M/M and 6.2% Y.Y. In a monthly perspective, sales growth was rather broad-based with non-food sales up 1.5%, food sales adding 1.1% and sales of automative fuels rising by 0.2% M/M. For the whole of 2024 sales in real terms were 4.6% higher compared to 2023. The Czech Statistical Office indicated internet and mail-order houses as the biggest contributor of overall sales. The substantial overall Y/Y rise is partially due to a lower comparison base in 2023, but suggests that domestic demand has regained traction. Tomorrow, January Czech CPI data will be published while the Czech National Bank announces the outcome of its monetary policy meeting. The CNB is largely expected to further reduce/finetune its policy rate from 4% to 3.75 after having taken a pause at the December meeting. At EUR/CZK 25.13, the koruna extends a short-term rebound after declining due to overall uncertainty on global trade/US tariffs on Monday.
The National Bank of Poland kept its policy rate unchanged at 5.75%. The decision occurred as the communication from MPC members recently suggested some growing internal debate on how long the current status quo in the policy rate will have to last. Governor Glapinski advocated a higher-for-longer stance as inflation remains well above target and as the government is removing price caps on energy, likely keeping inflation at elevated levels throughout the end of this year. However, other MPC members suggested that the MPC might consider debating rate cuts later this year considering the overall outlook on inflation. At EUR/PLN 4.20 the zloty is trading at the strongest levels against the euro since April 2018. The NBP will publish its policy statement after finishing this report.
US ISM services falls to 52.8 as business activity and new orders weaken
US ISM Services PMI declined from 54.0 to 52.8 in January, falling short of market expectations of 54.2.
The drop was driven primarily by slower growth in business activity and new orders, both of which saw noticeable declines. Business activity/production slipped from 58.0 to 54.5, while new orders dropped from 54.4 to 51.3. Meanwhile, employment edged higher from 51.3 to 52.3, and prices eased from 64.4 to 60.4, suggesting some moderation in inflationary pressures within the service sector.
According to ISM, the weaker composite reading reflects a slowdown in business momentum, with adverse weather conditions frequently cited by respondents as a factor dampening production and demand. While concerns over potential US government tariffs were mentioned, businesses did not yet report significant direct impacts.
The decline in services activity points to some softening in economic momentum, though the sector remains in expansion territory above the 50.0 threshold. Current Services PMI reading aligns with an annualized GDP growth of 1.4%, suggesting moderate economic expansion.
USD/JPY Mid-Day Outlook
Daily Pivots: (S1) 153.84; (P) 154.68; (R1) 155.18; More...
Intraday bias in USD/JPY remains on the downside for 38.2% retracement of 139.57 to 158.86 at 151.49. Strong support could be seen from there to complete the corrective fall from 158.86 and bring rebound. But further fall will remain in favor as long as 155.51 resistance holds, in case of recovery. Sustained break of 151.49 will raise the chance of bearish reversal.
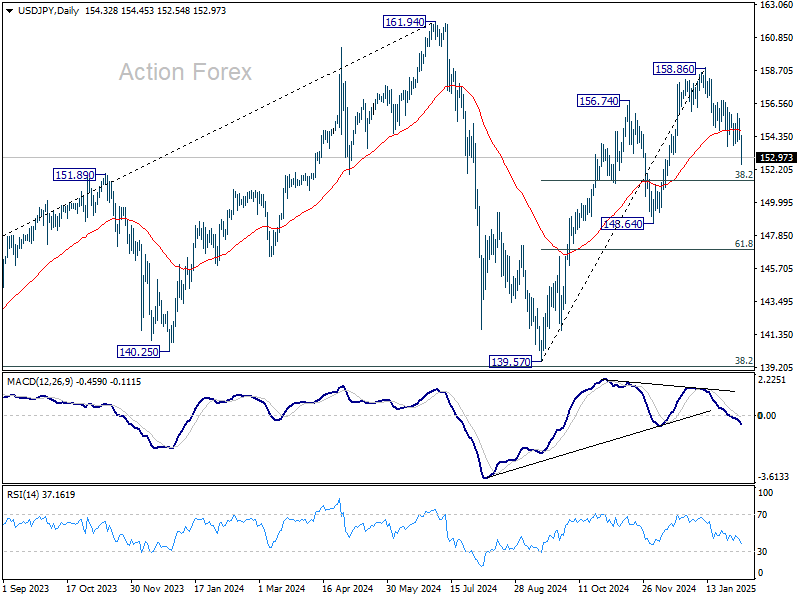
In the bigger picture, price actions from 161.94 are seen as a corrective pattern to rise from 102.58 (2021 low). The range of medium term consolidation should be set between 38.2% retracement of 102.58 to 161.94 at 139.26 and 161.94. Nevertheless, sustained break of 139.26 would open up deeper medium term decline to 61.8% retracement at 125.25.
USD/CHF Mid-Day Outlook
Daily Pivots: (S1) 0.9015; (P) 0.9082; (R1) 0.9117; More…
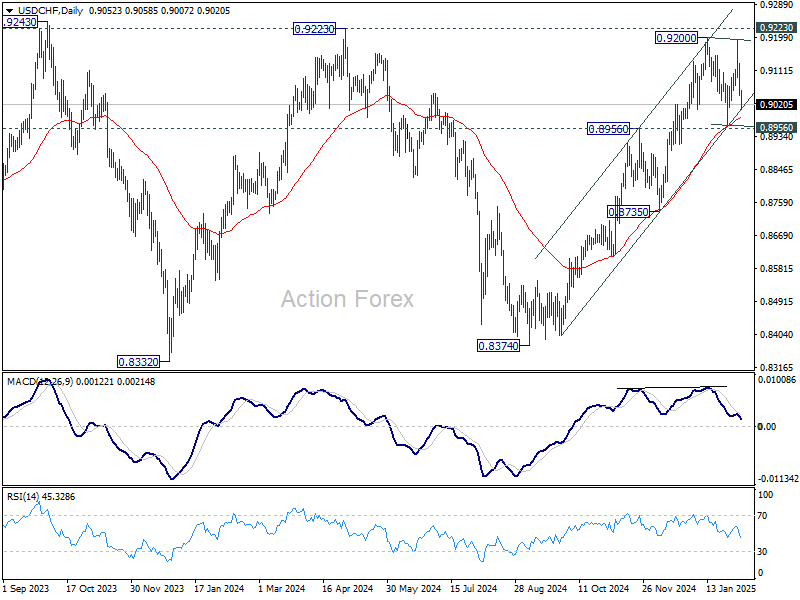
USD/CHF dips further today as consolidation from 0.9200 extends, but stays well above 0.8956/64 support. Intraday bias stays neutral first. Outlook will remain bullish as long as 0.8956/64 support holds. Firm break of 0.9200/9223 will resume the whole rally from 0.8374 and carry larger bullish implication. However, sustained break of 0.8964 will complete a double top reversal pattern, and turn bias to the downside for deeper decline.
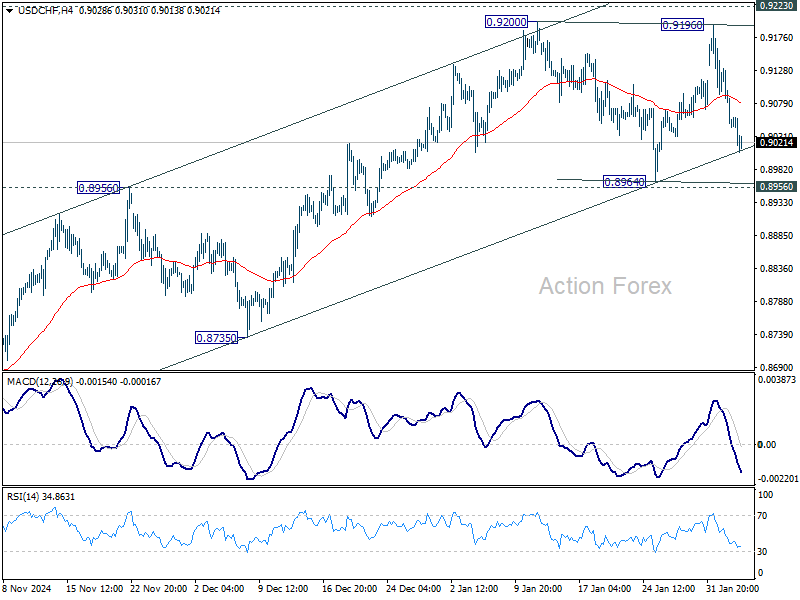
In the bigger picture, decisive break of 0.9223 resistance will argue that whole down trend from 1.0342 (2017 high) has completed with three waves down to 0.8332 (2023 low). Outlook will be turned bullish for 1.0146 resistance next. Nevertheless, rejection by 0.9223 will retain medium term bearishness for another decline through 0.8332 at a later stage.
GBP/USD Mid-Day Outlook
Daily Pivots: (S1) 1.2410; (P) 1.2451; (R1) 1.2524; More...
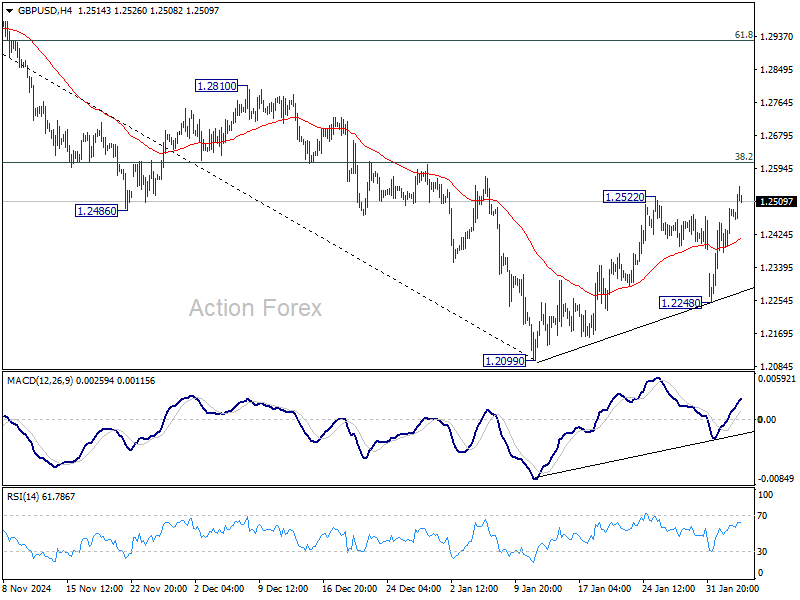
GBP/USD's corrective rebound from 1.2099 extends through 1.2522. But upside is still expected to be limited by 38.2% retracement of 1.3433 to 1.2099 at 1.2609. On the downside, break of 1.2248 support will bring retest of 1.2099 first. Firm break there will resume whole decline from 1.3433. However, decisive break of 1.2609 will raise the chance of near term reversal, and target 61.8% retracement at 1.2923.
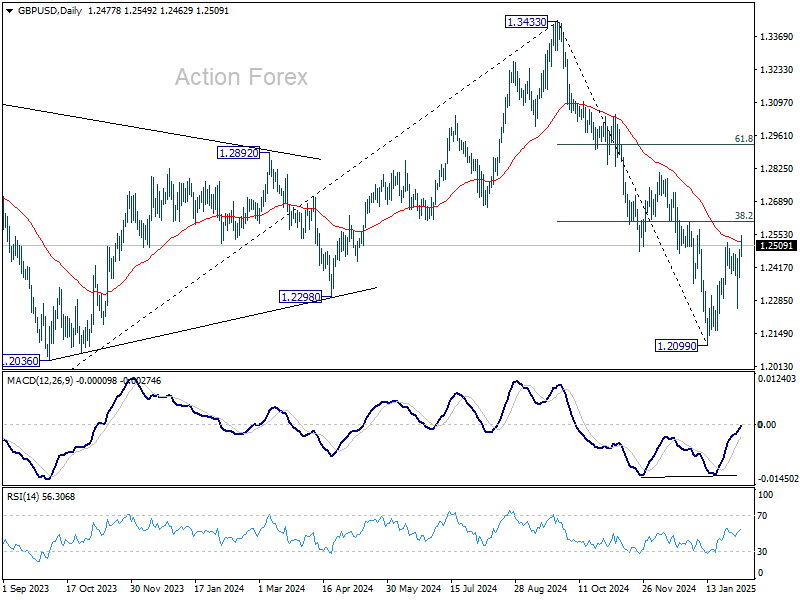
In the bigger picture, rise from 1.0351 (2022 low) should have already completed at 1.3433 (2024 high), and the trend has reversed. Further fall is now expected as long as 1.2810 resistance holds. Deeper decline should be seen to 61.8% retracement of 1.0351 to 1.3433 at 1.1528, even as a corrective move. However, firm break of 1.2810 will dampen this bearish view and bring retest of 1.3433 high instead.
Canada: December Nrings the First Trade Surplus Since February 2024
Canada's merchandise trade balance tallied a first-in-ten-month surplus of $708 million in December. November's deficit was revised higher to $986 million (from $323 million reported earlier).
Merchandise exports accelerated to 4.9% month-on-month (m/m) from 1.9% in November, with gains reported by 8 out of 11 sectors. Energy exports, driven by higher crude oil prices, were once again the biggest driver of exports, accelerating to 9.5% m/m. Exports of metal and non-metallic mineral products (+9.2% m/m) and motor vehicles and parts (+3.9% m/m) also added admirably to the headline tally.
Merchandise imports also moved higher for a third straight month, up by 2.3% m/m in December. The biggest gains came from consumer goods (+4.7% m/m), metal and non-metallic mineral products (+8.7%) and industrial machinery (+5.0% m/m).
In volume terms, merchandise exports rose by 2.6% m/m while imports edged higher by 0.2% m/m.
Canada's merchandise trade surplus with the United States widened to $11.3 billion in December from $8.2 billion the month prior.
Key Implications
Trade finished the quarter on a strong note, with goods likely providing an improved trajectory for Q4 GDP growth. Trade-related uncertainty has likely led companies to stockpile inventories, temporarily boosting trade. Note, Statistics Canada's ongoing transition in trade-related data means these figures should be interpreted with caution.
While the immediate threat of tariffs on Canadian exports has been delayed until next month, the outlook remains uncertain as tariffs are still on the table. Any future tariffs will have negative consequences for economic growth, though the ultimate effect will depend on depth, breadth, duration and retaliation.
EUR/USD Mid-Day Outlook
Daily Pivots: (S1) 1.0305; (P) 1.0346; (R1) 1.0421; More...
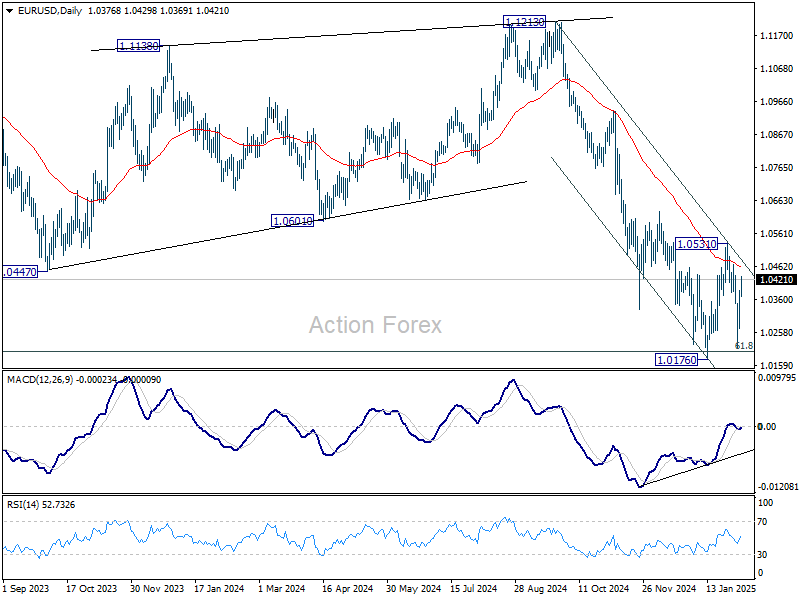
While EUR/USD's recovery from 1.0210 continues today, upside is still limited below 1.0531 resistance. Intraday bias remains neutral and further decline is expected. On the downside, break of 1.0176 will resume whole fall from 1.1213. However, sustained break of 1.0531 will rise the chance of bullish reversal and turn bias back to the upside for stronger rally.
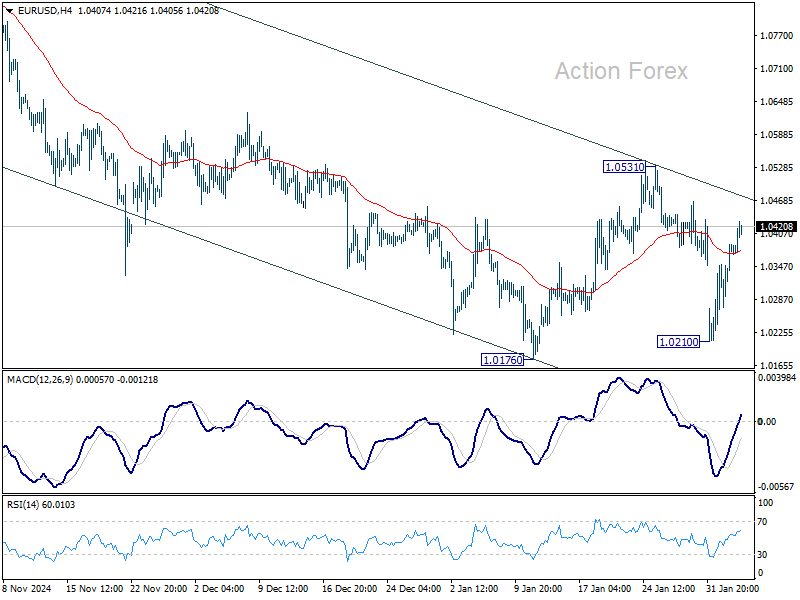
In the bigger picture, immediate focus is back on 61.8 retracement of 0.9534 (2022 low) to 1.1274 (2024 high) at 1.0199. Sustained break there will solidify the case of medium term bearish trend reversal, and pave the way back to 0.9534. However, strong support from 1.0199 will argue that price actions from 1.1274 are merely a corrective pattern, and has already completed.
Dollar Struggles Continue Despite Strong ADP, Caution Prevails
Dollar remains on the backfoot in early US session, despite the strong ADP private employment report. The data highlights continued resilience in the labor market, with services-driven job growth and sustained wage pressures. While this should theoretically reinforce the case for Fed to maintain its pause in easing for longer, traders appear reluctant to react decisively ahead of Friday’s Non-Farm Payroll report, which will provide a more comprehensive labor market picture.
Beyond economic data, uncertainty surrounding US-China trade relations is another key factor keeping traders from placing larger bets on the greenback. The additional 10% duties on Chinese goods remain firmly in place. Traders are monitoring the anticipated phone call between US President Donald Trump and Chinese President Xi Jinping, but no official timeline has been set. The lack of diplomatic engagement has kept market caution elevated.
Adding to the confusion, the US Postal Service reversed its earlier suspension of inbound packages from China and Hong Kong. Instead, it will now work closely with US Customs and Border Protection to enforce the new tariff collection measures more effectively. This aligns with Trump’s decision to close the “de minimis” trade loophole, which previously allowed Chinese e-commerce giants like Temu and Shein to ship goods into the US duty-free in high volumes.
Overall in the forex markets, Canadian Dollar continues to lead gains this week, supported by the avoidance of US tariffs. Japanese Yen follows closely, buoyed by strong wage growth data, which is raising expectations for further rate hikes from BoC. Australian Dollar has also shown some resilience too. Dollar remains the weakest performer, followed by Euro and New Zealand Dollar. Sterling and Swiss Franc are positioned in the middle of the pack.
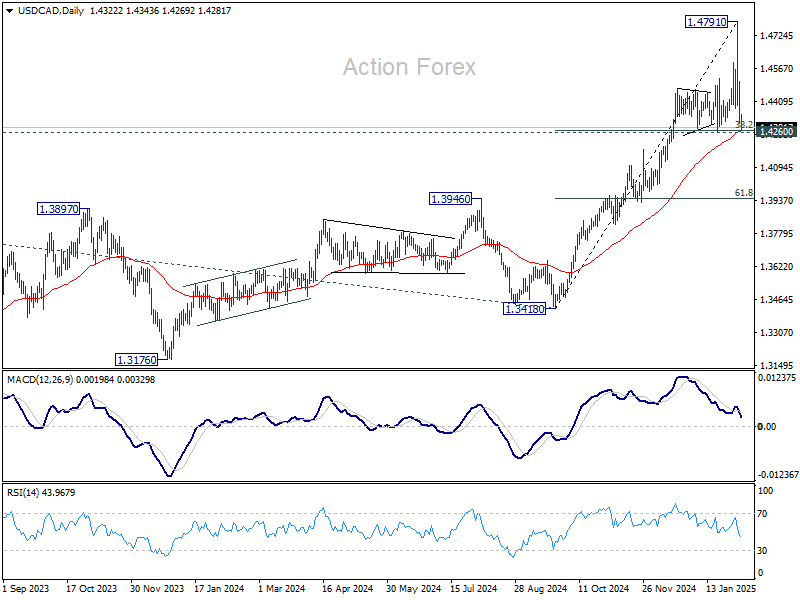
Technically, USD/CAD is now pressing an important cluster support level at 1.4260, with 38.2% retracement of 1.3418 to 1.4791 at 1.4267, and 55 D EMA at 1.4267. Strong support is expected there to complete the pull back from 1.4791 and bring rebound. However, decisive break of 1.4260 will be a sign of broad-based weakness in Dollar for the near term. USD/CAD could dive further to 618% retracement at 1.3942, along with extended selloff in Dollar elsewhere.
In Europe, at the time of writing, FTSE is up 0.37%. DAX is up 0.15%. CAC is down -0.21%. UK 10-year yield is down -0.061 at 4.464. Germany 10-year yield is down -0.0391 at 2.364. Earlier in Asia,Nikkei rose 0.09%. Hong Kong HSI fell -0.93%. China Shanghai SSE fell -0.65%. Singapore Strait Times fell -0.20%. Japan 10-year JGB yield rose 0.0076 to 1.284.
US ADP jobs beats expectations with 183k gain, led by services
US ADP private employment report showed a stronger-than-expected job gain of 183K in January, surpassing market forecasts of 149K.
Service sector was the clear driver of employment, adding 190K jobs, while goods-producing industries shed -6K positions. By company size, small businesses contributed 39K jobs, medium-sized firms led with 92K, and large corporations added 69K.
Wage growth remained elevated, with annual pay increases for job-stayers at 4.7% yoy, while job-changers saw an even stronger 6.8% yoy rise.
According to Nela Richardson, Chief Economist at ADP, the report reveals a "dichotomy" in the labor market, with consumer-facing industries leading the way, while business services and production lag behind.
Eurozone PPI rises 0.4% in Dec, flat annually
Eurozone PPI increased by 0.4% mom in December, slightly below market expectations of 0.5% MoM. On a year-over-year basis, PPI was unchanged, above expectations of a -0.1% yoy decline.
Breaking down the monthly price changes in Eurozone, energy prices saw the biggest increase at 1.4%, followed by durable consumer goods (+0.2%). Capital goods, intermediate goods, and non-durable consumer goods all edged up by 0.1%.
At the EU level, PPI rose 0.4% mom and 0.1% yoy. The biggest price gains were seen in Bulgaria (+5.1%), Croatia (+2.4%), and Slovakia (+1.5%). On the other hand, Ireland (-1.5%), Romania (-1.3%), and the Netherlands (-0.4%) saw the largest declines.
Eurozone PMI services finalized at 51.3, no major growth leap expected
Eurozone Composite PMI was finalized at 50.2 in January, up from 49.6 in December, marking the first month of economic expansion since August. However, PMI Services Index was finalized at 51.3, down from prior month's1.6, suggesting that while the services sector remains in growth territory, momentum is fading.
Among individual countries, Spain led the expansion with a Composite PMI of 54.0. Germany’s index climbed to 50.5, hitting an eight-month high, signaling tentative stabilization. Italy remained in contraction at 49.7, while France improved slightly to 47.6.
According to Cyrus de la Rubia, Chief Economist at Hamburg Commercial Bank, the services sector has been instrumental in preventing a broader economic contraction in the Eurozone. Modest but accelerating new orders and employment offer some optimism that the sector could gain momentum in Q1 2025. However, rising costs in services, particularly due to wage pressures, remain a concern for the ECB.
The services outlook is "modest", with business expectations declining slightly and staying below historical averages since mid-2024. Political uncertainties in the Eurozone, including Germany’s upcoming elections and France’s fragile government, continue to weigh on sentiment.
"No major growth leaps are expected in this sector for now," de la Rubia added.
UK PMI services finalized at 15-month low, stagflation concerns rise
UK PMI Services was finalized at 50.8 in January, slipping from December’s 51.1, marking its joint-lowest level in 15 months. PMI Composite edged up slightly to 50.6, indicating that overall economic activity remains stagnant, with minimal expansion.
According to Tim Moore, Economics Director at S&P Global Market Intelligence, "stagflation conditions appeared to take a firmer hold", with weak output growth coupled with persistent cost pressures. Input cost inflation accelerated for the fifth consecutive month, reaching its highest level since April 2024.
Renewed decline in new business volumes adds to signs that the UK’s economic outlook remains weak, as firms report softening demand conditions. Business confidence has also taken a hit, with expectations for future activity dropping to their lowest level since December 2022.
The most concerning development is the sharp deterioration in employment trends, as service providers cut jobs at the fastest pace in four years. The "twin perils" of shrinking workloads and rising payroll costs has forced many firms to halt recruitment.
Japan’s nominal wage growth surges 4.8% yoy in Dec, real wages rise for second month
Japan’s labor market showed strong wage growth in December, with labor cash earnings surging 4.8% yoy, significantly above expectations of 3.8% yoy and accelerating from 3.9% yoy in the prior month. This marks the 36th consecutive month of annual wage increases.
Regular pay, which includes base salaries, rose 2.7% yoy, while special cash earnings—mainly reflecting winter bonuses—jumped 6.8% yoy, providing an additional boost to workers' disposable income.
Real wages, which adjust for inflation, climbed 0.6% yoy, marking the second straight month of positive growth. This improvement comes despite a notable acceleration in consumer inflation, with the price index used to calculate real wages—excluding rent but including fresh food—rising 4.2% yoy, up from 3.4% yoy in November and reaching the highest level since January 2023.
China’s Caixin PMI services PMI drops to 51.0
China’s Caixin Services PMI slipped to 51.0 in January, down from 52.2 and below expectations of 52.3. PMI Composite also edged lower from 51.4 to 51.1, marking a four-month low, as both manufacturing and services sectors struggled to gain momentum.
According to Caixin Insight Group, while supply and demand conditions showed improvement, services growth lagged behind, pointing to weaker consumer activity.
Wang Zhe, Senior Economist added, "Employment in both sectors fell significantly, and overall price levels remained subdued, particularly factory-gate prices in manufacturing."
New Zealand’s unemployment rate rises to 5.1%
New Zealand’s labor market softened further in Q4, with unemployment rate climbing from 4.8% to 5.1%, in line with expectations and marking the highest level since 2016, excluding the brief spike following the 2020 Covid lockdown.
Employment fell by -0.1% in the quarter, slightly better than the expected -0.2% decline, but still reflecting ongoing weakness in job creation. Meanwhile, wage growth continued to moderate, with the labor cost index rising 0.6% qoq, bringing the annual rate down to 3.3% from 3.8%.
The latest data supports the case for further monetary easing by RBNZ, which remains committed to swiftly bringing the OCR down from the current 4.25% toward neutral level. A 50bps rate cut is still widely anticipated at the upcoming policy meeting this month.
EUR/USD Mid-Day Outlook
Daily Pivots: (S1) 1.0305; (P) 1.0346; (R1) 1.0421; More...
While EUR/USD's recovery from 1.0210 continues today, upside is still limited below 1.0531 resistance. Intraday bias remains neutral and further decline is expected. On the downside, break of 1.0176 will resume whole fall from 1.1213. However, sustained break of 1.0531 will rise the chance of bullish reversal and turn bias back to the upside for stronger rally.
In the bigger picture, immediate focus is back on 61.8 retracement of 0.9534 (2022 low) to 1.1274 (2024 high) at 1.0199. Sustained break there will solidify the case of medium term bearish trend reversal, and pave the way back to 0.9534. However, strong support from 1.0199 will argue that price actions from 1.1274 are merely a corrective pattern, and has already completed.
US ADP jobs beats expectations with 183k gain, led by services
US ADP private employment report showed a stronger-than-expected job gain of 183K in January, surpassing market forecasts of 149K.
Service sector was the clear driver of employment, adding 190K jobs, while goods-producing industries shed -6K positions. By company size, small businesses contributed 39K jobs, medium-sized firms led with 92K, and large corporations added 69K.
Wage growth remained elevated, with annual pay increases for job-stayers at 4.7% yoy, while job-changers saw an even stronger 6.8% yoy rise.
According to Nela Richardson, Chief Economist at ADP, the report reveals a "dichotomy" in the labor market, with consumer-facing industries leading the way, while business services and production lag behind.