
Sample Category Title
Goolsbee warns Fed may struggle to distinguish tariff-driven inflation from overheating
Chicago Fed President Austan Goolsbee cautioned that a "series of new challenges to the supply chain", ranging from natural disasters to trade policy shifts, could create fresh inflationary pressures.
He highlighted the increasing risks from events like tariffs and trade wars, hurricanes, port closures, geopolitical tensions, and labor strikes, all of which could complicate the inflation outlook in 2025.
A key concern for Fed, Goolsbee noted, is differentiating between inflation stemming from economic overheating versus price increases caused by new tariffs. This distinction will be critical in determining the Fed’s policy response.
Goolsbee also compared the current situation to the 2018 trade tensions under President DonaldTrump, noting that while companies previously shifted production out of China, further adjustments could be more challenging this time. The remaining imports from China may be less replaceable.
"In that case, the impact on inflation might be much larger this time," Goolsbee noted.
Separately, Fed Vice Chair Philip Jefferson signaled that the central bank is in no rush to adjust its policy stance as it assesses the economic impact of the Trump administration’s policy policies on tariffs, immigration, deregulation and taxes. "We can be patient and wait to see the net effect of any policy changes by the current administration," he said.
Ethereum Wave Analysis
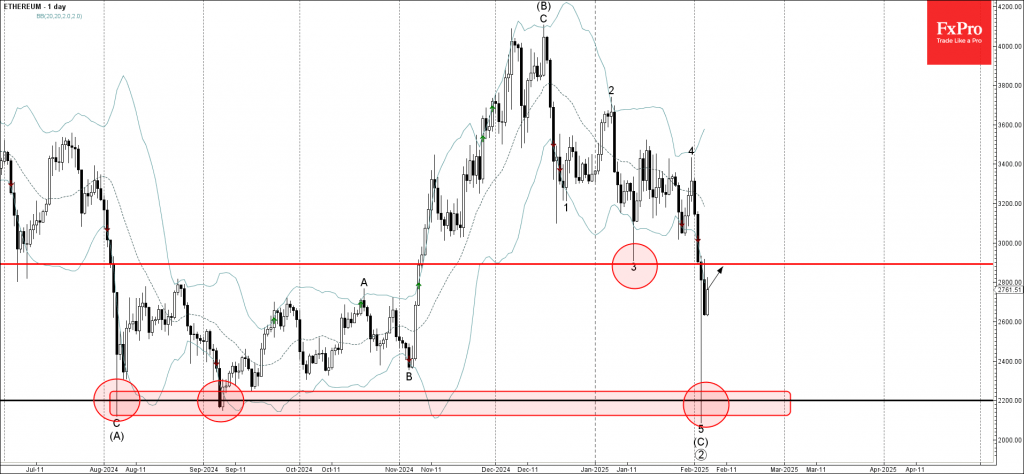
- Ethereum reversed from the key support level 2200.
- Likely to rise to resistance level 2890.00
Ethereum cryptocurrency recently reversed sharply from the key support level 2200.00, which has been reversing the price since the start of August, as can be seen below.
The upward reversal from the support level 2200.00 created the daily Japanese candlestick reversal pattern Hammer.
Ethereum cryptocurrency can be expected to rise to the next resistance level, 2890.00 (the former monthly low from January).
Nasdaq-100 Wave Analysis
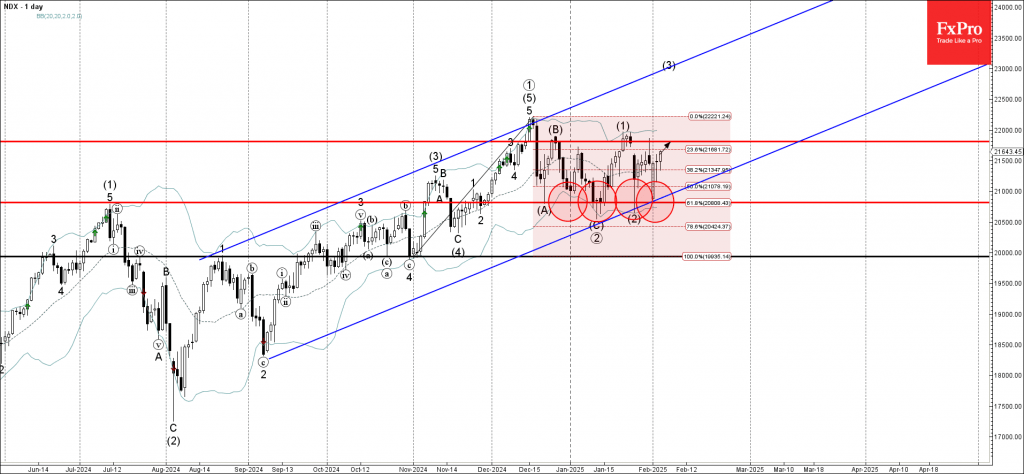
- Nasdaq-100 reversed from pivotal support level 20800.00
- Likely to rise to resistance level 21800.00
Nasdaq-100 index previously reversed up from strongly the pivotal support level 20800.00, which has been steadily reversing the price from the end of December.
The support level 20800.00 was further strengthened by the lower daily Bollinger Band, support trendline of the daily up channel from September and the 61.8% Fibonacci correction of the upward impulse from October.
Given the clear daily uptrend, Nasdaq-100 index can be expected to rise to the next resistance level 21800.00 (top of the previous waves B and 1).
NZDUSD Wave Analysis
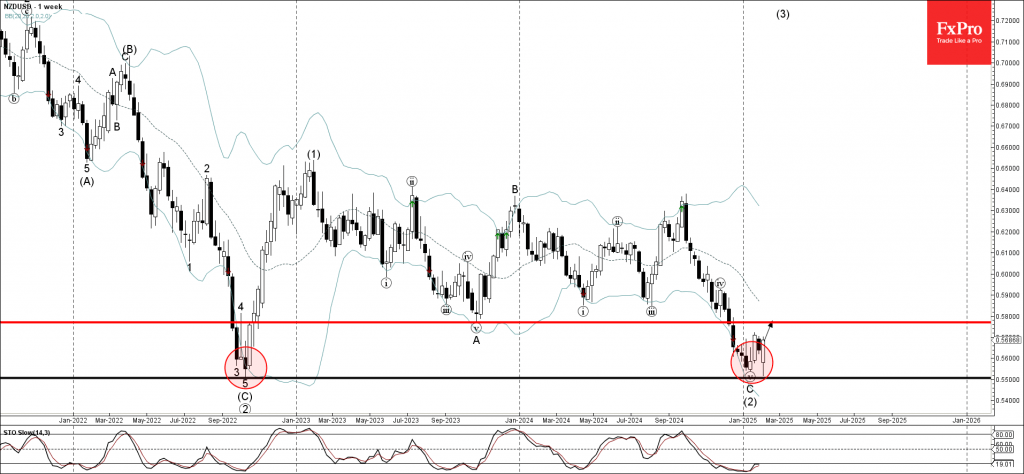
- NZDUSD reversed from strong support level 0.5500
- Likely to rise to resistance level 0.5800
NZDUSD currency pair recently once again reversed up from the strong support level 0.5500, which stopped the previous sharp weekly downtrend at the end of 2022.
The previous upward reversal from the support level 0.5500 created the daily Japanese candlesticks reversal pattern Morning Star – reflecting the strength of the support level 0.5500.
Given the oversold weekly Stochastic, NZDUSD currency pair can be expected to rise to the next resistance level 0.5800.
AUDCHF Technical Analysis
The USDCHF pair continues to drop, trading near 0.9030 on Wednesday as the US Dollar weakens for the third day. The US Dollar Index (DXY) remains under pressure while traders look ahead to Friday’s US job report, which could impact the Federal Reserve’s decisions. Meanwhile, tensions between the US and China have increased, with both countries imposing new tariffs on each other’s goods, boosting demand for the safe-haven Swiss Franc. In other news, Switzerland’s manufacturing sector slightly improved in January but fell short of expectations. Investors are now waiting for Switzerland’s unemployment data on Thursday for more insight into the country’s labor market.
AUDCHF – D1 Timeframe
Technically speaking, when the price breaks out of a consolidation pattern, it often returns to the last broken trendline for a retest. In the case of AUDCHF, on the daily timeframe chart, we see the price currently reaching the trendline resistance. At the moment, the trendline itself overlaps the rally-base-drop of an SBR pattern. This gives the initial basis for bearish intervention.

AUDCHF – H4 Timeframe
The lower timeframe reveals more details regarding the highlighted supply zone on the 4-hour timeframe chart of AUDCHF, with the 76% region of the Fibonacci retracement tool further confirming the likelihood of a bearish outcome. When you compare the lower timeframe condition to the higher price action, the sentiment settles in favor of the bears.
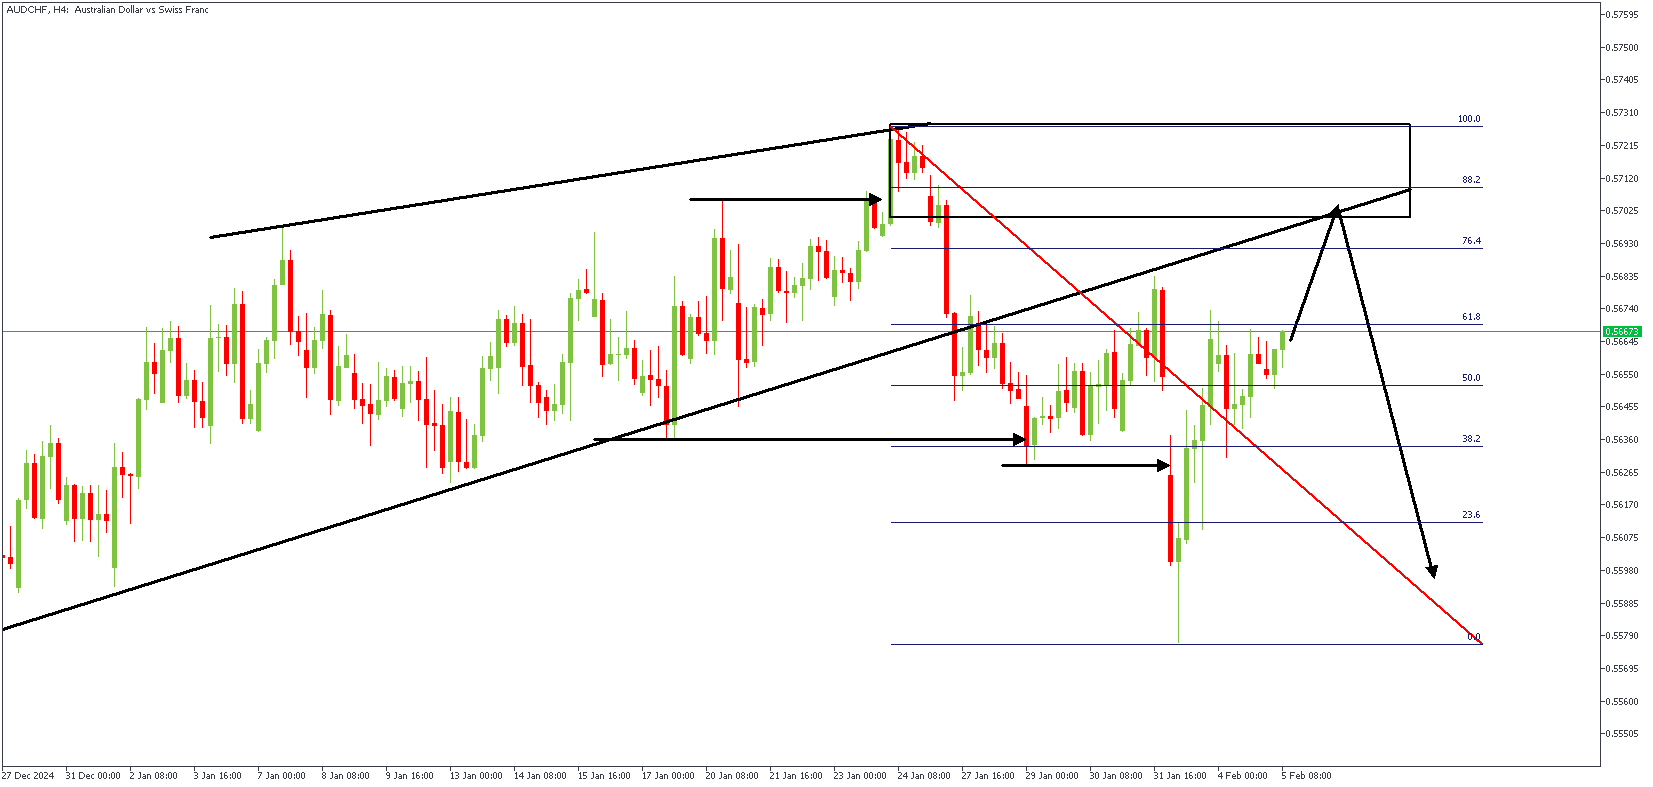
Analyst’s Expectations:
- Direction: Bearish
- Target: 0.56075
- Invalidation: 0.57313
ISM Services Index Falls to Start 2025, But Continues to Signal Hrowth
The ISM Services index fell 1.2 points to 52.8 in January, slightly short of the 54.0 consensus was expecting. However, fourteen industries out of eighteen reported growth, up from nine in December and back in line with November.
Business activity tumbled last month, falling 3.5 points to 54.5, more than giving back last month's improvement and registering its lowest level since August. New order growth also slowed (51.3 vs. 54.4 in December) and, apart from a contraction in June 2024, registering its weakest reading in two years.
The employment sub-index ticked up 52.3, suggesting that payrolls continued to expand in January.
The prices paid sub-component fell sharply (-4.0 points to 60.4). However, when excluding the jump last month, the index is at its highest level since January of last year, suggesting growing price pressures.
Key Implications
Some give back in the services sector to start 2025, but not a bad report on the whole. The share of industries expanding rose last month and employment continued to tick higher. The waning momentum in new demand is a fly in the ointment, but the report cited poor weather conditions as impacting business in January, so there may be room for recovery next month.
The outlook for the rest of the year is clouded by uncertainty. Momentum in the services sector has carried through to the start of 2025, but the prospect of tariffs on inputs continues to loom. Another leg higher in input prices, coupled with a still tight labor market could work to sustain inflationary pressure. All eyes now turn to Friday's update on the labor market.
Riding the Wave: Unveiling the Advantages of Trading Signals
Trading, whether in stocks, forex, or cryptocurrencies, is a complex and often unpredictable endeavor. Success requires a potent mix of market knowledge, analytical skills, disciplined risk management, and, crucially, timely decision-making. In this dynamic landscape, trading signals have emerged as a valuable tool, offering a potential edge to both novice and experienced traders. This article explores the multifaceted advantages of incorporating trading signals into your strategy, examining how they can enhance your trading performance and streamline your decision-making process.
Deciphering the Signal's Allure – Enhanced Decision-Making and Time Efficiency
Trading signals are essentially recommendations or alerts generated by sophisticated algorithms, technical indicators, or seasoned analysts. They suggest specific trading actions, such as buying or selling an asset at a particular price and time. These signals are derived from a variety of data sources, including price charts, market news, economic indicators, and even sentiment analysis. The appeal of trading signals lies in their potential to provide traders with several key advantages.
1. Streamlined Decision-Making:
One of the most significant benefits of trading signals is their ability to simplify the decision-making process. Instead of spending hours poring over charts and analyzing market data, traders can rely on signals to identify potential trading opportunities. This is particularly advantageous for novice traders who may lack the experience or confidence to interpret market data effectively. Signals provide a starting point, a direction, allowing traders to focus on risk management and trade execution rather than getting bogged down in complex analysis
2. Time Efficiency:
Time is a precious commodity, especially for those who juggle trading with other commitments. Analyzing markets and identifying profitable trades can be incredibly time-consuming. Trading signals can significantly reduce the time required for market research and analysis. By providing ready-made trading ideas, signals free up traders to focus on other aspects of their lives, making trading more accessible and manageable
3. Reduced Emotional Bias:
Emotions, such as fear and greed, can often cloud judgment and lead to impulsive trading decisions. Trading signals, particularly those generated by automated systems, can help to mitigate the influence of emotions. By relying on objective data and pre-defined criteria, signals can promote a more rational and disciplined approach to trading
4. Access to Expert Knowledge:
Many trading signals are generated by experienced analysts or professional traders who possess a deep understanding of market dynamics. By subscribing to these signals, traders can effectively tap into the expertise of these professionals, gaining access to insights and strategies they might not otherwise have. This can be particularly beneficial for traders who are still learning the ropes and seeking guidance from more experienced players
5. Learning Opportunities:
Observing and analyzing the signals generated by experienced traders can be a valuable learning experience. By understanding the rationale behind the signals, traders can gain insights into different trading strategies and improve their own analytical skills. This can accelerate the learning curve and help traders develop their own profitable trading systems.
6. Diversification of Strategies:
Trading signals can cover a wide range of assets and trading strategies. This allows traders to diversify their portfolios and explore new markets without having to become experts in each one. For example, a trader might specialize in stock trading but use signals to explore opportunities in the forex or cryptocurrency markets.
Navigating the Signal Landscape – Risks, Due Diligence, and the Path to Success
While trading signals offer numerous advantages, it's crucial to acknowledge that they are not a guaranteed path to riches. Like any trading tool, they come with their own set of risks and require careful consideration
1. No Guarantee of Profit:
Trading signals are merely suggestions, not guarantees. Market conditions can change rapidly, and even the best signals can sometimes lead to losses. It's essential to remember that past performance is not indicative of future results.
2. Risk of Scams and Fraudulent Signals:
The trading signal industry is not immune to scams and fraudulent providers. It's crucial to conduct thorough research and due diligence before subscribing to any signal service. Look for providers with a proven track record, transparent methodology, and verifiable results.
3. Over-Reliance and Lack of Independent Analysis:
Relying too heavily on trading signals without developing your own analytical skills can be detrimental in the long run. It's important to use signals as a supplement to your own analysis, not as a replacement for it. Strive to understand the reasoning behind the signals and develop your own critical thinking skills
4. Cost of Subscription:
Many trading signal providers charge subscription fees, which can eat into your profits. It's important to weigh the cost of the subscription against the potential benefits and ensure that the signals are worth the investment
5. Importance of Risk Management:
Even when using trading signals, risk management remains paramount. Never risk more than you can afford to lose, and always use stop-loss orders to limit potential losses. Diversify your portfolio and avoid putting all your eggs in one basket
6. Finding the Right Signals:
The sheer number of trading signal providers can be overwhelming. It's crucial to find signals that align with your trading style, risk tolerance, and investment goals. Consider factors such as the provider's track record, the types of assets covered, the frequency of signals, and the cost of the subscription.
Conclusion:
A Powerful Tool in the Trader's Arsenal
Trading signals can be a valuable asset for traders of all levels, offering enhanced decision-making, time efficiency, and access to expert knowledge. However, it's crucial to approach trading signals with a healthy dose of skepticism and conduct thorough due diligence before subscribing to any service. By using signals responsibly and in conjunction with your own analysis and risk management strategies, you can leverage their potential to improve your trading performance and increase your chances of success in the dynamic world of trading. Remember, trading signals are a tool, and like any tool, their effectiveness depends on how they are used. The key lies in combining the insights they offer with your own knowledge, discipline, and a well-defined trading plan.
USD/JPY Trading Outlook: Testing Support at 100 & 200-Day MA
- USD/JPY is testing a crucial support level.
- BOJ rate hike expectations are growing on the back of strong data.
- Key support levels are at 151.53 and 150.00, while resistance levels are at 153.91, 155.00, and 156.27.
USD/JPY has found some support following a 150 pip drop during the Asian and early European sessions. The pair has found some support at a key confluence level where both the 100 and 200-day MA rests.
Will we get a break or bounce off this key level?
Japanese PMIs and Fundamental Backdrop
After Tokyo’s core CPI hit 2.5%, the BOJ raised interest rates by 25bps and hinted at more hikes to curb Yen weakness against the Dollar. Since then the Yen has made a steady move higher with another positive coming from the services PMI data which kept growing in January, hitting its highest point since September 2024 and staying in the growth zone for three months in a row. Employment and prices charged also went up, showing strong job conditions and steady inflation ahead.
The Yens renewed strength today however came courtesy of strong wage growth data which further supports Bank of Japan rate hikes moving forward.
Workers’ cash earnings went up more than expected in December, and November’s numbers were revised higher. If Shunto wage talks match last year’s strong results, there is a growing belief that the Bank of Japan might raise interest rates by 25 basis points as early as May.
Economic Data Ahead
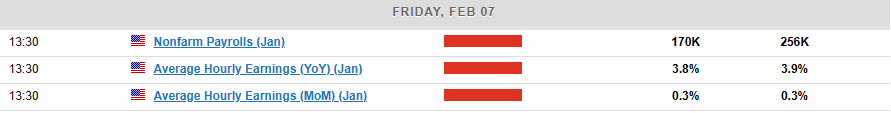
The major data release left for this week will come on Friday with the US NFP jobs report and average earnings data.
There is a possibility that the US jobs market may start to tighten if companies see uncertainties from potential trade wars continue to grow. For now though I do not expect any significant surprise from the NFP data on Friday.
Technical Analysis USD/JPY
From a technical standpoint, USD/JPY is currently trading at a key confluence level where both the 100 and 200-day MAs rest.
A daily candle close below this level could be a precursor for further downside which is further enforced by the growing belief in further rate hikes from the BoJ.
USD/JPY Daily Chart, February 5, 2025
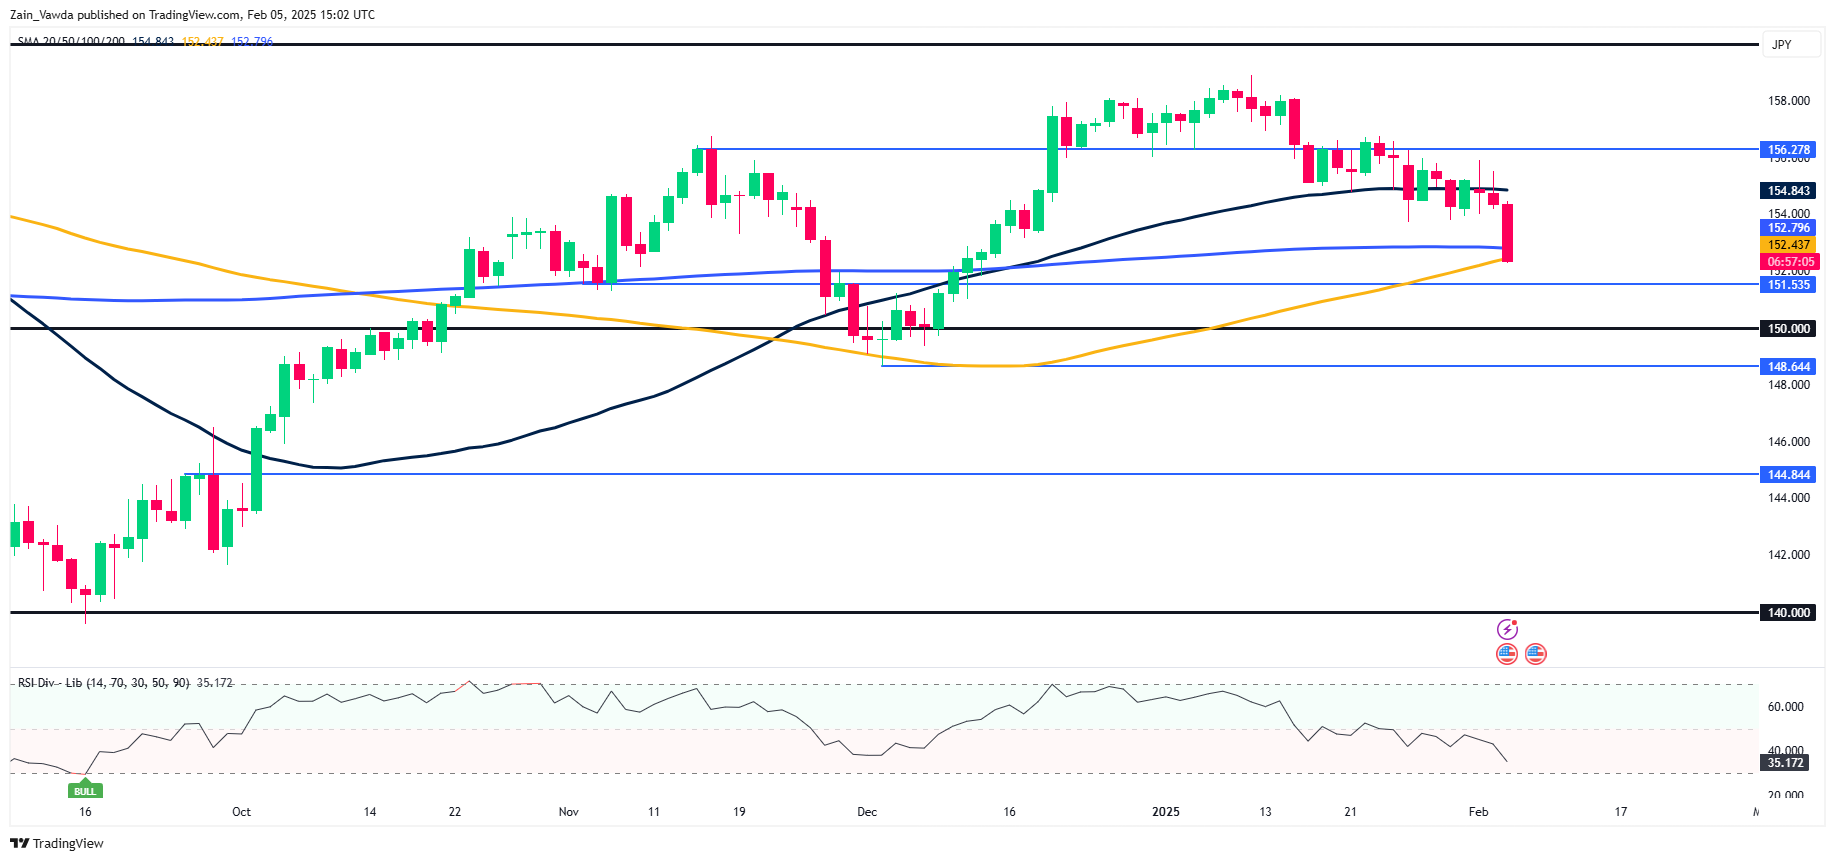
Source: TradingView (click to enlarge)
Dropping down to the four-hour chart (H4) and there is further support which rests at 151.53 before the psychological 150.00 handle comes into focus.
There are some concerns here for bears with the RSI 14-day on the H4 chart in oversold territory.
Also from a price action perspective, the selloff was quick and does leave the pair with a possibility of a short term pullback toward immediate resistance at 153.911 before the 155.00 handle comes back into view.
USD/JPY Four-Hour (H4) Chart, February 5, 2025
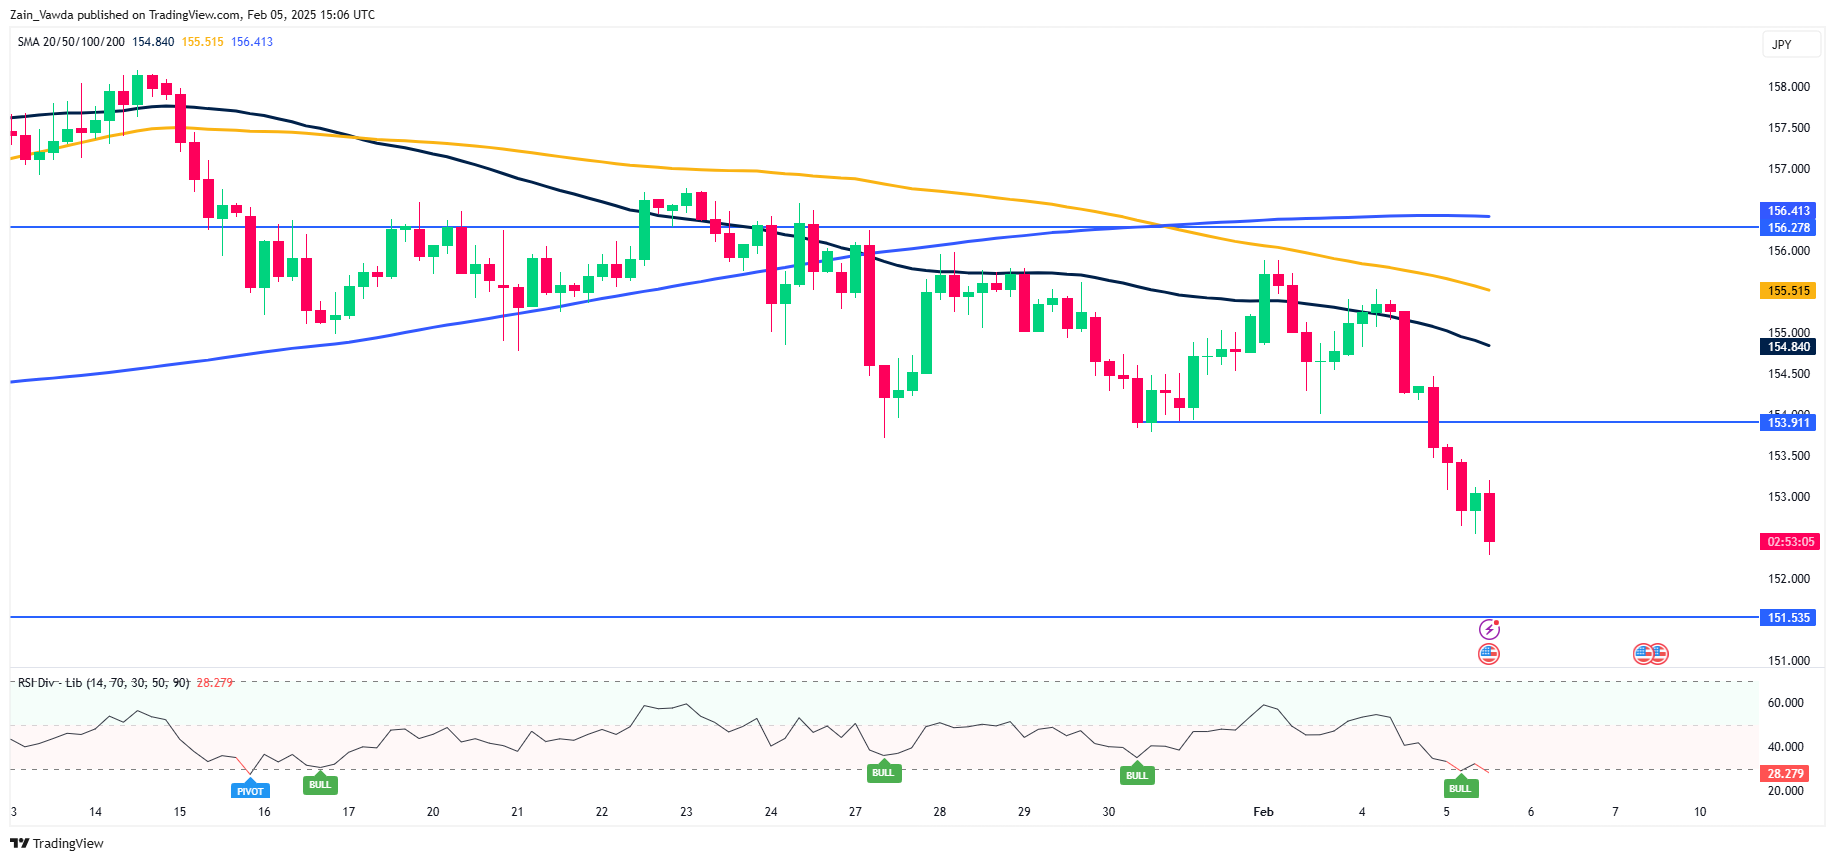
Source: TradingView (click to enlarge)
Support
- 151.53
- 150.00 (psychological level)
- 148.64
Resistance
- 153.91
- 155.00
- 156.27
ECB’s Lane: Exiting restrictive policy requires wider considerations than neutral rate
ECB Chief Economist Philip Lane emphasized the need for a balanced approach in the easing cycle, advocating a measured pace to avoid either stifling economic growth or fueling excessive inflation.
He highlighted that a "middle path is appropriate," ensuring that policymakers do not lean too heavily on either upside or downside risks.
Lane reiterated the importance of maintaining flexibility, stressing that the ECB must "maintain agility" in its decision-making, relying on incoming data and a meeting-by-meeting assessment rather than committing to a predefined rate path.
The economist also pointed out that determining the appropriate level of monetary restrictiveness is complex and involves multiple factors beyond just policy rates.
He outlined nine key elements, including the transition from cheap debt refinancing to higher rates, the forward-looking impact of expected rate cuts, global term premium pressures, evolving bank lending conditions, and the overall response of consumption and investment to shifting monetary policy.
This multi-faceted assessment indicated that ECB rate decisions will be guided by a broader set of financial and economic indicators.
It "cannot be summarised by a single indicator such as comparing the prevailing policy rate to a highly-uncertain estimate of the so-called neutral rate," Lane emphasized.
Full speech of ECB's Lane here.