Sample Category Title
EUR/JPY Elliott Wave Analysis
EUR/JPY - 133.76
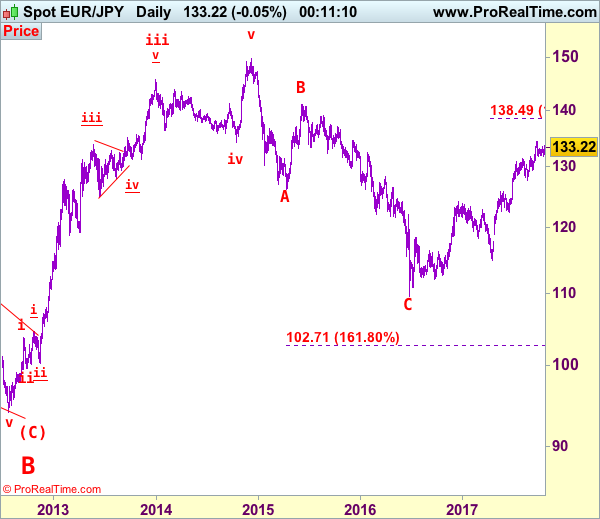
Although the single currency traded marginally low to 131.66 earlier this week, renewed buying interest emerged there and has rebounded, suggesting pullback from 134.41 has possibly ended there and consolidation with upside bias is seen for gain to 134.00 but break of said resistance is needed to confirm recent upmove has resumed and extend further gain to 135.00, having said that, loss of upward momentum should prevent sharp move beyond 136.00-10 and reckon 136.95-00 would hold, price should falter well below 138.45-50 (1.618 times extension of 109.49-124.10 measuring from 114.85).
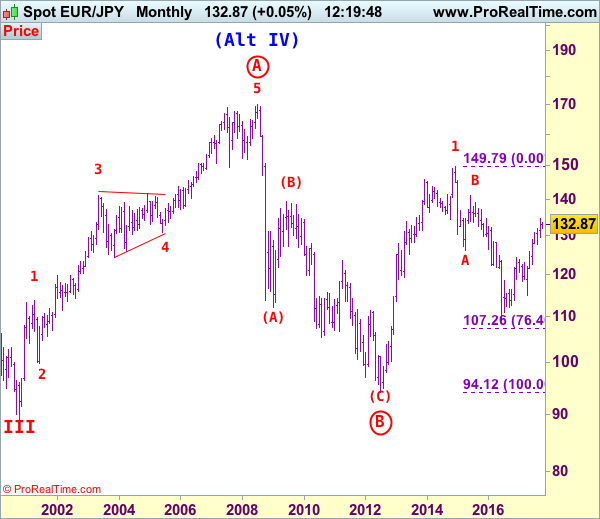
The daily chart is labeled as attached, early selloff from 169.97 (July 2008) to 112.08 is wave (A) of B instead of end of entire wave B and then the rebound from there to 139.26 is wave (B), hence, wave (C) has possibly ended at 94.12 with a diagonal triangle as labeled in the daily chart, hence upside bias is seen for further gain. Recent rally above indicated retracement level at 116.69 (50% Fibonacci retracement of the intermediate fall from 139.26-94.12) adds credence to this view and signal major reversal has commenced but first leg of this wave C has possibly ended at 149.79, hence wave 2 has commenced with wave A ended at 126.09, followed by wave B at 141.06, wave C commenced and could have ended at 109.49, indicated upside targets at 126.00 and 130.00 had been met and further gain to 135.00 would follow.
On the downside, whilst initial pullback to 132.45-50 cannot be ruled out, reckon 132.00 would contain downside and bring another rise later. A daily close below said support at 131.66 would suggest a temporary top is formed, bring retracement of recent rise to 131.00 and possibly test of support at 130.62 but downside should be limited to 130.00 and strong support at 129.37 should remain intact, bring another upmove later.
Recommendation: Buy again at 132.50 for 135.00 with stop below 131.50.
To re-cap the corrective upmove from the record low of 88.93 (18 Oct 2000), the wave A from there is subdivided as: 1:88.93-113.72, 2:99.88 (1 Jun 2001), 3:140.91 (30 May 2003), 4:124.17 (10 Nov 2003) and 5 ended at record high of 169.97 (21 Jul 2008). The brief but sharp selloff to 112.08 is viewed as a-b-c x a-b-c wave (A) of B. The subsequent rebound to 139.26 is (B) of B and (C) of (B) has possibly ended at 94.12 and in any case price should stay well above previous chart support at 88.93, bring rally in larger degree wave C towards 150.00.
USD/CHF Elliott Wave Analysis
USD/CHF – 0.9754
The greenback met resistance at 0.9837 again and has retreated, retaining our view that further consolidation below this level would be seen and another test of support at 0.9705 (last week’s low) cannot be ruled out, below there would bring retracement of the rise from 0.9421 low to 0.9670, then 0.9642 support, however, reckon downside would be limited to 0.9565 support and bring another rise later. A break of said resistance at 0.9837 would add credence to our view that low has been made at 0.9421 and the rise from there may extend further gain to previous support at 0.9859, then 0.9900, having said that, overbought condition should limit upside and price should falter well below psychological resistance at 1.0000, bring another decline later.
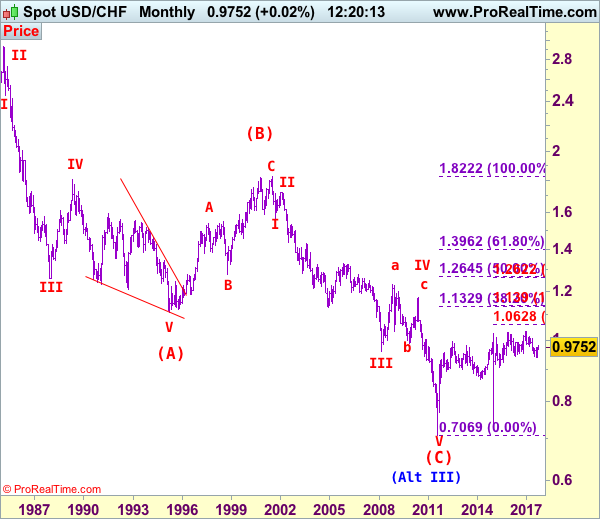
Our preferred count on the daily chart is that early selloff to 0.9630 is an end of the larger degree wave III and major correction is unfolding from there with a leg ended at 1.2298 (Nov 2008 with (a): 1.0625, (b):1.0011 and (c):1.2298), wave b ended at 0.9910 with (a): 1.0370, (b): 1.1967, (c): 0.9910. The rise from there to 1.1730 is the wave c which also marked the end of wave IV and wave V has possibly ended at 0.7068.
On the downside, whilst initial pullback to 0.9705 and 0.9645-50 is likely, reckon downside would be limited to said support at 0.9565 and bring another rise later. Below 0.9525-30 would risk weakness to 0.9490-00 but still reckon downside would be limited to 0.9455-60 and said support at 0.9421 should remain intact, bring another rebound later. A drop below said support at 0.9421 would extend recent decline from 1.0344 top (formed back in late 2016) to 0.9350 and possibly 0.9300, however, loss of downward momentum should prevent sharp fall below 0.9250-60 and 0.9200-10 should hold.
Recommendation: Buy at 0.9575 for 0.9775 with stop below 0.9475.
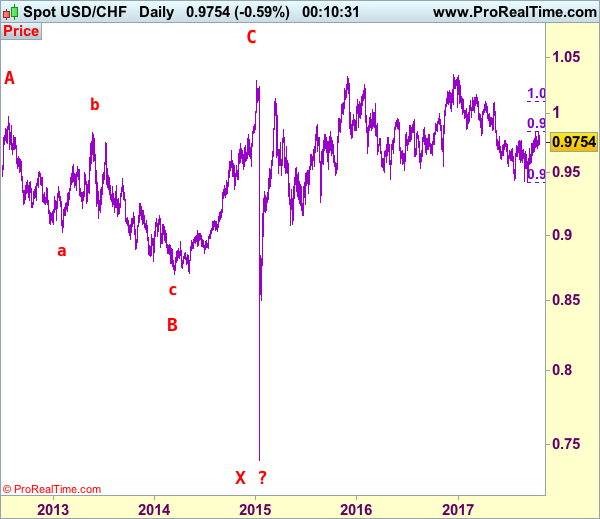
Dollar's long-term downtrend started from 2.9343 (Feb 1995) and it was unfolding as a (A)-(B)-(C) with (A): 1.1100, (B): 1.8310 (26 Oct 2000), then followed by another impulsive wave (C) with wave III ended at 0.9630 (Mar 2008). Under this count, correction in wave IV has possibly ended at 1.1730 and wave V already broke below support at 0.9630 and met indicated downside target at 0.7500 and 0.7400. The reversal from 0.7068 suggests the wave V has possibly ended and the breach of resistance at 0.9595 add credence to this view and indicated upside target at 1.0000 had been met, however, the sharp retreat from 1.0296 to 0.7401 suggests choppy trading would be seen but price should stay above said record low at 0.7068.
Technical Outlook: USDCHF Probes Above 200SMA After Bulls Regained Control
The USDCHF pair probes above 200SMA (0.9815) on Friday on fresh strength after significant fall the day before.
Repeated failure at 200SMA in past two days resulted in dip to 0.9736 on Thursday, which was contained by rising 20SMA.
Sudden fall on Thursday caught off-guard many traders who were long and forced them out, with repeated rejection at 200SMA and subsequent bearish acceleration, seen as strong bearish signal.
However, bullish structure on daily chart is expected to remain intact while rising 20SMA track the uptrend, with eventual close above 200SMA seen as strong bullish signal for extension of broader uptrend from 0.9420 (08 Sep low).
Lift above weekly 100SMA (0.9846) is needed to confirm bullish continuation.
Conversely, repeated failure to close above 200SMA would be negative signal.
Res: 0.9847, 0.9870, 0.9966, 0.9990
Sup: 0.9815, 0.9777, 0.9747, 0.9704
Buy The Dip Mentality Alive And Well As Tax Reform Hurdle Is Passed
- Trump tax plans add support to already convincing stock market rally;
- IBEX lags behind as Madrid moves to impose direct rule over Catalonia;
- GBP jumps on optimistic May comments after meeting with EU-27.
US equity markets are on course to open higher on the final trading day of the week, having recovered strongly following a tough start on Thursday to end the day in the green.
The buy the dip mentality is alive and well, with traders clearly not willing for markets to drop even a little before pushing them higher once again. The passing of the budget resolution through the Senate late on Thursday is likely helping lift sentiment further today, with final approval in the House being a big step towards Donald Trump's long awaited tax reform being enacted.
As Steve Mnuchin made clear this week, a portion of the rally in equity markets since Trump's election victory in November was driven by the expectation that tax reform will happen and provide a significant boost to the economy and companies. A failure to deliver on this would be a huge blow to Trump and could be damaging for markets as well, although this now looks increasingly less likely.
In Europe, the Spanish IBEX is once again lagging behind its peers and is the only major index to trade in the red. Prime Minister Mariano Rajoy is believed to be planning to convene a special cabinet meeting this weekend to begin the procedure of suspending Catalonia's autonomy, with the Senate possibly voting on imposing direct rule next week. The unrest that will likely follow could further unsettle investors in Spanish assets.
The pound has been given a minor boost this morning by optimistic comments from Prime Minister Theresa May following her meeting with the EU-27. May's acknowledgement that the UK will honour its financial commitments to the EU while claiming her counterparts will consider a vision for a future partnership is a small step forward in negotiations that has seemingly failed to be achieved in discussions between David Davis and Michel Barnier.
As we head into the end of the week, there isn't too much on the agenda. Canadian retail sales and inflation numbers stand out as the key data releases while we'll also get existing home sales figures from the US. The Fed's Loretta Mester is due to speak on regulation but her comments will be followed in case the conversation moves to monetary policy as it sometimes can. The yen is slipping a little as Japan prepares to head to the polls this weekend, with Prime Minister Shinzo Abe looking to solidify his position in the face of weak opposition, something that looks likely but also has a UK feel to it. And we all remember how that worked out.
Trade Idea: GBP/USD – Target met and stand aside
GBP/USD – 1.3167
Original strategy :
Sold at 1.3315, met target at 1.3115,
Position: - Short at 1.3315
Target: - 1.3115
Stop: -
New strategy :
Stand aside
Position: -
Target: -
Stop:-
Sterling dropped again after meeting renewed selling interest at 1.3229 yesterday, our short position entered at 1.3315 met downside target at 1.3115 with 200 points profit, however, as cable has recovered again after falling to 1.3088 earlier today, suggesting consolidation would be seen and recovery to 1.3200 cannot be ruled out, however, reckon said resistance at 1.3229 would hold, bring another decline, below said support at 1.3088 would revive bearishness for resumption of recent decline towards recent low at 1.3027.
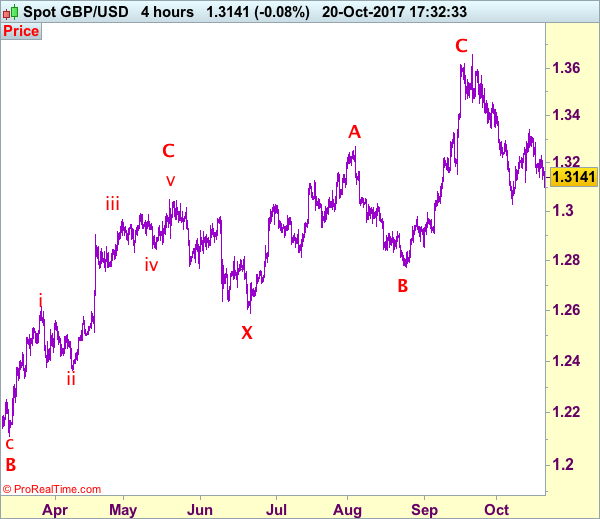
As we have taken profit on our short position entered at 1.3315, would not chase this fall here and would be prudent to stand aside for now. Above minor resistance at 1.3229 would prolong consolidation and bring another bounce to 1.3280-85 but indicated resistance at 1.3338 should hold from here, bring another decline. In the unlikely event sterling breaks above resistance at 1.3338, this would signal low has been formed at 1.3027 instead, bring at least a correction of the fall from 1.3658 top to 1.3390-00 later. Our preferred count is that (pls see the attached chart) the wave IV is unfolding as a complex double three (ABC-X-ABC) correction with 2nd wave B ended at 1.2774, hence 2nd wave C could have ended at 1.3658.
Our preferred count on the daily chart is that cable's rebound from 1.3500 (wave (A) trough) is unfolding as a wave (B) with A ended at 1.7043, followed by triangle wave B and wave C as well as wave (B) has ended at 1.7192, the subsequent selloff is the larger degree wave (C) which is still unfolding with minor wave (III) of larger degree wave 3 ended at 1.1986, hence wave (IV) correction is in progress which could either be a triangle wave (IV) of a complex formation but upside should be limited to 1.3500 and price should falter well below 1.4000, bring another decline in wave (V) of 3 for weakness to 1.1500, then 1.1200.
DAX Rebounds On Stronger German Inflation
The DAX has recorded slight gains on Friday, erasing the losses which marked the Thursday session. Currently, the index is at 13,024.00 up 0.24% on the day. On the release front, German PPI gained 0.3%, beating the estimate of 0.1%. In the eurozone, the current account surplus jumped to EUR 33.3 billion.
The crisis in Catalonia continues, as tensions remains palpably high. The saga continues on Saturday, as the Spanish government is expected to implement Article 155 of the Constitution, which allows for the suspension of Catalonia’s autonomy and direct rule from Madrid. This hard-line approach is in response to the refusal of the Catalan government to comply with a deadline to withdraw its declaration of independence. However, Article 155 has never been triggered before, and it’s not clear what exact measures the central government will take. With emotions near the breaking point, the Spanish government will not want to proceed carefully so as to avoid further unrest. The crisis has already taken an economic toll. Many large companies are moving their headquarters from Barcelona to Madrid and tourism to Catalonia has slipped 15 percent since the crisis began two weeks ago. The Spanish stock market was lower on Thursday, and this dragged down the DAX as well.
Prime Minister Theresa May addressed European Union leaders on Thursday in Brussels. May is hoping to break the deadlock in the talks, but she is facing pressure from some cabinet ministers to simply walk away from Europe. May told the 27 EU leaders that she is confident the two sides can bridge the gaps, but she needs to reach a deal that she can sell back home. One key issue in dispute is the amount of Britain’s exit bill, with the Europeans looking at a bill of EUR 60 billion, and the British reportedly prepared to pay just EUR 20 billion. Other issues with a significant gap include the border with Northern Ireland and the jurisdiction of the European Court of Justice on EU citizens living in Britain. Without some flexibility from both sides, the talks could remain deadlocked and take a toll on both the euro and the British pound.
Euro Under Pressure Over Brexit, Catalonia Worries
The euro has posted losses in the Friday session. Currently, EUR/USD is trading at 1.1804, down 0.40% on the day. On the release front, German PPI gained o.3%, beating the estimate of 0.1%. In the eurozone, the current account surplus jumped to EUR 33.3 billion. Over in the US, Existing Home Sales is expected to slow to 5.30 million, and Federal Reserve Chair Janet Yellen will deliver remarks at an event in Washington.
The Catalonia crisis enters a new phase on Saturday. The Spanish government is expected to implement Article 155 of the Constitution, which allows for the suspension of Catalonia’s autonomy and direct rule from Madrid. This is in response to the refusal of the Catalan government to comply with a deadline to withdraw its declaration of independence. However, this clause has never been triggered before, and it’s not clear what exact measures the central government will take. With emotions near the breaking point, the Spanish government will not want to be seen as repressing Catalonia so as to avoid further unrest. The crisis has already taken an economic toll. Many large companies are moving their headquarters from Barcelona to Madrid, and tourism to Catalonia has slipped 15 percent since the crisis began two weeks ago. The Spanish stock market was lower on Thursday, and this dragged down the German DAX and French CAC indexes as well.
European Union leaders are in Brussels for a two-day meeting. On Thursday, British Prime Minister May addressed the group, pleading for progress in the deadlocked Brexit talks. May is facing pressure from some British lawmakers to simply walk away from Europe, and she reminded the 27 EU leaders that she needs to reach a deal that she can sell back home. The EU leaders will reconvene on Friday without May, and are expected to tell her that more progress must be made before the EU is willing to discuss a post-Brexit trade relationship with the UK. The Europeans want to see more progress on the amount of Britain’s exit bill, the border with Northern Ireland and the jurisdiction of the European Court of Justice on EU citizens living in London. There are significant gaps on all three of these issues, and compromises will have to be hammered out if the talks are to move forward.
Technical Outlook: Copper – Reversal Pattern Is Forming On Daily Chart And Signaling An End Of Correction
Copper future contract for December delivery is firmer on Friday and probed above $3.2000 barrier after three-day pullback was contained by rising Tenkan-sen at $3.1375.
Reversal pattern is forming on daily chart after Thursday's action ended in long-legged Doji, signaling that pullback on profit-taking is running out of steam, with fresh strength on Friday completing the pattern.
Recovery rally so far retraced over 50% of pullback from fresh three-year high at $3.2580 to $3.1375 and needs close above minimum $3.1835 (Fibo 38.2% of $3.2580/$3.1375) to generate stronger bullish signal.
Broader bulls remain intact after correction and favor fresh upside, as metal is on track for the third consecutive strong weekly rise.
Rising daily Tenkan-sen continues to underpin (currently at $3.1420), with alternative scenario requiring break here and $3.1375 correction low, to risk deeper correction.
Res: 3.2090, 3.2120, 3.2415, 3.2580
Sup: 3.1625, 3.1420, 3.1375, 3.1186
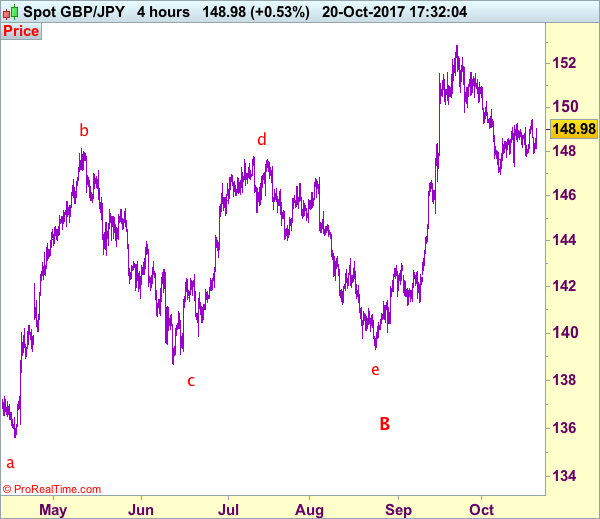
Trade Idea: GBP/JPY – Stand aside
GBP/JPY - 149.00
New strategy :
Stand aside
Position: -
Target: -
Stop:-
Despite retreating to 147.95, as sterling has rebounded again after holding above previous support at 147.80, retaining our view that further choppy consolidation would be seen and test of resistance at 149.40 cannot be ruled out, break there would signal the erratic rise from 146.95 is still in progress for retracement of the fall from 152.85 to 149.90-00 and possibly test of resistance at 150.25 but still reckon upside would be limited to 150.90-00 and bring another decline later.
On the downside, only a break below said support at 147.80 would shift risk to downside and signal the rebound from 146.95 has ended, bring weakness to another previous support at 147.30, below would confirm and then retest of 146.95 would follow. Looking ahead, once this level is penetrated, this would confirm the fall from 152.85 top has resumed for retracement of recent upmove to 146.60-65 and then 146.00, having said that, loss of momentum should limit downside and previous support at 145.25 should remain intact.
Our preferred count is that larger degree wave V with circle is unfolding from 251.12 with wave (I) 219.34, (II): 241.38 and wave (III) is subdivided into 1: 192.60, 2: 215.89 (23 Jul 2008) and wave 3 ended at 118.87 earlier in 2009. The correction from there to 162.60 is wave 4 which itself is a double three and is labeled as first a-b-c ended at 151.53, followed by wave x at 139.03, 2nd a ended at 162.60, 2nd b at 146.75 and 2nd c leg of wave 4 ended at 163.00. Therefore, the decline from 163.00 to 116.85 is now treated as wave 5 which also marked the end of larger degree wave (III), hence wave (IV) major correction has commenced for retracement of the wave (III) from 241.38 and upside target at 183.95-00 (50% Fibonacci retracement of the wave (II) from 241.38) had been met, a drop below 160.00 would suggest wave (IV) has ended at 195.85, bring decline in wave (V) for initial weakness to 130 (already met) and 120.
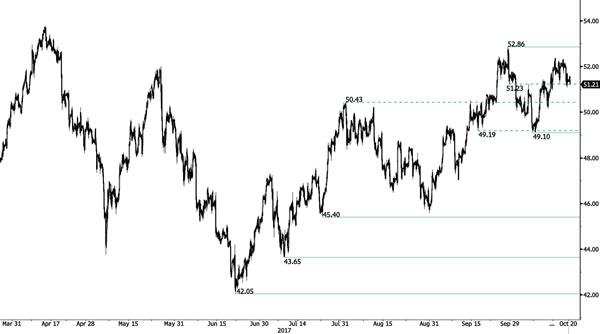
CRUDE OIL Resting On 51.23 Support
Crude oil is consolidating in range defined by the support at 50.43 and the strong resistance lies at 52.86 (28/09/2017). Expected to show continued increase within this range.
In the long-term, crude oil has recovered after its sharp decline last year. However, we consider that further weakness are very likely. For the time being the pair lies in an upside momentum. Strong support lies at 35.24 (05/04/2016) while resistance can now be found at 55.24 (03/01/2017 high).