Sample Category Title
EUR/USD Fading Momentum
EUR/USD failed to test resistance at 1.1878 (12/10/2017 high). Strong support is given at a distance at 1.1662 (17/08/2017 low). Expected to show some short-term consolidation.
In the longer term, the momentum is now turning largely positive. We favour a continued bullish bias. Key resistance is holding at 1.2252 (25/12/2014 high) while strong support lies at 1.0341 (03/01/2017 low).
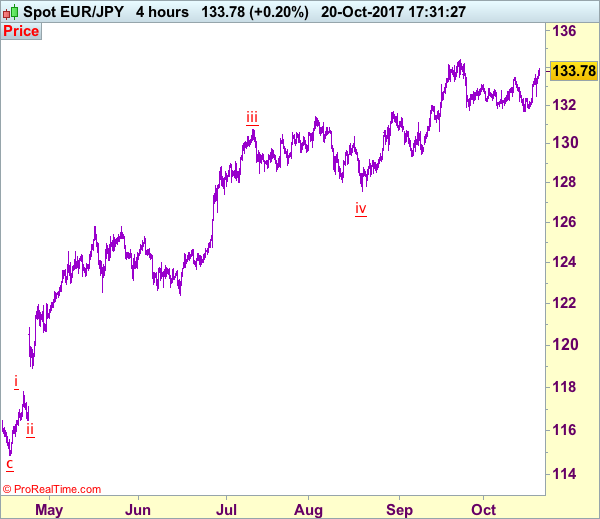
Trade Idea: EUR/JPY – Buy at 133.30
EUR/JPY - 133.76
New strategy :
Buy at 133.30, Target: 135.30, Stop: 132.70
Position: -
Target: -
Stop:-
As the single currency found renewed buying interest at 132.47 yesterday and has rallied again, reviving bullishness and signal early correction form 134.41 has ended at 131.66 earlier this week, hence consolidation with upside bias is seen for gain to 134.00, then retest of 134.41, however, break of said resistance is needed to confirm early upmove has resumed and extend headway to 135.00-10 and later towards 135.50-60.
In view of this, would not chase this rise here and would be prudent to buy euro on pullback as 133.25-30 should limit downside. Only below saids support at 132.47 would abort and prolong choppy trading, risk weakness to 132.00, having said that, strong support at 131.66 should remain intact, bring another rebound later.
Our latest preferred count is that wave (ii) is ABC-X-ABC which ended at 123.33 and wave (iii) is unfolding with wave iii ended at 100.77, followed by wave iv at 111.57 and wave v as well as the wave (iii) has ended at 97.04, followed by wave (iv) at 111.43 and wave (v) has ended at 94.12 which is also the end of the larger degree v, this also implied the major wave (C) has also ended there, hence major correction has commenced from there with (A) leg unfolding in its lower degree wave c which has possibly ended at 145.69. Under this count, A-B-C wave (B) has commenced with A leg ended at 136.23, wave B at 143.79 and wave C has possibly ended at 149.79.
Our larger degree count is that the decline from 139.26 is wave (C) and is sub-divided into a diagonal triangle i-ii-iii-iv-v with wave i - 105.44, wave ii- 123.33, wave iii - 97.03, wave iv - 111.43, followed by the final wave v as well as the end of wave (C) at 94.12, this also mark the bottom of larger degree wave B. Under this count, major rise in wave C has commenced as an impulsive wave with minor wave III ended at 145.69, wave V is still in progress for further gain to 150.00. Having said that, this so-called wave V could well be the first leg of larger degree 5-waver wave C and this wave C should bring at least a retest of wave A top at 169.97 (July 2008).
US Dollar Roller Coaster Heads Up
USD bounces back as US yields recover
It is Friday and the US dollar is going up. The greenback has been going on a roller coaster over the past five days as the immediate outlook is quite opaque. In the US, the dollar has been able to hold ground so far, thanks to buoyed optimism regarding Trump tax reform. This is not a done deal yet, however this is the first since the beginning of Trump's mandate that he'll be able - or at least he has the odds on his side for once - to pass one of its campaign promises. Big time. Yesterday evening the Senate made a significant step toward the tax reform. This is good news for the greenback, however we believe it is not time to put all your chips on the dollar as many uncertainties remains. To name just a few ones: although the Fed will most likely hike rate in December, there are speculations that next year rate path will be less aggressive than initially anticipated, then the potential nomination of a new Fed Chair could impact significantly the Fed future monetary policy, finally Trump's efforts to implement his campaign promises have faced a fierce resistance from US politicians.
The US dollar surged across the board this morning. The green back rose 0.45% against the single currency, 0.20% against the pound sterling, 0.50% against the Aussie and another 0.70% against the Kiwi. The upward shift of the entire US yields definitely helped lifting the greenback, especially on the short-end of the curve as longer maturity treasury yields rose marginally. The monetary policy sensitive 2-year treasury yield bounced back to 1.5635% on Friday, while the 10-year yield edged up to 2.3680%. Overall, we remain bullish dollar, however the short-term environment could be full of surprise, meaning one has to be patient before loading long USD position
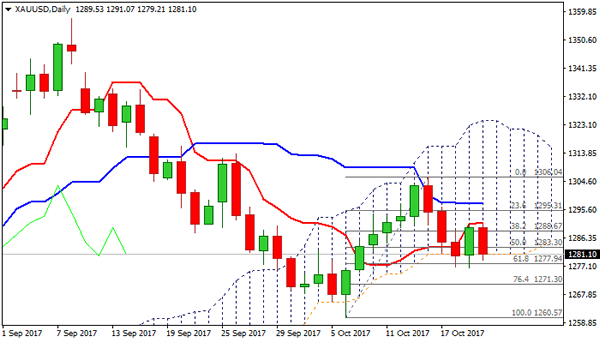
Technical Outlook: SPOT GOLD – Fresh Bears Probe Again Below Daily Cloud
Spot Gold is back to red on Friday and probes again below daily Ichimoku cloud base after strong recovery rally on Thursday and Friday’s attempts higher were capped by daily Tenkan-sen at $1291.
Fresh bears are testing cloud base ($1281) again after attempts in past two days dipped to $1276 but failed to close below cloud base which acted as strong support.
Sustained break below cloud base and next strong hurdles at $1277/75 (Fibo 61.8% of $1260/$1306 / 100SMA) would generate strong bearish signal for extension of bear-leg from $1306 towards next key supports at $1260/57 (06 Oct low / 200SMA).
Bearishly aligned daily techs and stronger dollar are supportive for further easing of yellow metal’s price.
Broken 20SMA offers initial resistance at $1285, with 10SMA ($1289) expected to cap upticks.
Res: 1285, 1289, 1291, 1297
Sup: 1277, 1275, 1271, 1266
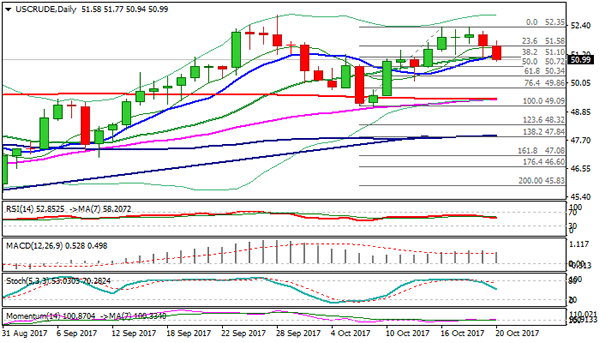
Technical Outlook: US CRUDE OIL – Break Below $51.10 To Signal Deeper Correction
WTI oil extends weakness on Friday and retests key near –term support at $51.10 (Fibo 38.2% of $49.09/$52.35 / 20SMA) which contained attack on Thursday.
Yesterday's trading ended in red despite strong downside rejection at $51.10 and subsequent bounce, with fresh easing today, signaling reversal.
Scenario needs close below $51.10 for confirmation, with south-heading daily indicators showing space for further bearish extension.
Firm break below $51.10 would open supports at $50.72 (50% retracement) and $50.34 (Fibo 61.8%) and risk extension towards psychological $50.00 support on break of the latter.
The move is seen as correction of larger uptrend which is well supported by growing signs of oil market rebalancing and repeated crude inventories draws.
Extended corrective action should stay above $50 to keep bulls intact for fresh attempts higher.
Res: 51.10, 51.77, 52.16, 52.35
Sup: 50.72, 50.34, 50.00, 49.86
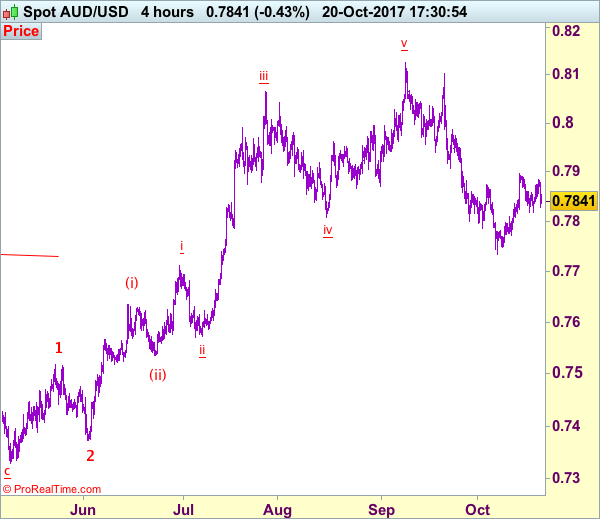
Trade Idea: AUD/USD – Hold short entered at 0.7875
AUD/USD – 0.7841
Original strategy:
Sold at 0.7875, Target: 0.7700, Stop: 0.7900
Position: - Short at 0.7875
Target: - 0.7700
Stop:- 0.7935
New strategy :
Hold short entered at 0.7875, Target: 0.7700, Stop: 0.7890
Position: - Short at 0.7875
Target: - 0.7700
Stop:- 0.7890
Aussie’s near term sideways trading is likely to continue and as long as indicated resistance at 0.7897 (last week’s high) holds, prospect of another retreat remains, below support at 0.7818 would retain bearishness and bring weakness to 0.7800, break there would add credence to our view that top has been formed at 0.7897, bring test of 0.7770-75, then retest of said support at 0.7733, below there would signal recent fall from 0.8125 top has resumed for weakness to 0.7700-10 and later towards 0.7660-65.
In view of this, we are holding on to our short position entered at 0.7875. Only above previous support at 0.7908 (now resistance) would defer and risk a stronger rebound to 0.7950 but resistance at 0.7986 should remain intact and bring another decline later.
On the 4-hour chart, recent upmove from 0.7329 is unfolding as an impulsive rise with wave 3 as well as smaller degree wave (iii) extending, only minor wave v of (iii) has ended at 0.8125, hence bullishness remains for this move to extend headway to 0.8200, then towards 0.8300, however, reckon upside would be limited to 0.8400 and the final wave 5 should falter below 0.8500, bring correction later.
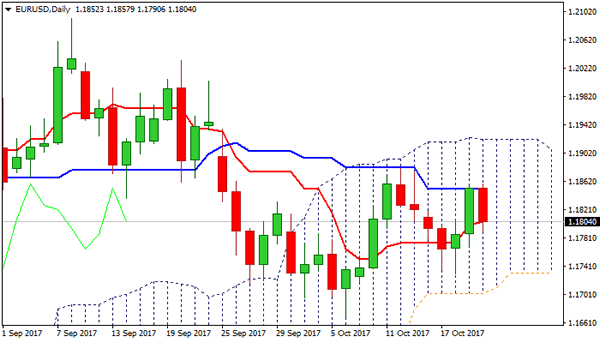
Technical Outlook: EURUSD Eases After Kijun-Sen Repeatedly Capped
The Euro eased below 1.1800 on Friday after repeated failure to clear daily Kijun-sen at 1.1851.
Fresh weakness retraced the largest part of Thursday's strong rally, questioning strong two-day recovery from 1.1730 and requiring stronger signal for break out of this week's 1.1730/1.1858 range.
Mixed signal from daily studies also do not provide clear near-term direction signal.
Upbeat EU Current Account numbers (33.3 B surplus vs 26.2B f/c) in August did not provide support to Euro, with focus turning towards US housing data, due later today, for fresh signals.
Catalonia remains in focus, with the outcome of Spain cabinet's meeting on Saturday, regarding decision of suspending Catalonia's autonomy which could have stronger impact on the single currency.
Res: 1.1858, 1.1879, 1.1921, 1.1931
Sup: 1.1790, 1.1767, 1.1730, 1.1711
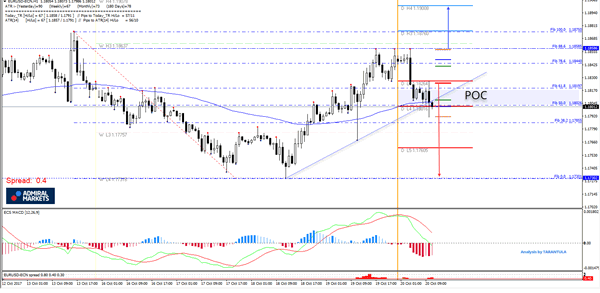
EURUSD Triple Top At 88.6 Fib
The EUR/USD has formed a triple top pattern exactly at 88.6 fib of the major H1 swing. USD/JPY strength that I have presented as a trading idea on my yesterday's webinar moved the EUR/USD first to the upside then rejection happened due to negative correlation. However the EUR/USD has reached 1.1858 and only momentum above this triple top can move the price further to 1.1876 and 1.1900. At this point the price is breaking 1.1800 support and the further rejection from this POC zone (61.8, D L4,EMA 89, trend line) 1.1800-20 could tank the price towards 1.1790, 1.1760 and 1.1730. It is important to watch these levels because the EUR/USD has already made its full ATR projection and should move further on profit taking momentum as it is Friday.
W L3 - Weekly Camarilla Pivot (Weekly Interim Support)
W H3 - Weekly Camarilla Pivot (Weekly Interim Resistance)
W H4 - Weekly Camarilla Pivot (Strong Weekly Resistance)
D H4 - Daily Camarilla Pivot (Very Strong Daily Resistance)
D L3 – Daily Camarilla Pivot (Daily Support)
D L4 – Daily H4 Camarilla (Very Strong Daily Support)
POC - Point Of Confluence (The zone where we expect price to react aka entry zone)
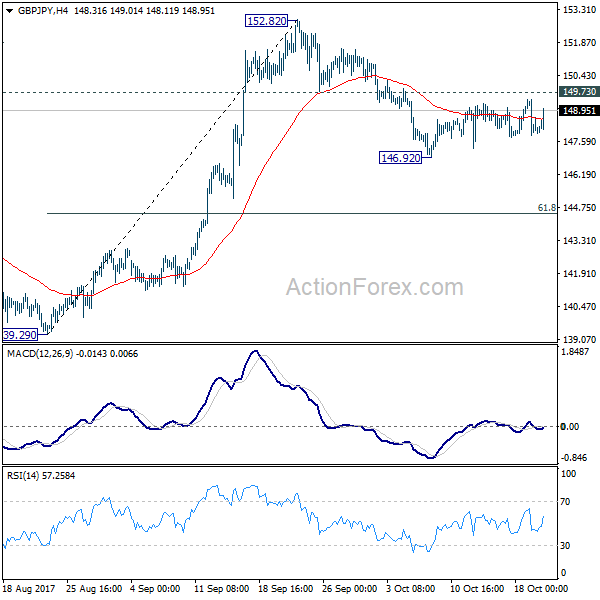
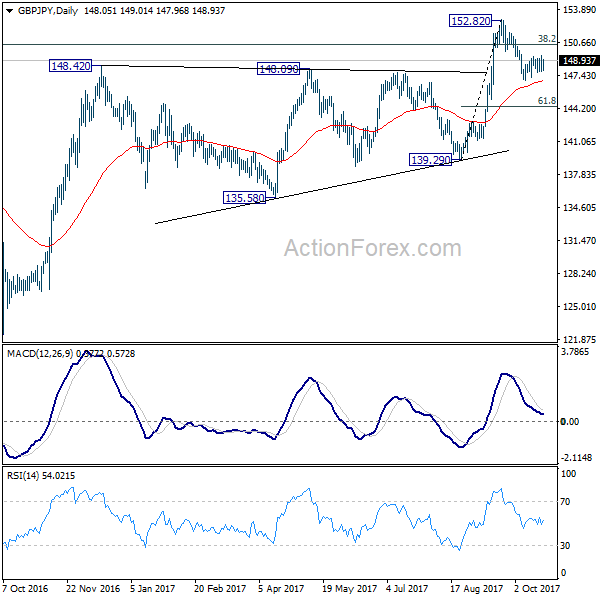
GBP/JPY Daily Outlook
Daily Pivots: (S1) 147.39; (P) 148.41; (R1) 149.10; More
GBP/JPY is still bounded in consolidation from 146.92 temporary low. Intraday bias remains neutral first and outlook is unchanged. With 149.73 minor resistance intact, deeper decline is still expected. Below 146.92 will target 61.8% retracement of 139.29 to 152.82 at 144.45. Such decline is seen as a correction and we'd look for strong support from 144.45 to bring rebound. On the upside, break of 149.73 support turned resistance will argue that the pull back is completed and turn bias back to the upside for retesting 152.82 high. However, sustained break of 144.45 will put 139.29 key support in focus.
In the bigger picture, medium term rebound from 122.36 is still expected to resume after corrective pull back from 152.82 completes. Firm break of 38.2% retracement of 196.85 to 122.36 at 150.43 will carry long term bullish implications. In that case, GBP/JPY could target 61.8% retracement at 167.78. However, break of 139.29 will indicate rejection from 150.43 key fibonacci level. And the three wave corrective structure of rebound from 122.36 will argue that larger down trend is resuming for a new low below 122.26.
Forex Technical Analysis: EUR/USD, USD/JPY, GBP/USD
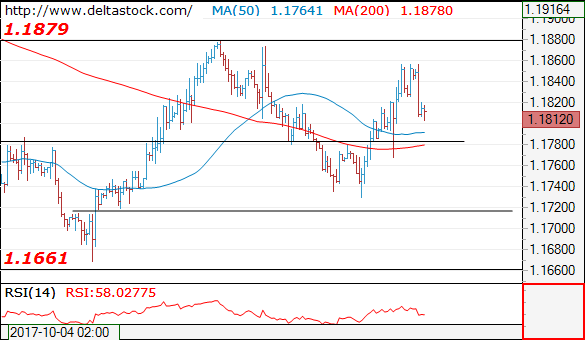
EUR/USD
Current level - 1.1812
The bias is bearish after the failure at 1.1860, for a break through 1.1780, towards 1.1660. Initial minor resistance lies at 1.1825.
| Resistance | Support | ||
| intraday | intraweek | intraday | intraweek |
|
1.1825 |
1.1940 |
1.1780 |
1.1660 |
|
1.1880 |
1.2030 |
1.1720 |
1.1480 |
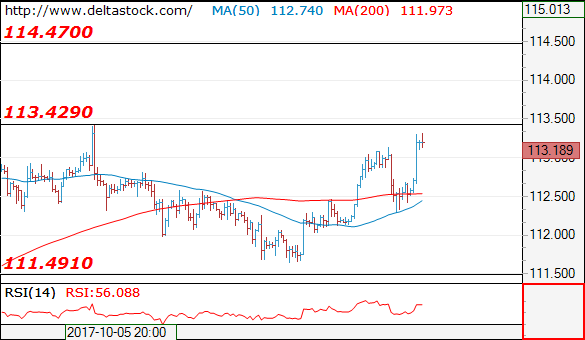
USD/JPY
Current level - 113.18
My outlook is positive, for a break through 113.40, towards 114.50 zone. Initial intraday support lies at 112.60.
| Resistance | Support | ||
| intraday | intraweek | intraday | intraweek |
|
113.40 |
114.50 |
112.60 |
111.00 |
|
114.50 |
114.50 |
111.50 |
107.30 |
GBP/USD
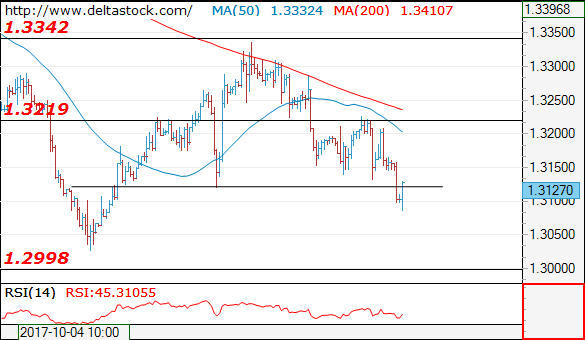
Current level - 1.3127
Yesterday's test of 1.3220 failed as well and the bias is bearish, for a slide towards 1.3000 area. Initial intraday resistance lies at 1.3150.
| Resistance | Support | ||
| intraday | intraweek | intraday | intraweek |
|
1.3150 |
1.3340 |
1.3020 |
1.2910 |
|
1.3220 |
1.3650 |
1.3020 |
1.2760 |