Sample Category Title
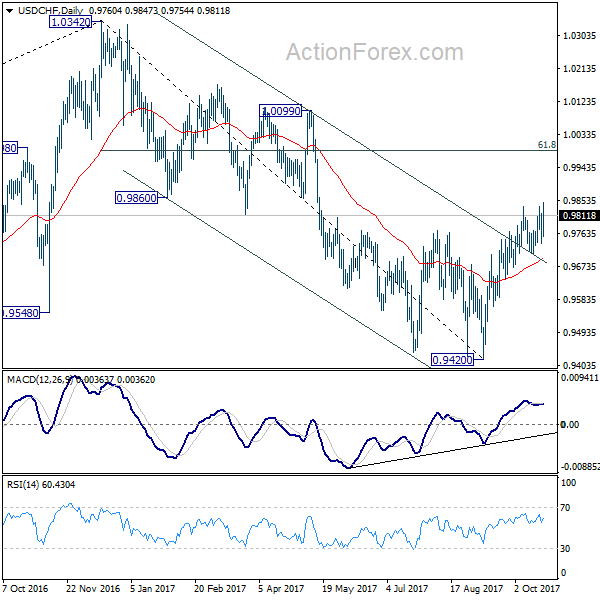
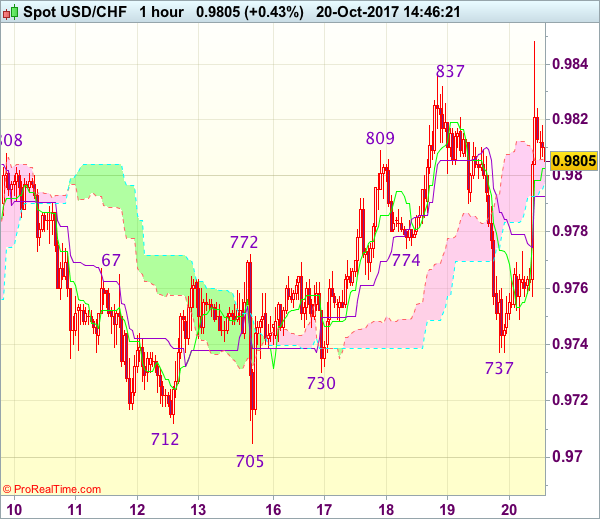
USD/CHF Daily Outlook
Daily Pivots: (S1) 0.9725; (P) 0.9770; (R1) 0.9803; More....
Break of 0.9835 argues that rebound from 0.9420 is resuming. Intraday bias is cautiously on the upside for further rally to 61.8% retracement of 1.0342 to 0.9420 at 0.9990 next. As medium term fall form 1.0342 is possibly finished, sustained break of 0.9990 will pave the way to retest 1.0342 high. However, break of 0.9736 support will mixed up the near term outlook and turn bias back to the downside for 0.9587 support instead.
In the bigger picture, current development suggests that USD/CHF has defended 0.9443 (2016 low) key support level again. Rise from 0.9420 could develop into a medium term move and target a test on 1.0342 high. This represents the upper end of a long term range that started back in 2015. On the downside, break of 0.9587 support is now needed to indicate completion of the rise from 0.9420. Otherwise, further rally will remain in favor in medium term.
North America Takes The Fore In Friday Session
The global financial markets can expect a steady stream of market-moving data on Friday, culminating in several batches of high-profile North American figures.
Action begins in Europe at 06:00 GMT with the release of German producer inflation data. The German producer price index (PPI) is forecast to rise 2.9% annually in September, following a 2.6% increase the previous month.
Attention shifts to policy a half hour later as Bank of Japan (BOJ) Governor Haruhiko Kuroda delivers a speech. Currency traders will be on high alert for any mention of quantitative easing.
Returning to the data, the UK National Statistics office will report on public sector net borrowing at 08;30 GMT.
The Canadian government headlines the North American calendar with multiple releases Friday, including retail sales and consumer inflation. Retail spending is forecast to rise 0.5% in August, after climbing 0.4% the previous month.
Statistics Canada is also expected to show a 1.6% annual increase in the consumer price index (CPI) at 12:30 GMT.
South of the border, the National Association of Realtors (NAR) will report on existing home sales for the month of September. The sale of previously-owned homes is forecast to dip 1% to a seasonally adjusted annual rate of 5.3 million units.
Energy traders will also keep an eye on weekly rig-count data at 17:00 GMT.
In terms of monetary policy, Federal Open Market Committee (FOMC) member Loretta Mester will deliver a speech at 18:00 GMT.
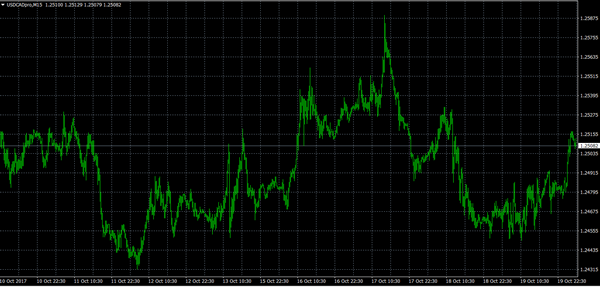
USD/CAD
The USD/CAD will be data-driven on Friday, as investors try to piece together Canada’s inflation outlook relative to the central bank’s rate-hiking schedule. The USD/CAD exchange rate is up 0.2% overnight to trade at 1.2511. The gains reflect a broader rally for the greenback this week. A solid inflation report from Statistics Canada could trigger a broad reversal for the pair. In fact, anything that supports the case for a trigger-happy BOC will send the Canadian dollar higher.
EUR/USD
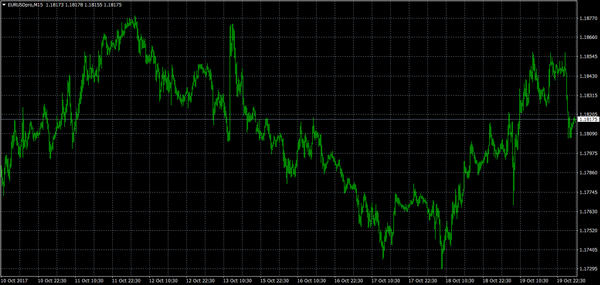
The euro advanced against the dollar on Thursday, but has since softened to resume trading in the low 1.1800 region. The EUR/USD remains firmly capped below the 1.19 handle for nearly a month. That means the upper 1.1800s continue to offer strong resistance. On the opposite side of the ledger, immediate support is located in the upper half of the 1.1700 area.
USD/JPY
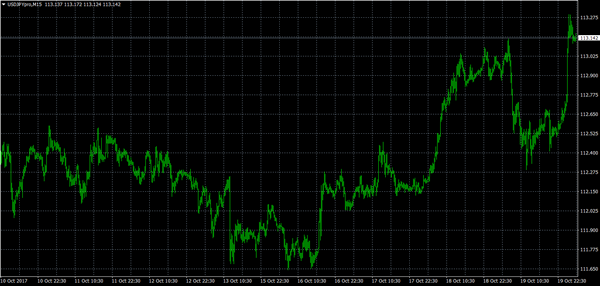
The USD/JPY caught a tailwind Friday, gaining 0.5% to trade at 113.17. The pair touched a session high of 113.31, which would have marked the highest settlement in two weeks. All eyes are on the BOJ’s Kuroda, as his comments could signal the direction of the market in the coming hours. Analysts at Danske Bank see the USD/JPY returning to 115.00 and beyond over the next six months.
USD/CAD Candlesticks and Ichimoku Analysis
Weekly
• Last Candlesticks pattern: Shooting doji
• Time of formation: 01 May 2017
• Trend bias: Sideways
Daily
• Last Candlesticks pattern: Bearish engulfing
• Time of formation: 5 May 2017
• Trend bias: Down
USD/CAD – 1.2470
Although the greenback rebounded earlier this week to as high as 1.2591, as the pair has retreated after faltering below recent high at 1.2599, retaining our view that further consolidation below this level would be seen and test of 1.2433 support cannot be ruled out, below there would bring retracement of recent rise towards the Kijun-Sen (now at 1.2360) but reckon 1.2310-15 would contain downside and bring another rise later. Only a break of said resistance at 1.2599 would confirm the rise from 1.2061 low has resumed and bring retracement of early decline to 1.2620-25, then towards resistance at 1.2663, having said that, reckon upside would be limited to 1.2700-10 and price should falter below resistance at 1.2778.
On the downside, whilst initial pullback to 1.2433 and then 1.2390-00 cannot be ruled out, reckon the Kijun-Sen (now at 1.2360) would limit downside and 1.2315-25 would hold, bring another rise later. Only a daily close below support at 1.2254 would abort and signal the rebound from 1.2061 has ended instead, bring weakness to 1.2198, break there would add credence to this view and extend weakness to 1.2121. Having said that, break there is needed to retain bearishness and bring further fall towards said recent low at 1.2061. Looking ahead, below 1.2061would extend downtrend to psychological level at 1.2000, having said that, loss of momentum should prevent sharp fall below 1.1920-25 (61.8% projection) and 1.1900 should hold.
Recommendation: Buy at 1.2325 for 1.2525 with stop below 1.2225
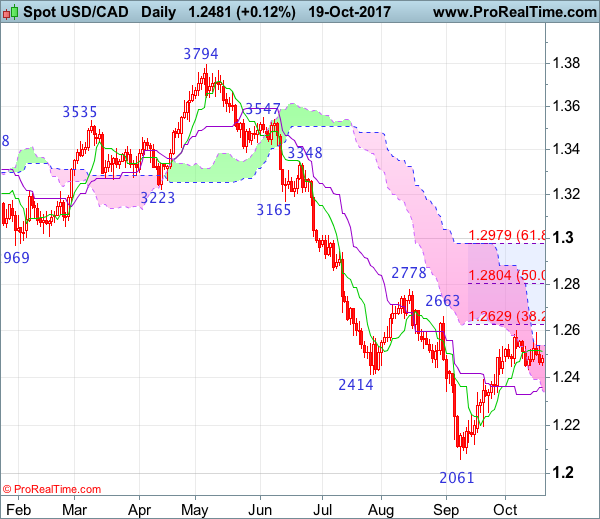
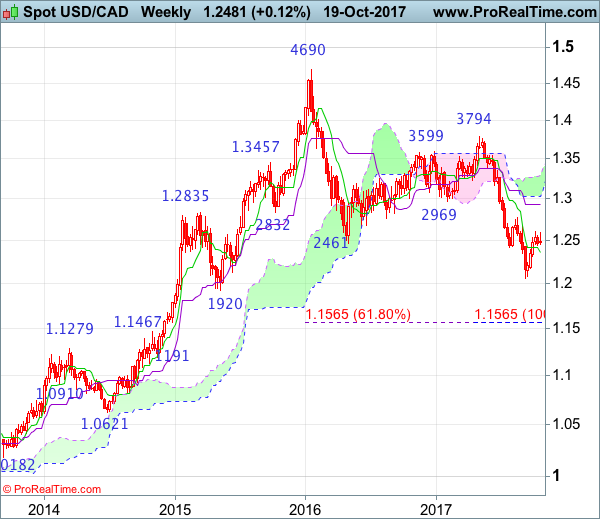
On the weekly chart, as the greenback has retreated after failing to penetrate resistance at 1.2599, suggesting further consolidation below this level would be seen and pullback to 1.2433, then 1.2390-00 cannot be ruled out, however, if our view that a temporary low formed at 1.2061 is correct, downside should be limited to 1.2315-25 and bring another rebound later. Above 1.2599 would extend the corrective rise from 1.2061 low for retracement of recent decline to previous resistance at 1.2663, then 1.2700-10, having said that, price should falter below previous resistance at 1.2778, bring another decline later in Q4.
On the downside, expect pullback to be limited to 1.2390-00 and 1.2300-10 should hold, bring another rise later to aforesaid retracement targets. Below 1.2121 support would abort and signal the rebound from last month’s low at 1.2061 has ended, bring retest o this level later. A drop below 1.2061 would confirm decline from 1.3794 top has resumed and extend weakness towards psychological support at 1.2000, however, reckon downside would be limited to 1.1920-25 (61.8% projection of 1.3794-1.2414 measuring from 1.2778) and reckon 1.1840-50 would hold from here, price should stay above 1.1750-60, bring rebound later.
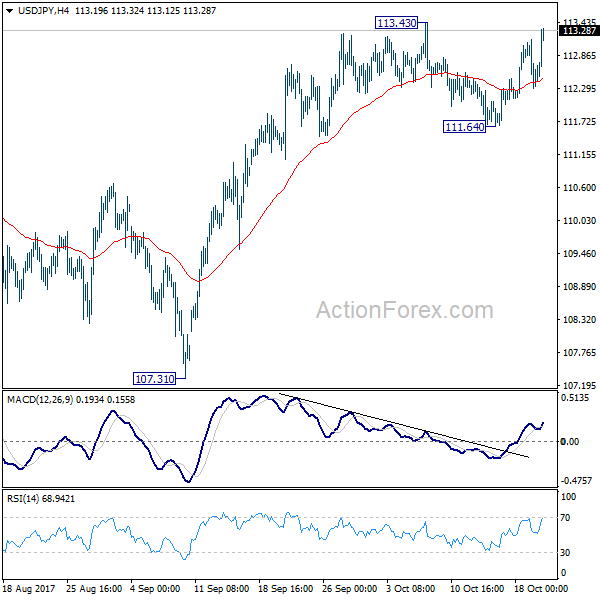
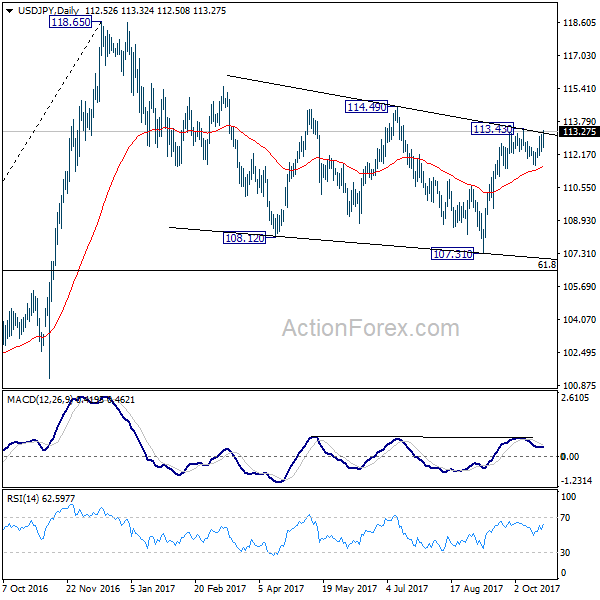
USD/JPY Daily Outlook
Daily Pivots: (S1) 112.17; (P) 112.66; (R1) 113.02; More...
At this point, USD/JPY is still limited below 113.43 resistance and intraday bias stays neutral first. On the upside, break of 113.43 will resume the rise from 107.31 and target 114.49 resistance. More importantly current development revives the case that correction from 118.65 has completed at 107.31. Decisive break of 114.49 will pave the way to retest 118.65 high. However, break of 111.64 will mixed up the outlook again and turn bias back to the downside for deeper fall.
In the bigger picture, rise from 98.97 (2016 low) is seen as the second leg of the corrective pattern from 125.85 (2015 high). It's unclear whether this second leg has completed at 118.65 or not. But medium term outlook will be mildly bearish as long as 114.49 resistance holds. And, there is prospect of breaking 98.97 ahead. Meanwhile, break of 114.49 will bring retest of 125.85 high. But even in that case, we don't expect a break there on first attempt.
Trade Idea : USD/CHF – Buy at 0.9775
USD/CHF - 0.9805
Most recent candlesticks pattern : N/A
Trend : Up
Tenkan-Sen level : 0.9803
Kijun-Sen level : 0.9793
Ichimoku cloud top : 0.9807
Ichimoku cloud bottom : 0.9799
New strategy :
Buy at 0.9775, Target: 0.9875, Stop: 0.9740
Position : -
Target : -
Stop : -
As the greenback found renewed buying interest at 0.9737 and has rallied again, price broke above recent high at 0.9837, signaling early upmove has resumed and although price has retreated from 0.9848, reckon downside would be limited to 0.9770-75 and bring another rise later, above said resistance at 0.9848 would confirms resumption of upmove from 0.9421 low for headway to 0.9870 and possibly towards 0.9900.
In view of this, we are looking to buy dollar again on pullback as 0.9770-75 should limit downside and bring another rise later. Only below support at 0.9730-37 would abort and signal top is formed instead, bring another corrective decline to previous support at 0.9705.
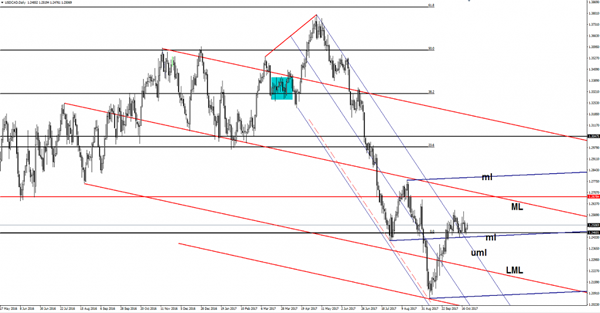
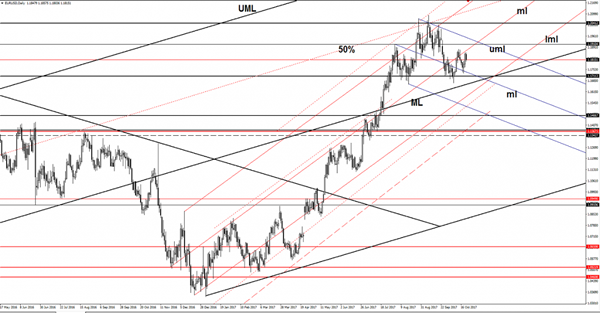
USD/CAD Should Climb Much Higher
The USD/CAD is expected to increase and to resume the yesterday’s minor bullish candle. Price retested the 1.2460 static support, failing to retest the upper median line (uml) of the descending pitchfork and the median line (ml) of the blue ascending pitchfork.
The next upside target will be at the median line (ML) of the major red ascending pitchfork and at the 1.2678, actually, it could be attracted by the confluence area formed between these two resistance levels.
EUR/USD Head And Shoulders?
EUR/USD decreased in the morning failing to reach and retest the median line (ml) of the ascending pitchfork. Price moves sideways on the short term and developed a Head and Shoulders pattern, but this is far from being confirmed. Only a valid breakdown below the 1.1711 horizontal support will signal a further drop. Support can be found at the median line (ML) of the major black ascending pitchfork, so only a valid breakdown below the ML and outside the ascending pitchfork’s body will confirm a larger drop.
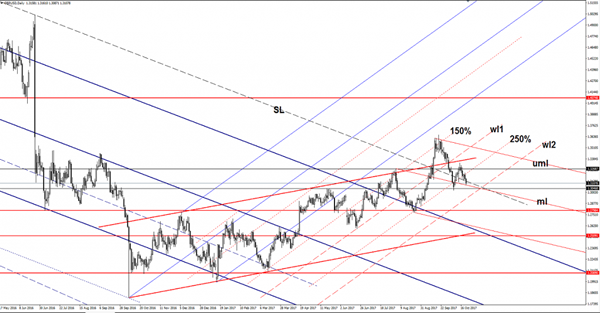
GBP/USD On The Way Down
The Currency pair dropped significantly today and resumed the yesterday's bearish candle. Price is pressuring an important dynamic support and is somehow expected to take this out. The USD has taken the lead on the short term and drives the rate down as the USDX has managed to increase again.
The dollar index was almost to erase the yesterday's losses, remains to see if will have enough energy to stay higher and to approach the 93.81 horizontal resistance again. A failure to approach the 92.49 static support shows that the bulls are still in the game and could force the index to start a larger rebound.
The UK's Public Sector Net Borrowing will be released later and is expected to increase from 5.1B to 5.7B in September, we'll see if will have the ability to lift the cable.
The GBP/USD drops after the breakdown below the 250% Fibonacci line and now is pressuring the outside sliding line (SL) of the major descending pitchfork. Price retested the median line (ml) of the minor descending pitchfork as well, but is somehow expected to ignore it and to drop much deeper.
I've said in the previous week that the perspective remains bullish as long as the rate stay above the 250% Fibonacci line, but another breakdown will signal a larger drop. Will drop towards the lower median line (lml) of the minor descending pitchfork if will close below the median line and if will retest this obstacle.
Forex: US Jobless Claims Lowest Since 1973
On Thursday, the US Department of Labor released Initial Jobless Claims for the week ending October 13th that showed a resilient and stable labor market. Initial claims fell 22K to a seasonally adjusted 222K – the lowest since March 1973. The data is now becoming more realistic as the impact of the recent Hurricanes is no longer impacting claims to any great extent. With unemployment at its lowest level since 2000 and a growing job market, US economic expansion appears to be moving in a positive direction.
UK Retail Sales data, released on Thursday by the Office for National Statistics, fell more than expected. Following the jump in August, September data fell 0.8%, resulting in the UK retail sector experiencing its lowest growth rate in 4 years for the recent quarter. With inflation running at 3% and wage growth stalling at 2.2%, consumer spending is likely to remain depressed as we see out 2017. The markets believe that the Bank of England is likely to ignore such poor data as they consider hiking rates at their meeting on November 2nd.
President Trump received a boost as a budget blueprint plan for 2018 was approved in the Republican-controlled Senate on Thursday. By a vote of 51 to 49, the tax plan was approved, which is likely to create a clear path for Republicans to initiate a tax cut package without Democratic support. The approved budget plan allows tax legislation to add up to $1.5 trillion to the Federal Deficit over the next 10 years to pay for the proposed tax cuts. The markets appear to have reacted positively to the news, with USD seeing gains overnight.
Trump has now concluded the interviews for the next Fed Chair after seeing 5 candidates. A decision could be announced as early as next week, with Federal Reserve Governor Jerome Powell appearing to be the leading candidate. Powell is regarded as having a less hawkish stance than the other front-runners, Kevin Warsh and John Taylor, and is likely to favor lower US interest rates which would result in USD declining.
EURUSD is -0.3% lower in early Friday trading. Currently, EURUSD is trading around 1.1815.
USDJPY is 0.6% higher overnight. USDJPY is currently trading around 113.20.
GBPUSD is 0.4% lower in early Friday trading. GBPUSD is currently trading around 1.3105.
Gold is 0.5% lower, trading around $1,283 in early Friday trading.
WTI is 0.15% higher, trading currently around $51.70.
Major data releases for today:
At 07:35 BST, Bank of Governor Haruhiko Kuroda is scheduled to hold a press conference about Japanese monetary policy at the annual meeting of credit cooperatives in Tokyo.
At 09:30 BST, the UK Office for National Statistics is scheduled to release Public Sector Net Borrowing for September. September’s data is likely to be higher than the previous release of £5.093B.
At 13:30 BST, Statistics Canada will release a plethora of inflation data that will consist of Retail Sales & CPI. CPI (MoM) is expected to show a slight increase to 0.3% from the previous reading of 0.1%, with Retail Sales also expected to show a slight increase to 0.5% from 0.4%.
At 19:00 BST, FOMC Member Loretta Mester is scheduled to participate in a global regulatory structure panel before a conference focusing on “The Future of Global Finance: Populism, Technology and Regulation” in New York.
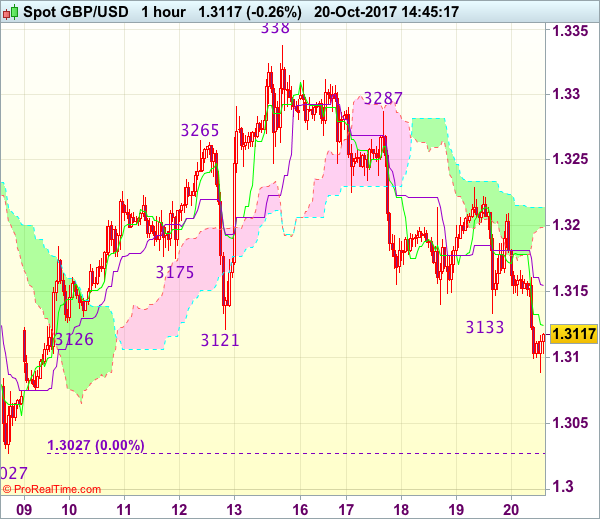
Trade Idea : GBP/USD – Sell at 1.3220
GBP/USD - 1.3136
Most recent candlesticks pattern : N/A
Trend : Near term down
Tenkan-Sen level : 1.3124
Kijun-Sen level : 1.3151
Ichimoku cloud top : 1.3214
Ichimoku cloud bottom : 1.3199
Original strategy :
Sell at 1.3285, Target: 1.3165, Stop: 1.3320
Position : -
Target : -
Stop : -
New strategy :
Sell at 1.3220, Target: 1.3100, Stop: 1.3255
Position : -
Target : -
Stop : -
Although cable fell again to 1.3088, lack of follow through selling on break of previous support at 1.3121 suggests consolidation would be seen and another bounce to 1.3175-80 cannot be ruled out, however, reckon resistance at 1.3229 would limit upside and bring another decline later, below said support at 1.3088 would extend the fall from 1.3338 to 1.3050 but recent low at 1.3027 should remain intact due to oversold condition.
In view of this, wee are looking to sell cable on subsequent recovery as resistance at 1.3229 should limit upside and bring another decline later. Above 1.3250-55 would defer and risk test of indicated resistance at 1.3287 but only a firm break above this level would abort and signal low is formed instead, bring rebound to 1.3300 and possibly test of resistance at 1.3312.