Sample Category Title
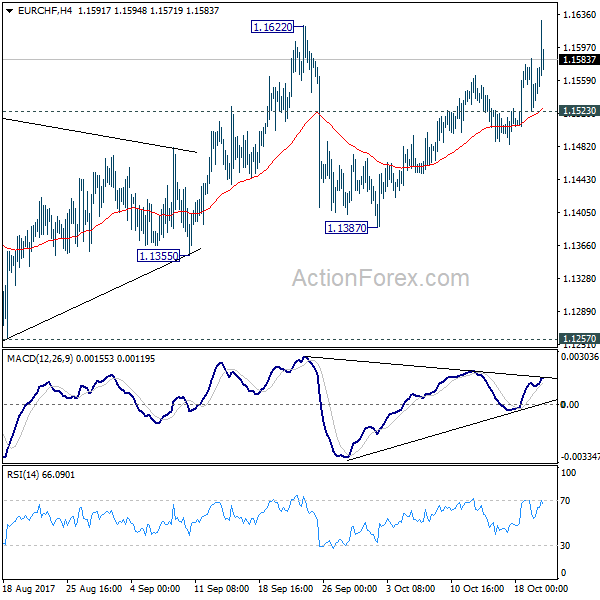
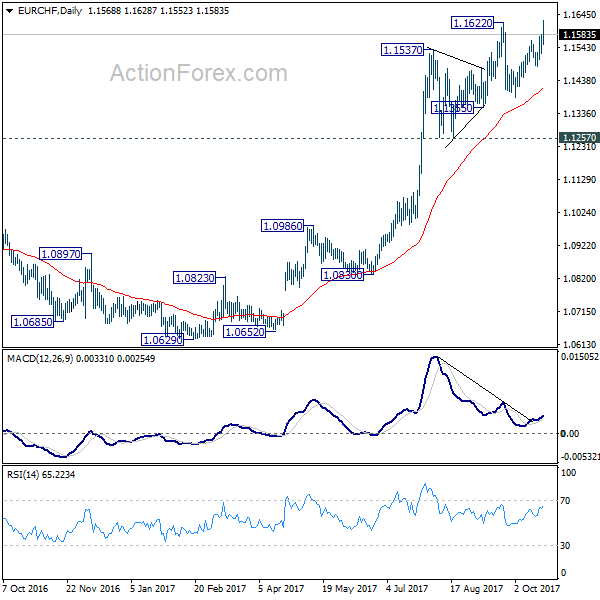
EUR/CHF Daily Outlook
Daily Pivots: (S1) 1.1532; (P) 1.1558; (R1) 1.1593; More....
Breach of 1.1622 argues that medium term up trend has resumed. Intraday bias stays on the upside for the moment. Sustained trading above 1.1622 will pave the way to 1.2 key level. On the downside, below 1.1523 will dampen this bullish case and turn bias to the downside for 1.1387 instead. In that case, consolidation from 1.1622 will extend for a while.
In the bigger picture, long term rise from SNB spike low back in 2015 is still in progress. EUR/CHF should now be heading back to prior SNB imposed floor at 1.2000. For now, this will be the favored case as long as 1.1198 resistance turned support holds.
Dollar Faces Tailwinds On 2018 Fiscal Budget Approval, Kiwi Plummets As Economic Risks Grow
The approval of a budget blueprint for the 2018 fiscal year, drove the dollar higher against its major counterparts on Friday in Asia, while the kiwi extended its losses in the face of economic uncertainties which might emerge under the new coalition government.
Trump's tax plan, which promises substantial tax cuts to businesses and individuals, is ready to move to the House of Representatives after the Republican-controlled Senate voted in favor of the 2018 fiscal budget yesterday which would add $1.5 trillion to the federal deficit over the next decade in order to fund the tax cuts. The good news for the Republicans now is that the Senate approval unlocked a key legislative tool needed for them to pass the tax package through Congress without support from the Democrats. With hopes to pass the bill by December, Trump's team will work harder to submit a House-version tax draft by early November.
In other news, Trump has completed his interviews with the five candidates considered for the role of Fed chair on Thursday, with sources familiar with the matter saying that a decision could be announced as soon as next week.
During the session, the dollar gained 0.26% on the day against its major peers, with the index last trading at 93.52. Looking at dollar pairs, dollar/yen hit a two-week high at 113.31 ahead of the Japanese elections on Sunday, while dollar/swissie touched a five-month high of 0.9847.
In New Zealand, the formation of the new coalition government consisted of the Labour party and the small New Zealand First, raised fears that stricter policies on immigration and foreign investments would be imposed, hurting the outlook for the kiwi. The kiwi, which recorded the worst performance among G10 currencies this month, made a fresh five-month low of $0.6970 on Friday.
On late Thursday, the German Chancellor, Angela Merkel expressed their support to the British Prime Minister, Theresa May, during the EU summit in Brussels that concludes today, raising hopes that Brexit talks could progress to the second stage, reaching an EU-UK trade deal. Particularly, Merkel said “that there are no indications at all” that Brexit negotiations won't succeed, suggesting that trade talks could start at the next EU summit in December.
Despite those comments, the pound failed to gain ground as doubts on monetary policy and specifically on whether the BOE would proceed with a rate hike in November weighed on the currency after the release of disappointing economic data out of the UK early this week. The pound retreated by 0.22% against the greenback, last seen at $1.3131.
The euro declined by 0.30% to $1.1817 as the Spanish Prime Minister, Mariano Rajoy, prepares to hold a cabinet meeting on Saturday that could activate Article 155 and therefore suspend Catalonia's autonomy. This arose after the Catalan leader, Charles Puigdemont, refused for the second time on Thursday to renounce “symbolic” independence and said instead he would proceed with a formal declaration if the Spanish government continues to refuse to engage in dialogue.
The loonie climbed by 0.20% ahead of Canadian inflation data due later today.
Turning to commodities, gold tumbled by 0.56% to $1,281.90 per ounce on the back of a stronger dollar, while oil prices moved higher as well amid signs of tightening supply. WTI crude jumped by 0.55% to $51.57 per barrel and Brent rose by 0.42% to $57.47.
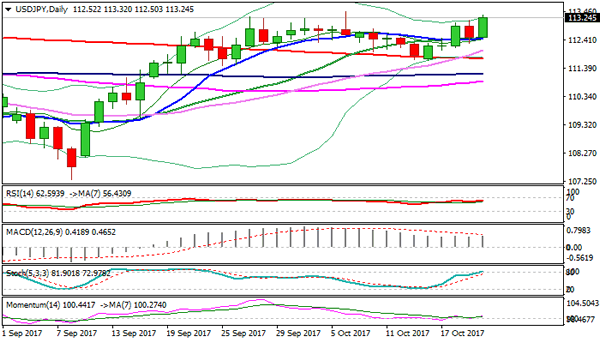
Technical Outlook: USDJPY Probes Through Key Barriers
The pair is holding near session high at 113.32 in early European trading, following strong rally in Asia. The greenback was boosted by increased optimism about US tax reforms after the US Senate approved a budget blueprint for the 2018 fiscal year that opens way for Republicans to continue with Trump’s tax-cut plans without support from Democrats.
The dollar also received support from speculations of successor of Janet Yellen as Fed chair person, as President Trump favors more hawkish person at that position.
Japan’s general election is on Sunday and market observers expect no surprises for the market as Japanese PM Abe’s ruling coalition is on track keep the majority in the lower house.
Bullish technical studies point at the upside as fresh rally cracked key resistance zone between 113.25 and 113.43. Sustained break here would spark fresh extension of broader uptrend from 107.31 (08 Sep low) towards targets at 114.00/50.
Hesitation at key barriers could be anticipated as slow stochastic is entering overbought territory which may result in consolidation before bulls resume.
Initial supports at 113.00/112.70 are expected to ideally contain dips, while extended downticks should find ground at 112.50 (session low / converged 10/20SMA’s / 4-hr cloud top).
Conversely, firm break here would sideline near-term bulls for prolonged consolidation.
Res: 113.86, 114.00, 114.50, 114.80
Sup: 113.00, 112.70, 112.50, 112.03
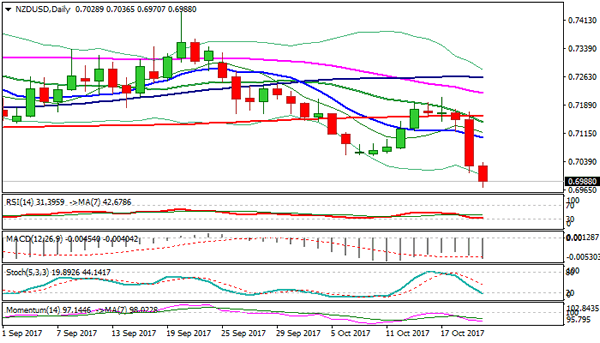
Technical Outlook: Kiwi Dollar At 5-Month Low, Further Easing Likely
The New Zealand dollar remains firmly in red on Friday and broke below psychological 0.7000 support. Fresh extension of strong fall on Thursday hit new five-month low at 0.6970, with scope seen for further weakness. The Kiwi dollar is under pressure on political uncertainty while the greenback received fresh boost on hopes of implementation of President Trump's tax package. Technical studies are in firm bearish mode and favor further easing, as Thursday's long red daily candle (the pair was down 1.7% on Thursday) weighs heavily on near-term action. The pair is currently riding on the wave C of five-wave cycle from 0.7558, which broke below its FE 100% (0.7008) and could travel to 0.6907 (FE123.6%) and 0.6844 (FE138.2%) in extension. Initial resistance lies at 0.7055 (10 Oct former low), with falling 10SMA (0.7102) expected to cap corrective upticks.
Res: 0.7000, 0.7055, 0.7090, 0.7102
Sup: 0.6970, 0.6950, 0.6907, 0.6844
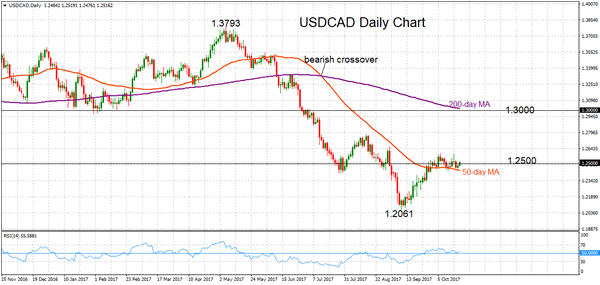
USDCAD Maintains Bearish Market Structure, Makes Corrective Move To Consolidate Around 1.25
USDCAD maintains a bearish market structure as the pair continues to trade below the 200-day moving average. Looking at the short-term, prices made a corrective move higher after bouncing from 1.2061 and are currently consolidating around the 1.25 handle.
Immediate support is being provided by the 50-day MA, currently at 1.2438. Breaking below this level would target the September 8 low at 1.2061. Another leg lower would increase downside pressure and bring a resumption of the broader downtrend, with scope to reach the next major low at 1.1919.
A move to the upside would target the next high at 1.2777 ahead of the key 1.3000 level. From here, the focus turns to the 1.3215-1.3342 area. An extension higher would see a re-test of the May 5 peak at 1.3793.
In the near term USDCAD is expected to maintain a neutral bias at 7-week highs, pivoting around 1.2500. Trend strength is weak (RSI is neutral), leaving little room for a sustained push higher. The market structure on the daily chart supports a bearish view.
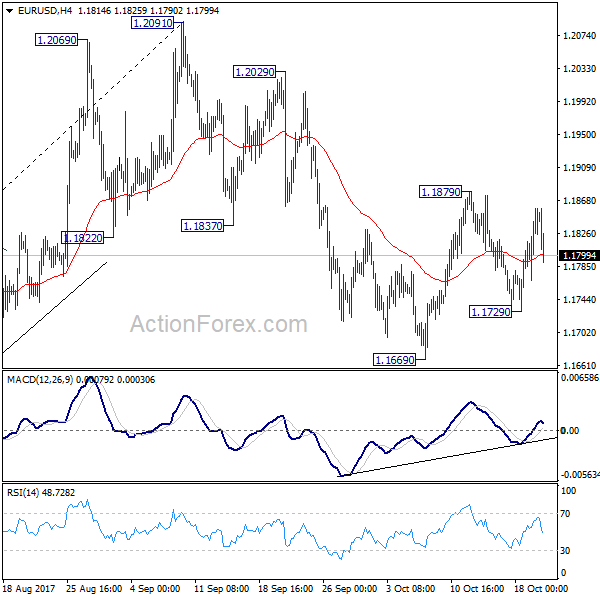
EUR/USD Daily Outlook
Daily Pivots: (S1) 1.1792; (P) 1.1825 (R1) 1.1883; More...
EUR/USD failed to break out 1.1879 resistance and retreated. Intraday bias is turned neutral again. On the upside, break of 1.1879 will revive the case that corrective fall from 1.2091 has completed at 1.1669, ahead of 1.1661 support. EUR/USD should target a test on 1.2091 high then. Meanwhile, break of 1.1729 will bring retest of 1.1669 instead.
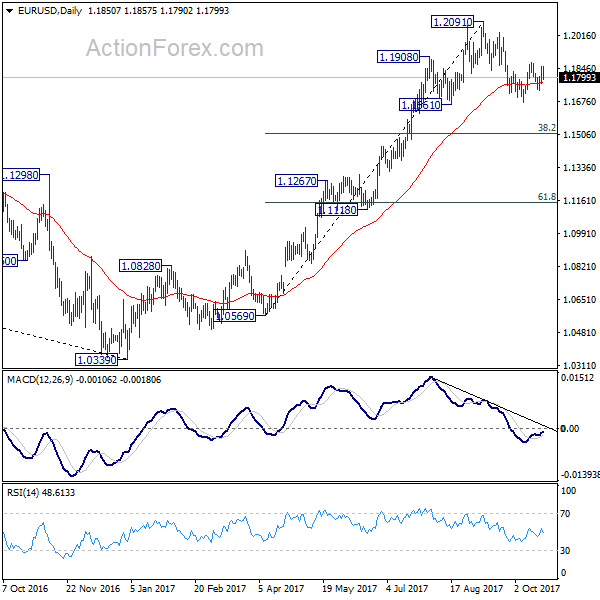
In the bigger picture, rise from medium term bottom at 1.0339 is not finished yet. It's expected to continue after pull back from 1.2091 completes. And, next target will be 38.2% retracement of 1.6039 (2008 high) to 1.0339 (2017 low) at 1.2516. However, it should be noted that there is no confirmation of trend reversal yet. That is, such rebound from 1.0399 could be a correction. And the long term fall from 1.6039 (2008 high) could resume. Hence, we'd be cautious on strong resistance from 1.2516 to limit upside.
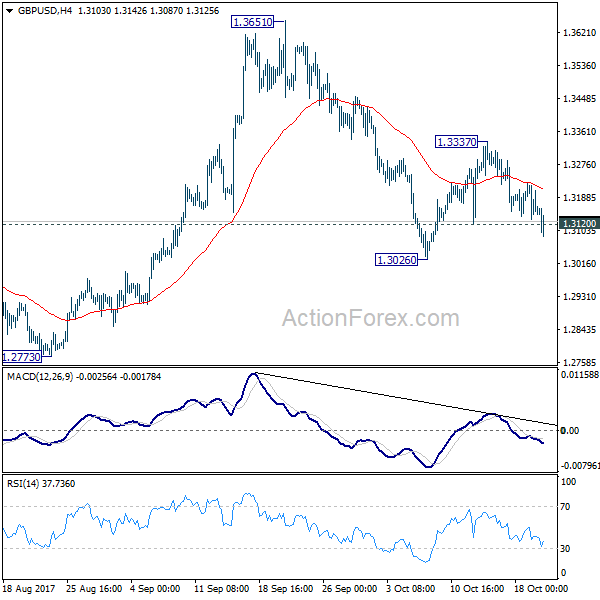
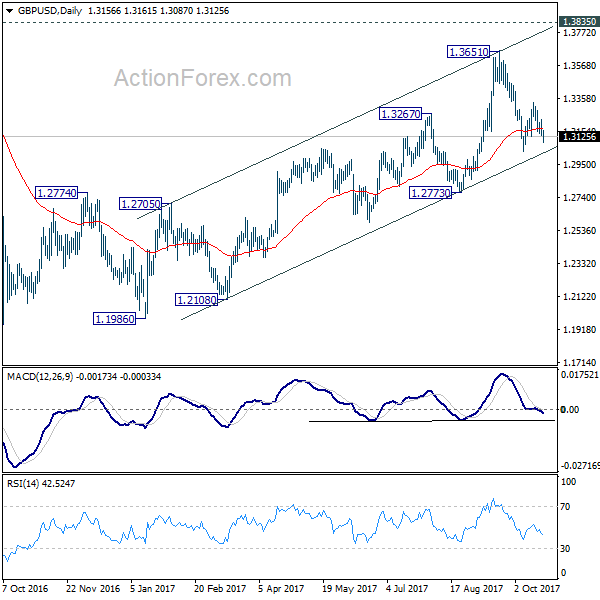
GBP/USD Daily Outlook
Daily Pivots: (S1) 1.3109; (P) 1.3169; (R1) 1.3217; More....
Break of 1.3120 minor support suggests that recovery from 1.3026 is completed at 1.3337. Intraday bias in GBP/USD is turned back to the downside for 1.3026 first. Break will resume whole decline from 1.3651 and target 1.2773 key support next. That will also revive the case that medium term rise from 1.1946 has completed at 1.3651. Meanwhile, above 1.3337 will bring retest of 1.3651 high instead.
In the bigger picture, while the medium term rebound from 1.1946 was strong, GBP/USD hit strong resistance from the long term falling trend line. Outlook is turned a bit mixed and we'll turn neutral first. On the downside, decisive break of 1.2773 key support will argue that rebound from 1.1946 has completed. The corrective structure of rise from 1.1946 to 1.3651 will in turn suggest that long term down trend is now completed. Break of 1.1946 low should then be seen. On the upside, break of 1.3835 support turned resistance will revive the case of trend reversal and target 38.2% retracement of 2.1161 (2007 high) to 1.1946 (2016 low) at 1.5466.
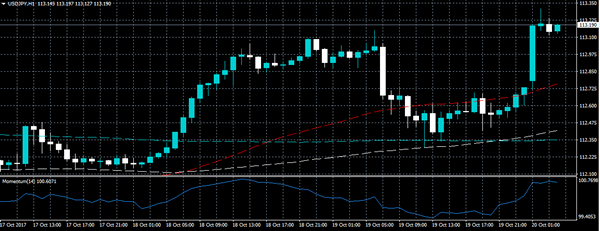
USDJPY Bullish Above 112.89 Level
The U.S dollar has recovered bullish momentum against the Japanese Yen, hitting 113.30, after the U.S Senate passed the 2018 budget blueprint, setting the stage for the proposed tax reforms from the Trump administration. The USDJPY pair currently trades around the 113.19 level, as European traders react to the latest news from the United States.
The USDJPY pair is expected to move higher while trading above the key 112.89 technical level. Intraday upside targets are located at 113.43, 113.57 and 113.90 levels.
If buyers fail to push price above the 113.31 level, sellers will likely target the 112.89 level to test demand around this region. Further intraday support below 112.89 is located at the 112.70 and 112.58 level.
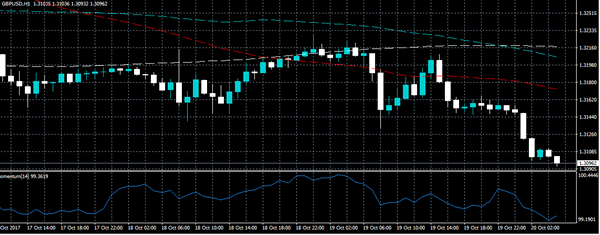
GBPUSD Strongly Bearish Below 1.3130
The British pound has fallen sharply lower against the U.S dollar, hitting 1.3091, as the U.S dollar index soars. The GBPUSD pair moved lower in the Asian session, as the U.S Senate passed through the 2018 budget plan, while intraday technical selling accelerated losses when price broke below the 1.3130 level. The pair currently sits around the 1.3095 level, as traders await the release of UK government finance data.
The GBPUSD pair is strongly bearish while trading below the 1.3130 level, a further decline towards the 1.3070 and 1.3030 technical support levels remain likely.
If GBPUSD sellers fail to push price below the 1.3090 level in the Europea session, buyers may try to push price-action back towards the 1.3116 and 1.3130 resistance levels.
EUR/JPY Candlesticks and Ichimoku Analysis
Weekly
• Last Candlesticks pattern: Window
• Time of formation: 24 April 2017
• Trend bias: Up
Daily
• Last Candlesticks pattern: Hammer
• Time of formation: 18 May 2017
• Trend bias: Up
EUR/JPY – 133.66
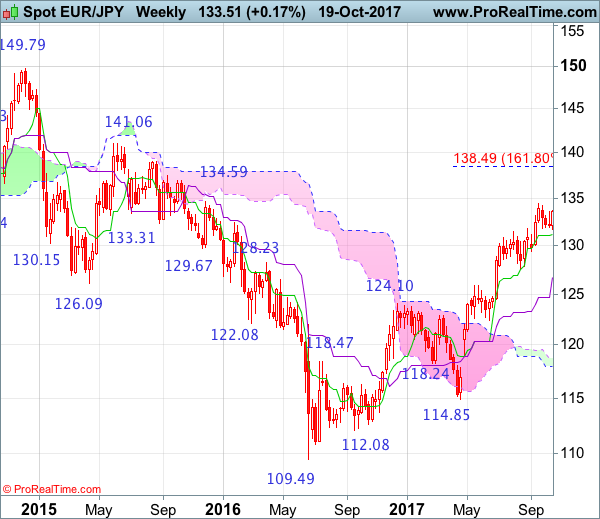
As the single currency found renewed buying interest at 131.66 earlier this week and has staged a strong rebound above previous resistance at 133.50, signaling the pullback from 134.41 (last month’s high) has ended and bring further gain to 134.00, then retest of said resistance. Only a break of this level would confirm recent upmove has resumed for further gain to 135.00, however, near term overbought condition should limit upside to 136.00-10 and reckon 136.90-00 would hold from here, price should falter well below 138.45-50 (1.618 times extension of 109.49-124.10 measuring from 114.85), risk from there has increased for a much-needed correction to take place later.
On the downside, whilst pullback to 132.65-70 cannot be ruled out, reckon the Kijun-Sen (now at 132.52) would hold and bring another rise later. Below 132.00 would risk test of said support at 131.66 but only break there would signal a temporary top has been formed at 134.41 bring retracement of recent upmove to 131.00, then previous support at 130.62, having said that, reckon psychological level at 130.00 would limit downside and price should stay well above another previous support at 129.37, bring rebound later.
Recommendation: Buy at 132.70 for 134.70 with stop below 131.70.
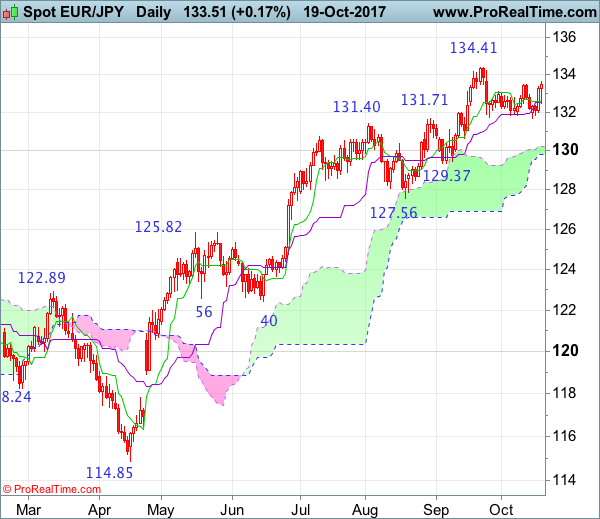
On the weekly chart, as euro found renewed buying interest at 131.66 this week and has staged a rebound, a white candlestick looks set to be formed, hence consolidation with upside bias is seen for gain to 134.00 but break of recent high at 134.41 is needed to confirm recent upmove from 109.49 (2016 low) has resumed and extend gain to 135.00, then 136.00-10, however, reckon upside would be limited and 136.95-00 should hold, price should fatter below 138.45-50 (1.618 times extension of 109.49-124.10 measuring from 114.85), bring retreat later.
On the downside, expect pullback to be limited to 132.60-70 and bring another rise. Only below said support at 131.66 would bring test of the Tenkan-Sen (now at 131.13) but a drop below this level is needed to suggest a temporary top has possibly been formed at 134.41, bring weakness to 129.95-00, however, only a break below 129.37 support would add credence to this view and signal retracement of recent upmove has commenced, hence further weakness to 128.90-00, then towards 128.00-10 would follow but previous support at 127.56 should remain intact.