Sample Category Title
Trade Idea Update: GBP/USD – Hold long entered at 1.3250
GBP/USD - 1.3313
Original strategy :
Bought at 1.3250, Target: 1.3350, Stop: 1.3215
Position : - Long at 1.3250
Target : - 1.3350
Stop : - 1.3215
New strategy :
Hold long entered at 1.3250, Target: 1.3350, Stop: 1.3245
Position : - Long at 1.3250
Target : - 1.3350
Stop : - 1.3245
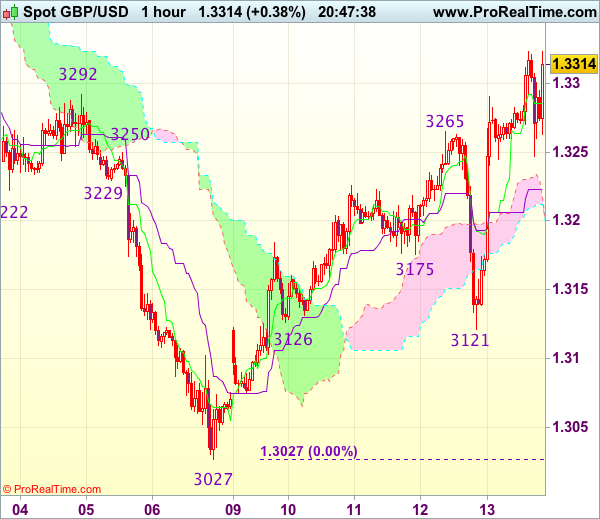
As the British pound found renewed buying interest at 1.3121 yesterday and has rallied, suggesting the rise from 1.3027 low is still in progress, hence consolidation with upside bias is seen for this move to bring a stronger retracement of recent decline, hence gain to 1.3345-50 would be seen, however, near term overbought condition should limit upside to 1.3375-80 (61.8% Fibonacci retracement of 1.3596-1.3027) and 1.3400 should hold from here.
In view of this, we are holding on to our long position entered at 1.3250. Below 1.3245 would defer and risk test of the Kijun-Sen (now at 1.3223), break there would defer and suggest an intra-day top is formed, bring weakness to 1.3200, then towards 1.3175 but said support at 1.3121 should remain intact.
Trade Idea Update: EUR/USD – Stand aside
EUR/USD - 1.1860
Original strategy :
Buy at 1.1800, Target: 1.1900, Stop: 1.1765
Position : -
Target : -
Stop : -
New strategy :
Stand aside
Position : -
Target : -
Stop : -
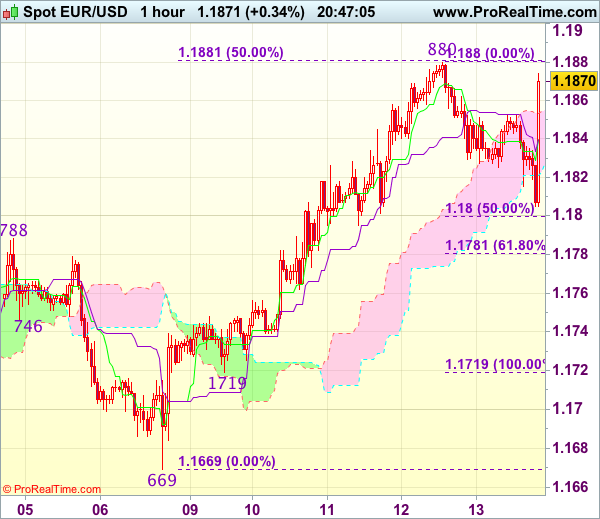
The single currency found renewed buying interest at 1.1805 (just missed our long entry) and has staged a strong rebound in NY morning, suggesting the pullback from 1.1880 (this week’s high) has possibly ended there and consolidation with upside bias is seen, however, break of said resistance at 1.1880 is needed to confirm recent upmove from 1.1669 low has resumed for headway to 1.1895-00 (61.8% Fibonacci retracement of 1.2035-1.1669) first.
In view of this, would not chase this rise here and would be prudent to stand aside in the meantime. Only below minor support at 1.1795 would defer and risk correction to 1.1770 but downside should be limited to 1.1745-50 and price should stay above indicated support at 1.1719, bring another rise later.
EUR/USD Mid-Day Outlook
Daily Pivots: (S1) 1.1811; (P) 1.1845 (R1) 1.1864; More...
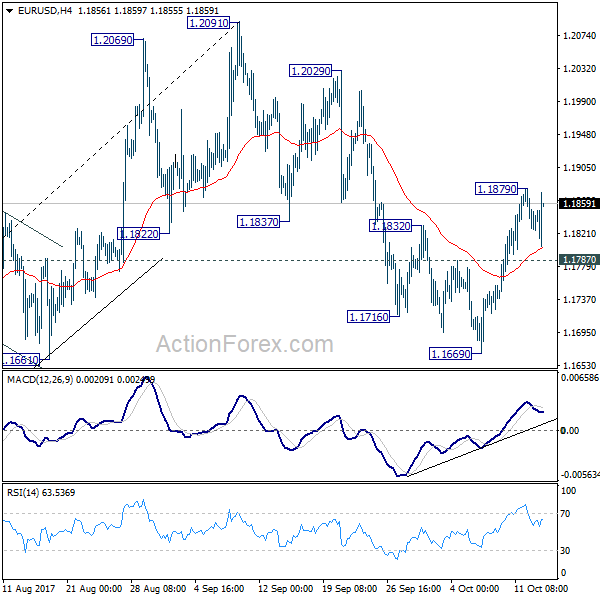
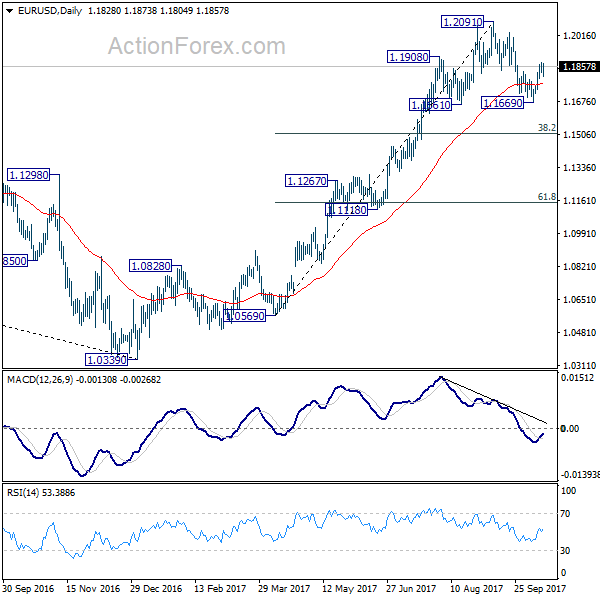
Intraday bias in EUR/USD remains neutral for the moment. Another rally is mildly in favor as long as 1.1787 minor support holds. As noted before, pull back from 1.2091 should have completed at 1.1669, ahead of 1.1661 support. Above 1.1879 will target a test on 1.2091 high. Nonetheless, break of 1.1787 will likely extend the corrective fall from 1.2091 through 1.1669 instead.
In the bigger picture, rise from medium term bottom at 1.0339 is not finished yet. It's expected to continue after pull back from 1.2091 completes. And, next target will be 38.2% retracement of 1.6039 (2008 high) to 1.0339 (2017 low) at 1.2516. However, it should be noted that there is no confirmation of trend reversal yet. That is, such rebound from 1.0399 could be a correction. And the long term fall from 1.6039 (2008 high) could resume. Hence, we'd be cautious on strong resistance from 1.2516 to limit upside.
GBP/USD Mid-Day Outlook
Daily Pivots: (S1) 1.3160; (P) 1.3225; (R1) 1.3329; More....
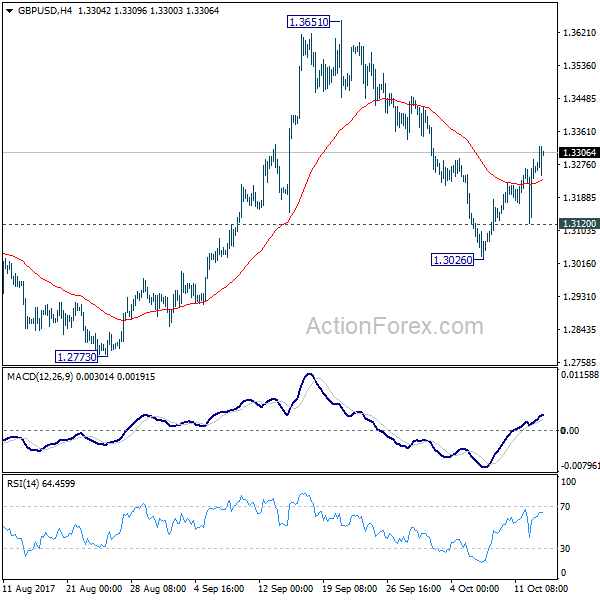
Intraday bias in GBP/USD remains on the upside for the moment. Pull back from 1.3651 should have finished at 1.3026. Further rise would be seen to retest 1.3651 high. Decisive break there will resume whole medium term rally from 1.1946 and target 1.3835 key resistance next. On the downside, below 1.3120 minor support will resume the fall from 1.3651 through 1.3026 instead.
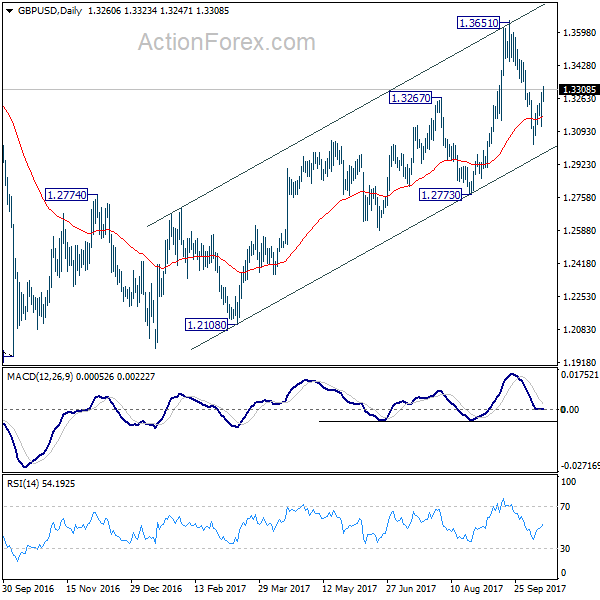
In the bigger picture, while the medium term rebound from 1.1946 was strong, GBP/USD hit strong resistance from the long term falling trend line. Outlook is turned a bit mixed and we'll turn neutral first. On the downside, decisive break of 1.2773 key support will argue that rebound from 1.1946 has completed. The corrective structure of rise from 1.1946 to 1.3651 will in turn suggest that long term down trend is now completed. Break of 1.1946 low should then be seen. On the upside, break of 1.3835 support turned resistance will revive the case of trend reversal and target 38.2% retracement of 2.1161 (2007 high) to 1.1946 (2016 low) at 1.5466 .
USD/CHF Mid-Day Outlook
Daily Pivots: (S1) 0.9722; (P) 0.9742; (R1) 0.9774; More....
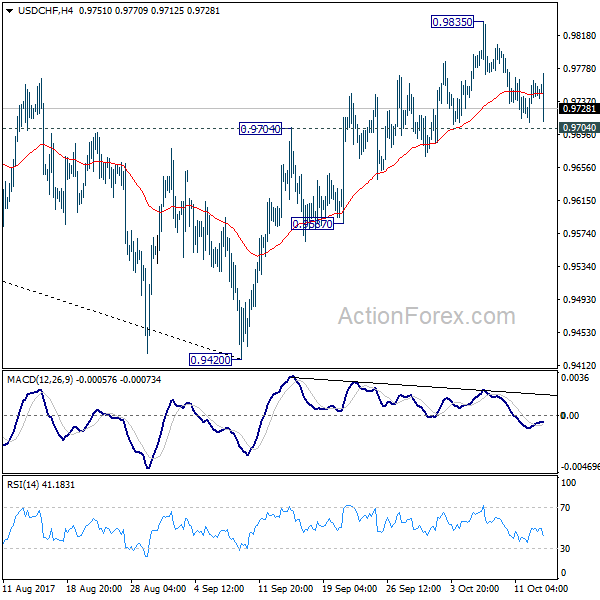
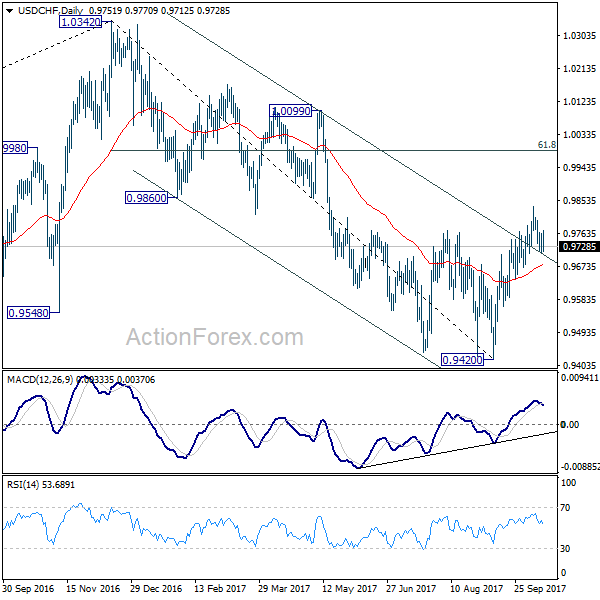
At this point, USD/CHF is still staying above 0.9704 resistance turned support and intraday bias remains neutral first. Considering bearish divergence condition in 4 hour MACD, break of 0.9704 will argue that rebound from 0.9420 has completed. This will also mixed up the near term outlook and turn bias back to the downside for 0.9587 support. Meanwhile, break of 0.9835 temporary top will extend the rebound to 61.8% retracement of 1.0342 to 0.9420 at 0.9990.
In the bigger picture, current development suggests that USD/CHF has defended 0.9443 (2016 low) key support level again. Rise from 0.9420 could develop into a medium term move and target a test on 1.0342 high. This represents the upper end of a long term range that started back in 2015. On the downside, break of 0.9587 support is now needed to indicate completion of the rise from 0.9420. Otherwise, further rally will remain in favor in medium term.
Trade Idea Update: USD/JPY – Hold short entered at 112.25
USD/JPY - 111.80
Original strategy :
Sold at 112.25, Target: 111.25, Stop: 112.60
Position : - Short at 112.25
Target : - 111.25
Stop : - 112.60
New strategy :
Hold short entered at 112.25, Target: 111.25, Stop: 112.25
Position : - Short at 112.25
Target : - 111.25
Stop : - 112.25
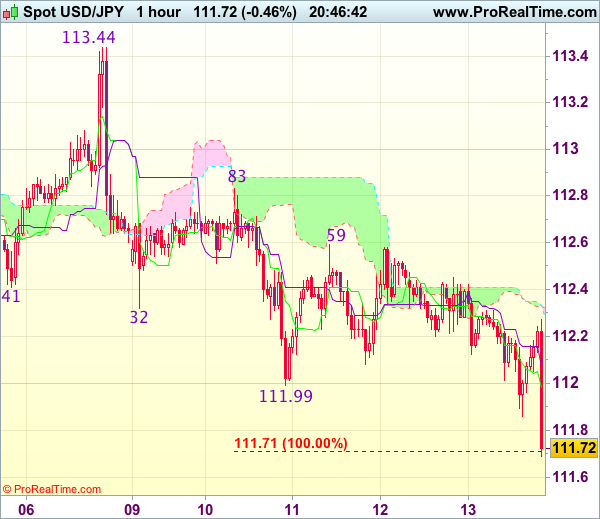
As dollar has remained under pressure after breaking below this week’s low at 111.99, adding credence to our bearishness and signaling the fall from 113.44 top is still in progress, hence downside bias remains for this move to extend weakness to 111.70-75 (100% projection of 113.44-112.32 measuring from 112.83), below there would bring subsequent decline to 111.47 support but oversold condition would limit downside and reckon 111.11 support would remain intact.
In view of this, we are holding on to our short position entered at 112.25. Only above resistance at 112.59 would abort and signal low is formed instead, risk a stronger rebound to indicated resistance level at 112.83.
USD/JPY Mid-Day Outlook
Daily Pivots: (S1) 112.10; (P) 112.31; (R1) 112.49; More...
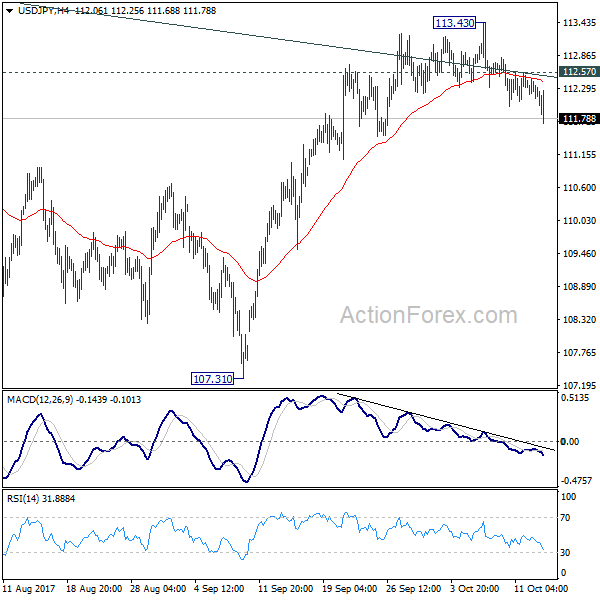
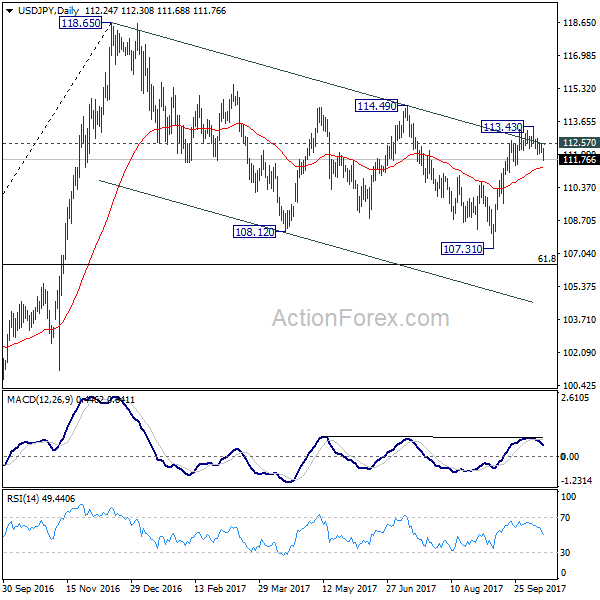
USD/JPY's fall from 113.43 short term top extends in early US session and intraday bias remains on the downside. Deeper decline would be seen to 55 day EMA (now at 111.35) first. On the upside, above 112.57 minor resistance will turn intraday bias neutral first. But risk will stays on the downside as long as 113.43 resistance holds.
In the bigger picture, rise from 98.97 (2016 low) is seen as the second leg of the corrective pattern from 125.85 (2015 high). It's unclear whether this this second leg has completed at 118.65 or not. But medium term outlook will be mildly bearish as long as 114.49 resistance holds. And, there is prospect of breaking 98.97 ahead. Meanwhile, break of 114.49 will bring retest of 125.85 high. But even in that case, we don't expect a break there on first attempt.
Dollar Back Under Pressure after Tamer than Expected Core CPI Reading
Dollar is under selling pressure again in early US session after weaker than expected inflation data. Headline CPI rose 0.5% mom, 2.2% yoy in Septembers, up from 0.4% mom, 1.9% yoy in August, but missed expectation of 0.6% mom, 2.3% yoy. Core CPI rose 0.1% mom, 1.7% yoy, comparing to August's 0.2% mom, 1.7% yoy. More importantly, core CPI missed consensus of 0.2% mom, 1.8% yoy. Retail sales came in slightly better than expected and rose 1.6% in September. Ex auto-sales rose 1.0%. Dollar was sold off earlier this week after FOMC minutes showed policymakers are concerned with sluggishness in inflation. It's resuming that selloff now and that should keep Dollar as the weakest one for the week.
Euro turned mixed on ECB report
Euro trades lower today on media report that ECB is going to half asset purchase target. Markets seems to be dissatisfied with it and in particular, policymakers are divided on how long would the program be extended. The current EUR 60b per month pace could be lowered to EUR 30b per month, starting January. Separately, President Mario Draghi reiterated that interest rate will remain at the current record low "well past" the end of the asset purchase program. He emphasized that the "'well past' is very, very important in anchoring rate expectations." ECB is widely expected to "recalibrate" its asset purchase program this month on October 26.
Released from Europe, Swiss PPI rose 0.5% mom, 0.8% yoy in September. German CPI was finalized at 0.1% mom, 1.8% yoy in September.
Sterling to end as the strongest one for the week
Much volatility is seen in Sterling this week and the pound could end the week as the strongest one. A German newspaper Handelsblatt quoted unnamed source that EU could give that extension to UK under the conditions that the latter will fullfil all obligations as a member country. However, UK will be required to give up its voting rights. If it's true, more time will be allowed for business and citizens of both UK and EU to adjust to the changes.
Meanwhile, BBC reported that a draft paper was submitted to the 27 EU states by European Council President Donald Tusk. The paper indicates that free trade talks could start as soon as December. It's near impossible that EU officials will give a "go" signal for trade discussion at the October 19/20 summit due to lack of "sufficient progress" in the negotiations. But opening up the case for start trade agreements in December could give UK the "carrots" for being more decisive on closing issues like the divorce bill.
China trade surplus narrowed
Released from China, trade surplus surprisingly narrowed to a 6-month low of US$28.5B in September, from US$42B a month ago. The market had anticipated a milder drop to US$39.5B. Growth in exports improved to 8.1% y/y from 5.5% in August, while growth imports accelerated significantly to +18.7% from July's +13.3%.
Notwithstanding a disappointing headline, the report continued to paint a healthy picture on China's economic outlook. A stronger-than-expected imports growth underpinned domestic economic strength. Exports growth, despite missing consensus, still picked up from the same period last year.
More importantly, a narrowing trade surplus could tame the US' complaint of China's currency manipulation. This should help the government maintain a stable and modestly strong renminbi as CCP's 19th national congress approaches. More in Strong Domestic Demand Despite Weak Surplus Headline.
Elsewhere
New Zealand Business NZ manufacturing index dropped to 57.5 in September. Japan M2 rose 4.1% yoy in September.
USD/JPY Mid-Day Outlook
Daily Pivots: (S1) 112.10; (P) 112.31; (R1) 112.49; More...
USD/JPY's fall from 113.43 short term top extends in early US session and intraday bias remains on the downside. Deeper decline would be seen to 55 day EMA (now at 111.35) first. On the upside, above 112.57 minor resistance will turn intraday bias neutral first. But risk will stays on the downside as long as 113.43 resistance holds.
In the bigger picture, rise from 98.97 (2016 low) is seen as the second leg of the corrective pattern from 125.85 (2015 high). It's unclear whether this this second leg has completed at 118.65 or not. But medium term outlook will be mildly bearish as long as 114.49 resistance holds. And, there is prospect of breaking 98.97 ahead. Meanwhile, break of 114.49 will bring retest of 125.85 high. But even in that case, we don't expect a break there on first attempt.
Economic Indicators Update
| GMT | Ccy | Events | Actual | Forecast | Previous | Revised |
|---|---|---|---|---|---|---|
| 21:30 | NZD | Business Performance of Manufacturing Index Sep | 57.5 | 57.9 | ||
| 23:50 | JPY | Japan Money Stock M2+CD Y/Y Sep | 4.10% | 4.00% | 4.00% | |
| 00:30 | AUD | RBA Financial Stability Review | ||||
| 03:30 | CNY | Trade Balance (USD) Sep | 28.5B | 38.1B | 42.0B | |
| 03:30 | CNY | Trade Balance (CNY) Sep | 193B | 266B | 287B | |
| 06:00 | EUR | German CPI M/M Sep F | 0.10% | 0.10% | 0.10% | |
| 06:00 | EUR | German CPI Y/Y Sep F | 1.80% | 1.80% | 1.80% | |
| 07:15 | CHF | Producer & Import Prices M/M Sep | 0.50% | 0.30% | 0.30% | |
| 07:15 | CHF | Producer & Import Prices Y/Y Sep | 0.80% | 0.60% | 0.60% | |
| 12:30 | USD | CPI M/M Sep | 0.50% | 0.60% | 0.40% | |
| 12:30 | USD | CPI Y/Y Sep | 2.20% | 2.30% | 1.90% | |
| 12:30 | USD | CPI Core M/M Sep | 0.10% | 0.20% | 0.20% | |
| 12:30 | USD | CPI Core Y/Y Sep | 1.70% | 1.80% | 1.70% | |
| 12:30 | USD | Advance Retail Sales Sep | 1.60% | 1.50% | -0.20% | -0.10% |
| 12:30 | USD | Retail Sales Less Autos Sep | 1.00% | 0.90% | 0.20% | 0.50% |
| 14:00 | USD | U. of Michigan Confidence Oct P | 95.1 | 95.1 | ||
| 14:00 | USD | Business Inventories Aug | 0.50% | 0.20% |
Pound Edges Higher, Investors Eye US Consumer Inflation, Spending Data
The British pound has posted small gains in the Friday session. Currently, GBP/USD is trading at 1.3291, up 0.18% on the day. On the release front, there are no major British events on the schedule. In the US, we'll get a look at CPI and retail sales, as well as UoM Consumer Sentiment.
After three losing weekly sessions, the British pound appears to have reversed the trend, and is headed for considerable gains this week. Currently, GBP is trading close to the 1.32 line, up 1.6 percent this week. Still, the currency could face rough waters, as there are reports that that the Brexit talks are deadlocked. British and European negotiators remain far apart on a range of key issues, such as the amount that Britain will pay to the EU when it leaves the European Union. The sides haven't discussed this thorny point, but the Europeans have insisted that significant progress must first be made on this issue before they will discuss a new trade agreement with Britain. The Europeans have little interest in rewarding Britain with favorable divorce terms, but this strategy could lead to Britain simply picking up and leaving the club without a deal. With senior British ministers openly divided on how tough a stance Britain should take over Brexit, it will not come as a surprise if the negotiations simply grind to a halt.
The markets remain very optimistic that a December rate hike is on the way, and this sentiment hasn't changed after the release of the Federal Reserve minutes. The minutes indicated that many policymakers felt that a December hike "was likely to be warranted". However, some policymakers remain concerned about low inflation levels and said that inflation would be a consideration in their decision on a rate hike. The odds of a December hike have increased dramatically in the past few weeks, mostly in response to Fed Chair Yellen and other FOMC members expressing optimism that inflation will move upwards. On Wednesday, Kansas City Fed President Esther George went event further, saying that low inflation did not pose a problem, as the US economy was strong and the labor market was at full capacity. Investors will be carefully monitoring Friday's CPI reports as well as the Fed reaction. Currently, fed futures have priced in a December hike at 87 percent.
WTI Ascending Channel Intact
The WTI is in a strong AP ascending channel and currently it's trying to reach strong D H5 resistance. We might see some short term profit taking here, leading to retracement.
Potential fresh buying interest comes within the POC zone 50.65-85 (D H3, order block, ATR pivot, channel bottom) where we could see buyers in the case of pullback. Targets are D camarilla pivots as shown on the chart including the W H5 pivot - 51.52. If the price proceeds upwards without a pullback, pay attention to 51.92, where we could see a rejection do to order block and historical sellers. Rejection might target a 51.55 retest.
- H3 - Weekly Camarilla Pivot (Weekly Interim Resistance)
- W H4 - Weekly Camarilla Pivot (Strong Weekly Resistance)
- D H4 - Daily Camarilla Pivot (Very Strong Daily Resistance)
- D L3 - Daily Camarilla Pivot (Daily Support)
- D L4 - Daily H4 Camarilla (Very Strong Daily Support)
- PPR - Progressive Polynomial Channel
- POC - Point Of Confluence (The zone where we expect price to react aka entry zone)