Sample Category Title
DAX Quiet As German Final CPI Matches Estimate
The DAX is showing little movement in the Wednesday session. Currently, the index is at 12,988.50, up 0.04% on the day. On the release front, there is only one event out of the eurozone. German Final CPI posted a small gain of 0.1%, matching the forecast.
The ECB will hold a critical policy meeting on October 26, but any hopes of a rate hike were dashed on Thursday by Mario Draghi. The ECB President stated that he plans to maintain ultra-low rates “well past” the end of its bond-buying program in December. The ECB has been under pressure to tighten monetary policy, primarily from Germany, where the central bank has called for tighter policy, given the stronger eurozone economy. The ECB is expected to taper its monthly bond purchases of 60 billion euros at the October policy meeting, but Draghi has sent out a clear message that rate hikes will have to wait until 2018. With inflation levels will below the ECB target of around 2 percent, Draghi has been reluctant to raise interest rates until inflation shows clear signs of moving upwards.
Spain’s constitutional crisis continues to rock the country. Earlier in the week, Catalan President Carles Puigdemont declared Catalonia’s independence, but then suspended the move, saying he wants talks with Madrid. However, Spanish Prime Minister Mariano Rajoy is in no mood to chat, and gave Puigdemont eight days to retract his declaration of independence. Otherwise, Rajoy has threatened to suspend the Catalan parliament and impose direct rule from Madrid. The Spanish government has the backing of France, Germany, and other European Union members, and Catalonia itself appears evenly divided on independence. With both sides entrenched in their positions, the crisis is set to continue into next week. The crisis could take a toll on the Spanish economy, as several banks and large corporations have said they will move their legal headquarters out of Catalonia. The EU has refused to mediate, and is treating the issue as a domestic Spanish matter.
Euro Unchanged As German Final CPI Matches Forecast
The euro is unchanged in Friday trading. Currently, EUR/USD is trading at 1.1829, down 0.01% on the day. On the release front, German Final CPI came in at 0.1%, matching the forecast. Traders should be prepared for some movement from the pair in the North American session, as the US releases CPI and retail sales reports. The US will also release UoM Consumer Sentiment.
The Federal Reserve minutes from the September meeting appeared to confirm that a December rate increase is on the way. The minutes showed that many policymakers felt that a December hike “was likely to be warranted”. However, some policymakers remain concerned about low inflation levels and said that inflation would be a consideration in their decision on a rate hike. The odds of a December hike have increased dramatically in the past few weeks, mostly in response to Fed Chair Yellen and other FOMC members expressing optimism that inflation will move upwards. On Wednesday, Kansas City Fed President Esther George went event further, saying that low inflation did not pose a problem, as the US economy was strong and the labor market was at full capacity. Investors will be carefully monitoring Friday’s CPI reports as well as the Fed reaction. Currently, fed futures have priced in a December hike at 87 percent.
Did he or didn’t he? That is the question that Spanish Prime Minister Mariano Rajoy has demanded of Catalan President Carles Puigdemont, who last week declared Catalonia’s independence, but then suspended the move. On Wednesday, Rajoy gave Puigdemont eight days to reply and has threatened to suspend the Catalan parliament if indeed the regional government declared independence. The Catalan leader says he wants to negotiate with Madrid, but Rajoy has refused, saying session is illegal. The Spanish government has the backing of France, Germany, and other European Union members, and Catalonia itself appears evenly divided on independence. With both sides entrenched in their positions, the crisis is set to continue into next week. The crisis could take a toll on the Spanish economy, as several banks and large corporations have said they will move their legal headquarters out of Catalonia. The EU has refused to mediate, and is treating the issue as a domestic Spanish matter.
ECB President Mario Draghi said on Thursday that he plans to maintain ultra-low rates “well past” the end of its bond-buying program in December. The ECB has been under pressure to tighten monetary policy, primarily from Germany, where the central bank has called for tighter policy, given the stronger eurozone economy. The ECB is expected to taper its monthly bond purchases of 60 billion euros at its policy meeting on October 26, but Draghi has sent out a clear message that rate hikes will have to wait until 2018. With inflation levels will below the ECB target of around 2 percent, Draghi has been reluctant to raise interest rates until inflation shows clear signs of moving upwards.
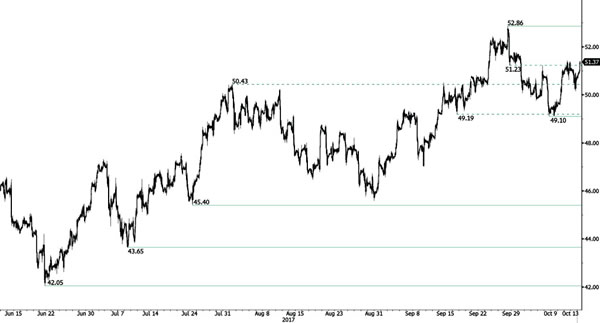
CRUDE OIL Sideways Price Action
Crude oil is consolidating within a range defined by the support at 50.43 and the hourly resistance at 51.23. Key support is given at 45.40 (17/08/2017 high). Strong resistance lies at 52.86 (28/09/2017). Expected to show continued weakness.
In the long-term, crude oil has recovered after its sharp decline last year. However, we consider that further weakness are very likely. For the time being the pair lies in an upside momentum. Strong support lies at 35.24 (05/04/2016) while resistance can now be found at 55.24 (03/01/2017 high).
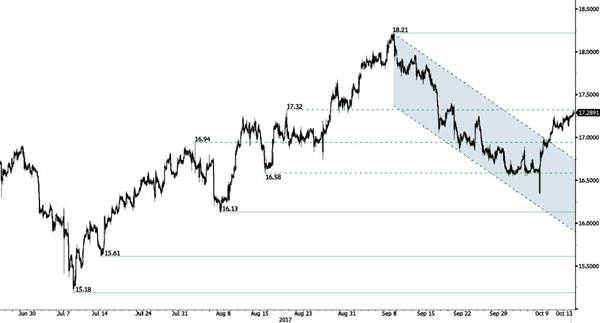
SILVER Higher
Silver has further improved as can be seen by the move above the resistance at $17.25. The precious metal is now trading above $17. Hourly support can be found at 16.13 (06/10/2017 low). Expected to show further increase.
In the long-term, the trend is rater negative. Further downsides are very likely. Resistance is located at 25.11 (28/08/2013 high). Strong support can be found at 11.75 (20/04/2009).
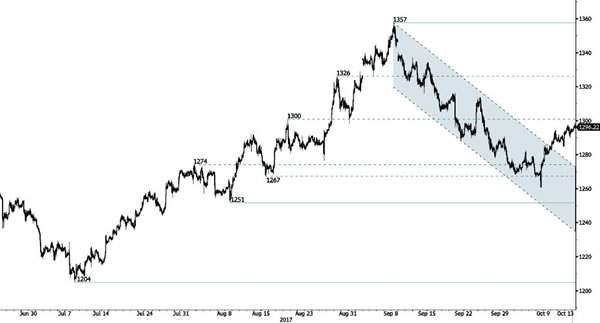
GOLD Eyeing $1300
Gold has broken downtrend channel precious metal that drove the precious metal from 1357 to hourly support given at 1267 (15/08/2017 low). Strong support lies at a distance at 1204 (10/07/2017 high). Expected to show further upside move.
In the long-term, the technical structure suggests that there is a growing upside momentum. A break of 1392 (17/03/2014) is necessary ton confirm it, A major support can be found at 1045 (05/02/2010 low).
BITCOIN Sky Is The Limit
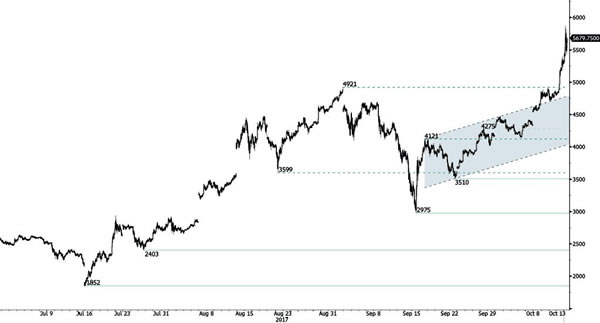
Bitcoin is definitely on a strong momentum. Strong support is given at 2975 (22/08/2017 low). Sell walls around $4000 have been broken. Bitcoin si ready to set up new all-time high. The road is wide open for further increase.
In the long-term, the digital currency has had an exponential growth. There are decent likelihood that the asset will reach $10'000.
EUR/CHF Breaking Out
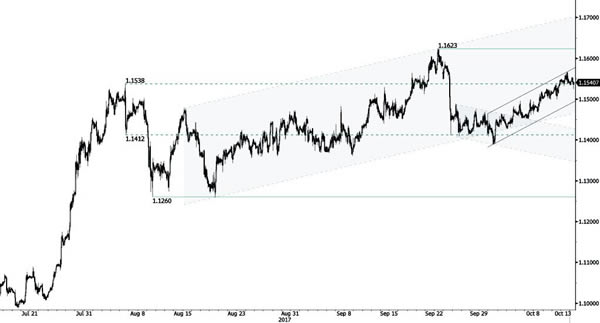
EUR/CHF has broken to the upside of its channel range. Strong resistance lies at a distance at now at 1.1623 (22/09/2017 high). Support is given at 1.1388 (02/09/2017 low). Downside risk is very likely.
In the longer term, the technical structure has reversed. Strong resistance is given at 1.20 (level before the unpeg). Yet, the ECB's QE programme is likely to cause persistent selling pressures on the euro, which should weigh on EUR/CHF. Supports can be found at 1.0184 (28/01/2015 low) and 1.0082 (27/01/2015 low).
EUR/GBP Consolidation
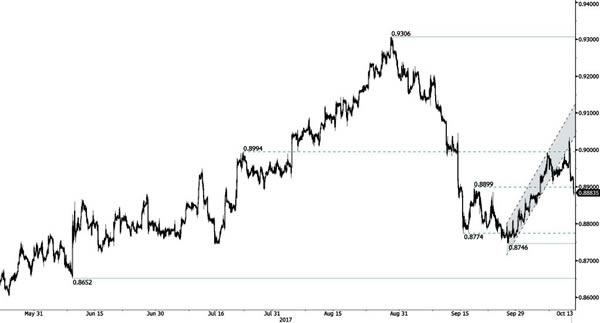
EUR/GBP drifting high but well within recent ranges. The pair has broken the resistance at 0.8899 (19/09/2017 low). The very short-term technical structure is biased to the upside. Hourly support is given at 0.8906 (09/10/2017).
In the long-term, the pair has largely recovered from recent lows in 2015. The technical structure suggests a growing upside momentum. The pair is trading above from its 200 DMA. Strong resistance can be found at 0.9500 (psychological level).
AUD/USD Bullish Momentum Continues
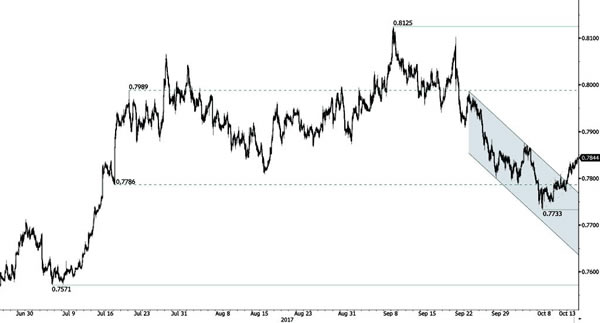
AUD/USD is strengthening breaking above rising channel top. Next resistance is given at 0.7875 (04/10/2017 high). Support lies at at 0.7733 (06/10/2017 low). Expected to show continued increase.
In the long-term, the trend is turning positive. Key supports stands at 0.6009 (31/10/2008 low) . A break of the key resistance at 0.8164 (14/05/2015 high) is needed to invalidate our long-term bearish view.
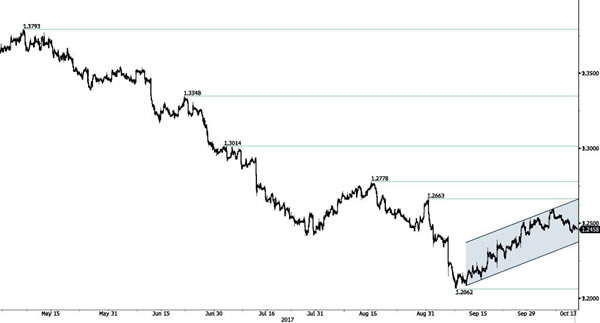
USD/CAD Middle Of Rising Channel
USD/CAD continues to bounce within uptrend channel. Strong support is located at a distance at 1.2062 (08/09/2017 low). Hourly support lies at 1.2331 (26/09/2017 high). Resistance is given at 1.2663 (31/08/2017 high). Expected to show continued short-term bullish pressures within uptrend channel.
In the longer term, the pair has broken longterm support that can be found at 1.2461 (16/03/2015 low). Strong resistance is given at 1.4690 (22/01/2016 high). The pair is likely to head further lower.