
Sample Category Title
USDJPY Hits New Weekly Low
The USDJPY pair has fallen to its lowest trading level since September 26th, hitting 111.85, as the U.S dollar index comes under further pressure ahead of the release of key inflation data for the U.S economy.
Intraday trading sentiment surrounding the USDJPY is slightly bearish, as the pairs upside rallies continue to fail, while sellers are now pushing price lower, creating bearish lower daily time frame price-lows on the charts.
Today's U.S inflation data is likely to be seen as key measure of the U.S dollars appetite for further gains, whilst a negative CPI headline figure is likely to be taken as very bearish for the U.S dollar index.
A sustained trading period below the 111.90 level should cement a further sell-off for the USDJPY pair, whilst a move above the 112.57 level should lead to further buying towards the 113 handle.
Key intraday technical support below the 111.90 level is located at 111.69 and the pairs key 200-day moving-average, at 111.40. Once below the 111.40 level, the 111 level comes into focus, as does the key 110.80 support zone.
To the upside, key intraday resistance is found at 112.25 and the former swing high, at 112.57. Once above 112.57, further intraday resistance is seen at 113 and 113.25.
GBPUSD Drops from 1.3323 Resistance
The British pound has fallen from the 1.3323 resistance area against the U.S dollar during the European trading session, after a German government spokesman said it is too early for the United Kingdom to discuss any Brexit transition ideas.
After briefly dipping to 1.3247 on the headline, the GBPUSD pair has found strong buying interest back towards the 1.3290 region. Trading sentiment surrounding the pair remains bullish, despite the earlier drop, as traders begin to factor in an upcoming rate hike from the BOE.

From a technical perspective, the GBPUSD pair is creating lower price-lows and higher price-highs. Traders can also observe a dip-buying mentality returning to the GBPUSD pair.
Going forward, investors will now look to a raft of U.S economic data out, shortly, and the GBPUSD weekly price close, with closes below the 1.3220 level considered bearish.
Key intraday resistance for the GBPUSD pair above the 1.3323 level is located at 1.3360 and 1.3400. Once above the 1.3400 level, further resistance is seen at 1.3424 and 1.3450.
To the downside, key intraday GBPUD support is found at 1.3260 and the former swing-price low at 1.3247. Below the 1.3247 level, further support is found at 1.3220 and 1.3200.
Yen Steady At 112, Markets Eye CPI, Retail Sales
The Japanese yen has ticked higher in the Friday session. Currently, USD/JPY is trading at 1.1217, down 0.10% on the day. On the release front, there are no Japanese events on the schedule. It’s a busy day in the US, with the release of inflation, retail sales and consumer confidence reports.
Is inflation in Japan finally moving upward? Japanese PPI has steadily moved higher in 2017, and improved in September to 3.0%. Last week, Tokyo Core CPI, a key gauge of consumer inflation, has also shown improvement this year, and the September reading of 0.5% marked the highest gain since March 2015. The gains are linked to a stronger Japanese economy, and on Tuesday a BoJ report gave a thumbs-up to the economy, noting that exports were strong and consumer spending and construction had strengthened. The BoJ has not budged from its inflation target of 2 percent, although it has been forced to lower its inflation forecast a number of times. Earlier this month, the BoJ said that it does not expect its target to be met before 2020.
The Federal Reserve minutes, released on Wednesday, appeared to confirm that a December rate increase is on the way. The minutes showed that many policymakers felt that a December hike “was likely to be warranted”. However, some policymakers remain concerned about low inflation levels and said that inflation would be a consideration in their decision on a rate hike. The odds of a December hike have increased dramatically in the past few weeks, mostly in response to Fed Chair Yellen and other FOMC members expressing optimism that inflation will move upwards. On Wednesday, Kansas City Fed President Esther George went event further, saying that low inflation did not pose a problem, as the US economy was strong and the labor market was at full capacity. Investors will be carefully monitoring Friday’s CPI reports as well as the Fed reaction. Currently, fed futures have priced in a December hike at 87 percent.
Technical Outlook: WTI OIL Extends Rally On Repeated Inventories Draw, Signs Of Tightening
WTI Oil hit new high at $51.62 on Friday (the highest since 02 Oct) as bulls regained control after the price dipped to $50.14 low on Thursday.
Fresh support came from EIA crude stocks report which showed the third consecutive decline in crude inventories which fell by 2.75 million barrels in the week ended 6 Oct.
In addition, the oil prices were driven higher by rising bullish sentiment on global signs that the oil market is tightening.
Eventual break above $51.40 pivot (Fibo 61.8% of $52.84/$49.09 downleg) is bullish signal which requires close above for confirmation.
Fresh bulls eye target at $51.96 (Fibo 76.4%) and could extend towards key barrier at $52.84 (28 Sep peak) on further bullish acceleration.
Overbought slow stochastic and still negative 14d momentum require caution of possible stall.
Top of thick 4-hr cloud marks solid support at $50.97, along with broken 20SMA ($50.80) which should keep the downside protected, while extension below 10SMA / Tenkan-sen ($50.43/36) would weaken near-term tone and shift bias lower.
Res: 51.62, 51.96, 52.41, 52.84
Sup: 51.40, 50.97, 50.80, 50.36
Market Update – European Session: Focus On Upcoming US CPI Data
Notes/Observations
ECB said to consider cutting QE in half to €30B/month from Jan
Brexit Transition hope of a two-year transition period at today’s meeting of ambassadors in Brussels
EU Leader summit draft to assess progress in talks at Dec summit but welcomed progress so far (in-line with Barnier comments)
South Africa Supreme Court of Appeal dismissed President Zuma’s appeal against a ruling to reinstate corruption charges against him
Focus on upcoming US Sept CPI data for insight on Dec FOMC
Overnight
Asia:
China Sept Trade Balance: $28.5B v $38.0Be
RBA Financial Stability Review: concerns that the combination of low interest rates and low volatility in financial markets is promoting excessive risk-taking via a search for yield. Indebtedness and asset prices have also risen further in some countries
Europe:
ECB said to consider cutting QE to €30B/month from Jan and extending it until at least Sept 2018
ECB's Draghi: Pledge to keep rates low “well past” QE is very important in anchoring rate expectations
Germany Fin Min Schaeuble: Optimistic Germany will have new govt before Christmas
EU draft summit statement: EU leaders will approve internal talks on post-Brexit relationship next week, but will refuse to begin discussions with UK until further progress is made on divorce proceedings
EU Chief Negotiator Barnier reportedly could offer the UK a two-year transition to stay in the EU market
Americas:
Fed’s Bostic (non-voter): Reiterates not sure if Fed will raise rates in Dec
Fed's Rosengren (moderate, non-voter): sees high probability of Dec rate hike; three hikes in 2018 seems approximately right
Fed's Bullard (non-voter, dove): central bank risks losing credibility, and could trigger recession, if it insists on normalization without better evidence of firming prices
White House spokesperson Sanders: Decision on new Fed chair nominee is still some time away, with interviews ongoing
President Trump said to plan to end subsidy payments to insurers related to sale of Obamacare insurance coverage
Economic data
(NL) Netherlands Aug Retail Sales Y/Y: 5.6% v 2.9% prior
(DE) Germany Sept Final CPI M/M: 0.1% v 0.1%e; Y/Y: 1.8% v 1.8%e
(DE) Germany Sept Final CPI EU Harmonized M/M: 0.0% v 0.0%e; Y/Y: 1.8% v 1.8%e
(FI) Finland Sept CPI M/M: 0.2% v 0.3% prior; Y/Y: 0.8% v 0.7% prior
(FI) Finland Aug GDP Indicator Y/Y: 2.7% v 3.6% prior
(CH) Swiss Sept Producer & Import Prices M/M: 0.5% v 0.3%e; Y/Y: 0.8% v 0.6%e
(IT) Italy Sept Final CPI -0.3% v -0.3% prelim; Y/Y: 1.1% v 1.1% prelim; CPI Index (Ex-Tobacco): 101.1 v 101.4 prior
(IT) Italy Sept Final CPI EU Harmonized 1.8% v 1.8% prelim; Y/Y: 1.3% v 1.3% prelim
(IT) Italy Aug General Government Debt: €2.279T v €2.300T prior
Fixed Income Issuance:
(IN) India sold total INR150B vs. INR150B indicated in 2024, 2027, 2034 and 2046 bonds
SPEAKERS/FIXED INCOME/FX/COMMODITIES/ERRATUM
Equities
Indices [Stoxx600 +0.3% at 391.4, FTSE -0.3% at 7530, DAX flat at 12985, CAC-40 flat at 5358, IBEX-35 flat at 10277, FTSE MIB +0.2% at 22442, SMI flat at 9293, S&P 500 Futures flat]
Market Focal Points/Key Themes:
European Indices trade in a narrow range with the exception of the FTSE100 which trades modestly lower on strength in Sterling as it retreats from record highs.
Decliners in the UK lead by GKN after its trading update and Q4 charge, whilst Ashmore and Man Group trade higher after increases in AUM. Bayer trades higher after divesting parts of its seed and herbicide business as it looks to gain approval for its acquistion of Monsanto.
Looking ahead banking giants Bank of America and Wells Fargo are set to report along with PNC Bank.
Equities
Industrials: [GKN [GKN.UK] -7.4% (Trading update)]
Financials: [Man Group [EMG.UK] +2.9% (FUM data), Ashmore [ASHM.UK] +8% (Trading update), Provident Financial [PFG.UK] +16.5% (trading update)]
Telecom: [ TalkTalk [TALK.UK] -6.2% (Holder sells 4.7% stake at 210p/shr)]
Healthcare: [Bayer [BAYN.DE] +1.0%, BASF [BAS.DE] -0.6% (BASF signs agreement to acquire significant parts of Bayer's seed and non-selective herbicide businesses for €5.9B in cash)]
Speakers
ECB's Weidmann (Germany) said to be against any softening of the capital key. Opposes a softening of rules governing the division of bond purchases by country
ECB's Hansson (Estonia): Reiterates monetary policy has to remain accommodatve (in-line with Council view). Could think about new longer-term financing operations and feasible to buy more corporate bonds and less public sector
EU's Juncker: Brexit process will take longer than what the UK believed. UK would have to pay if Britain wants to move into 2nd phase of negotiations
Germany Economic Ministry: Economic upturn to continue in coming years (**Reminder: On Oct 11th German Economic Ministry Fall economic forecasts raised its GDP growth forecasts for both 2017 and 2018 period)
Catalan President Puigdemont reportedly pressured to apply Catalan independence. CUP Party (Far right) urges Puigdemont to formally declare a split from the central govt in writing
Sweden Think Tank NIER 2017 Wage Formation Report noted that weak productivity development affected domestic wages
South Africa Appeals Court upheld the ruling of high court that Zuma appeal against charges dropped - ruling on President Zuma's bribery case
South Africa Ruling ANC party: To study Supreme Court of Appeal's ruling on Zuma
Iran Parliamentary Speaker: If US leaves nuclear deal than that will be the end of it
Currencies
GBP/USD rose for the 5th straight session. Dealers noted that prospect of the Bank of England raising interest rates next month relegated Brexit concerns to the background for now. EU Chief Negotiator Barnier reportedly could offer the UK a two-year transition to stay in the EU market. GBP/USD above 1.33 level just ahead of the NY morning.
EUR/USD at 1.1825 (little changed in session). Dealers noted that focus from the euro zone's political concerns to its brightening economic outlook. The divergence factor in rates also provide some impetus as the recent FOMC minutes showed that some central bankers were still concerned about persistently low inflation.
The Nikkei 225 Index hit a fresh 21-year high and closed above the 21,00 level for 1st time since Nov 1996. However, the usual correlation of a weak yen currency did not take place in the session. USD/JPY hovering around the 112 level lower by 0.2% in session.
The South African Rand (ZAR) currency was firmer after South Africa Supreme Appeals Court upheld the high court on President Zuma's bribery case. The; Zuma appeal against charges were dropped.
Fixed Income
Bund futures trade at 161.76 up 24 ticks as focus remains on reports that the ECB will consider cutting QE to €30B monthly from Jan and extending it to September. Continued downside targets 161.03 while upside resistance stands initially at 162.07, followed by 163.27.
Gilt futures trade at 123.58 down 15 ticks with no major UK releases due for today. Continued downside eyeing 123.26. Upside targets 124.90 then 125.24.
Friday’s liquidity report showed Thursday’s excess liquidity fell to €1.807T from €1.809T and use of the marginal lending facility fell to €89M from €161M.
Corporate issuance was fairly muted with $1.75B coming to market via 4 issuers headlined by Brazilian steel producer, Gerdau $650M offering.
For the week ending Oct 11th Lipper fund flows reported IG fund net inflows of $2.42B bringing YTD inflows to $98.7B, while High yield funds reported net inflows to $966M bringing YTD outflows to $6.37B.
Looking Ahead
05:30 (LX) ECB’s Mersch (Luxembourg) at conference
05:30 (ZA) South Africa to sell combined ZAR800M in I/L 2025, 2033 and 2046 bonds
06:00 (UK) DMO to sell combined £4.5B in 1-month, 3-month and 6-month Bills (£0.5B, £2.0B and £2.0B respectively)
06:45 (US) Daily Libor Fixing
07:30 (IN) Weekly India Forex Reserves
08:00 (PL) Poland Sept CPI Core M/M: +0.1%e v -0.2% prior; Y/Y: 0.9%e v 0.7% prior
08:00 (IS) Iceland Sept Unemployment Rate: No est v 1.9% prior
08:00 (UK) Baltic Dry Bulk Index
08:00 (DE) ECB’s Weidmann (Germany) with German Fin Min Schaeuble at event
08:00 (ES) Spain Debt Agency (Tesoro) announces upcoming issuance
08:00 (IN) India announces upcoming Bill auction (held on Wed)
08:30 (US) Sept CPI M/M: 0.6%e v 0.4% prior; Y/Y: 2.3%e v 1.9% prior
08:30 (US) Sept CPI Ex Food and Energy M/M: 0.2%e v 0.2% prior; Y/Y: 1.8%e v 1.7% prior
08:30 (US) Sept CPI Index NSA: 246.901e v 245.519 prior; CPI Core Index SA: 253.017e v 252.54 prior
08:30 (US) Sept Advance Retail Sales M/M: +1.7%e v -0.2% prior; Retail Sales Ex Auto M/M: 0.9%e v 0.2% prior; Retail Sales Ex Auto and Gas: +0.4%e v
0.1% prior; Retail Sales Control Group: +0.4%e v -0.2% prior
08:30 (US) Sept Real Avg Weekly Earnings Y/Y: No est v 0.9% prior; Real Avg Hourly Earning Y/Y: No est v 0.6% prior
08:30 (US) Weekly USDA Net Export Sales
08:30 (US) Fed's Rosengren (moderate, non-voter) opens conference on monetary policy
10:00 (US) Oct Preliminary University of Michigan Confidence: 95.0e v 95.1 prior
10:00 (US) Aug Business Inventories: 0.7%e v 0.2% prior
11:00 (US) Colombia Aug Industrial Production Y/Y: -1.0%e v +6.2% prior
11:00 (US) Colombia Aug Retail Sales Y/Y: 1.2%e v 3.1% prior
10:15 (PT) ECB’s Constancio (Portugal) on panel in Washington
10:25 (US) Fed's Evans (dove, voter) on monetary policy
11:00 (EU) Potential sovereign ratings after European close
(FR) France Sovereign Debt to be rated by Moody's
(GR) Greece Sovereign Debt to be rated by Moody's
(LX) Luxembourg Sovereign Debt to be rated by Fitch
11:30 (US) Fed's Kaplan (moderate, voter) in Boston
12:00 (IS) Iceland Sept International Reserves (ISK): No est v 688B prior
13:00 (US) Weekly Baker Hughes Rig Count data
13:00 (US) Fed's Powell canceled planned speaks at Boston Fed Economic Conference
14:00 (CO) Colombia Central Bank Minutes
14:10 (UK) BOE’s Saporta in Washington
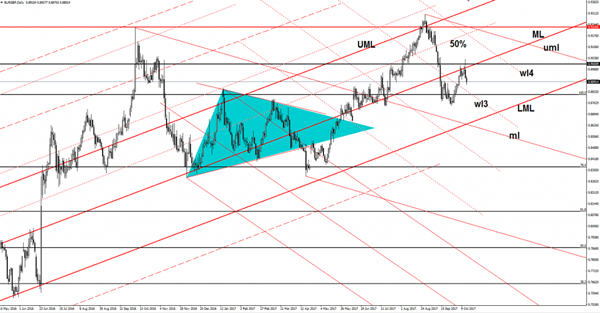
EUR/GBP Attracted By Confluence Area
EUR/GBP drops after the retest of the median line (ML) of the major ascending pitchfork. We had two false breakouts above the ML, so the current drop is understandable. Is attracted by the confluence area formed between the 100% level with the third warning line (wl3). The next major downside target will be at the lower median line (LML) of the ascending pitchfork.
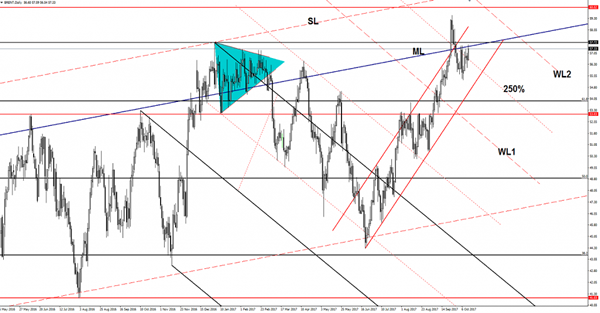
Brent Another False Breakout?
Price rallied today and resumed the minor rebound. Brent is pressuring the median line (ML) of the major blue ascending pitchfork and could retest the 57.72 resistance level as well. I’ve said in the previous days that the rate could come to retest the ML before will make a crucial decision. Only a valid breakout above the mentioned resistance levels will announce a further increase on the short term.
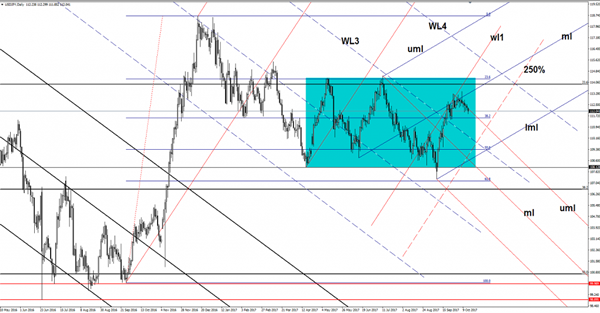
USD/JPY On The Way Down
The USD/JPY dropped significantly today and resumed the downside movement. I’ve said in the previous days that the rate is somehow expected to drop further even if the Nikkei stock index has rallied and has reached fresh new highs today. The USD/JPY drop as the USDX is still under selling pressure on the short term.
Technically, the current minor decrease is natural after several false breakouts, but remains to see how long this will be because the USDX is somehow expected to pick up again.
Today could be crucial for the USD, the US data could shake the markets and will have a huge influence on the dollar’s move. The greenback needs a helping hand to take control again and to dominate the currency on the short term.
Price drops further and should hit the 38.2% retracement level very soon. I’ve added a minor red descending pitchfork hoping that I’ll catch a potential downside momentum. You can see that USD/JPY is going down along the upper median line (uml) of the minor descending pitchfork, a retest of this obstacle will announce a breakdown below the 38.2% retracement level. A valid breakout above the mentioned dynamic resistance will signal an increase towards the 23.6% retracement level and towards the median line of the ascending pitchfork. I’ve said in the previous reports that the major downside target will be at the lower median line (lml) of the ascending pitchfork.
US CPI To Be Heavily Impacted By Storm Season, GBP Under Pressure Amid Rising Brexit Tensions
Distortion in CPI data expected
The US dollar has reversed gains as investors' confidence in Trump's tax reform fell again. After sliding as much as 1.50% since the beginning of the week, the dollar index consolidated slightly above 93 on Friday morning. However the week is far from over, the market is awaiting the release of fresh inflation data. Investors have revised their inflation expectations to the upside in September. Median forecasts for the headline measure inched up to 2.3%y/y, compared to a print of 1.9% in the previous month, in anticipation of side effects from the series of storms that hit the US during the month of September. Core inflation is expected to have risen but in to a smaller extend as investors anticipate it will print at 1.8%, up from 1.7% in August.
After contracting 0.2%m/m in August, retail sales are expected to have picked up in September with median forecast standing at 1.7%m/m. Retail sales excluding auto and gas should also recover with markets anticipating a pick-up of 0.4%m/m. Similarly, the impact of Hurricane Harvey will significantly impact the data. The challenge is to filter out its effects, an almost impossible task given the effects result from a broad range of factors as it distorted the demand for various goods and services and also impacted the oil production along the Gulf Coast.
Since even the core measure is anticipated to be biased, the investors will take the report with a grain of salt. The key USD driver at the moment will remain the upcoming rate hike, which will probably take place in December, and Trump tax reform. Neither is a done deal and by far. Against such a back, further dollar weakness has to be seriously considered. However in the medium-term, we remain dollar positive.
Brexit negotiations: Tensions are coming back
Brexit Negotiations are back into centre stage. The EU 27 Leaders are meeting today in Brussels to discuss about the further trade agreement with the UK. This promises to be intense as 27 Countries that must agree seems like a very difficult task. It is obvious that each one of the EU members does not have the same interest and the same relationship with the UK which will are making the overall EU position on trade relations very fragile.
We do not believe that the 'No deal' will be the final conclusion of the Brexit negotiations. We rather believe that the lack of unity within the European Union will benefit to the UK. The EU are definitely trying to play tough by blocking trade talks by asking the UK to first secure three main points: a guaranteed citizens right for EU citizens, a cash settlement of around 10 billion pounds and the Northern Ireland Border.
The 'No deal' issue which we consider a lose-lose scenario is however not likely according to us. In our view, EU economic difficulties (massive debt, Greek issues, immigration) will definitely help UK achieving an agreement. Catchphrases from both sides are definitely driving tensions higher.
MXN to weaken further
The Ottawa round of NAFTA negotiation have turned nasty. The first causality has been the driving ethos of globalizations and cooperation, replaced with strong protectionist bias. In this negative environment, missteps were bound to occur. MXN was rocked (despite of wide spread EM strength) as news that Mexico's Finance Minister Meade was developing trade alternatives and tariff measures in case the NAFTA negotiations disintegrated. In additions the US assistance of inclusion of a 'sunset clause' that would allow for the agreement renegotiation every five years. Rumors have plagued discussions that Trump was having side conversations with Canadians Trudeau on potential bilateral agreements.
All side quickly dismissed the 'fake' news saying it was critical to secure a multilateral agreement between all three nations. However, the optics of smiling Trudeau and grimacing Meade are telling. In our view, the probability of the full blow break up of NAFTA has increased significantly. Further MXN depreciation is expected, as markets has not incorporate fully the necessary risk premium. Breaking up NAFTA was a popular theme on Trump campaign and remains an area he has near total control over. USDMXN break of 200d MA suggest extension of bullish momentum towards triple top resistance at 19.25.
Inflation Data Eyed As Fed Policy Makers Question December Rate Hike
- US inflation data could hold the key to December Fed rate hike;
- Oil surges as China reports second highest crude imports.
- It's been a relatively calm week for financial markets and yet, with indices continuing to trade at record highs there is plenty of reason for optimism.
With the global economic outlook improving all the time, central banks have a new and equally difficult challenge on their hands, unwinding years of unconventional monetary stimulus and adapting to what has become known as the new norm. The Federal Reserve has been very much ahead of the curve on this and continues to lead the way, with interest rates having risen four times over the last two years and at least a few more pencilled in over the coming year or so.
Just as the Fed first went into quantitative easing blind, the return to normalisation has been far from conventional or straightforward and it seems policy makers are nearing an impasse, with a growing number becoming increasingly uncomfortable with raising interest rates. The problem with raising interest rates on the expectation that inflation will rise towards target due to an apparent tightness in the labour market, is that when the results take longer to materialise than first thought, policy makers will naturally doubt the models being used and whether more damage than good is being done.
With that clearly evident from the recent FOMC minutes and numerous Fed speakers we've heard from in recent weeks, today's inflation data is going to be monitored very closely for signs of price growth. The CPI reading is forecast to jump quite a bit this month, from 1.9% to 2.3%, but this is expected to reflect short-term effects, such as higher fuel prices. The core reading is also expected to rise, but a much more modest 0.1%, from 1.7% to 1.8%. While these may appear much nearer target than has been made out, it's worth noting that the CPI number is not the Fed's preferred measure of inflation but it is released a couple of weeks before the core PCE price index and therefore is followed closely for signs of price pressures building or declining.
Retail sales data will be released alongside the CPI numbers today which could make things quite volatile ahead of the open. Consumer spending is a crucial component of the US economy and something that has underwhelmed throughout the recovery and has been on a downward trajectory this year. A big spike is expected this month but once again this is likely to be a temporary bounce.
Higher oil prices are helping to drive gains in equity markets on Friday, with Brent and WTI crude both up around 2% on the day. While Donald Trump's speech later on Iran and the possibility of renewed sanctions may be supporting prices, the move is likely more down to the trade data from China and the inventory numbers on Thursday, both of which are bullish for oil. A larger than expected drawdown reported by EIA, after API reported a more than three million barrel build on Wednesday, pointed to further rebalancing in the oil markets.
This was followed overnight by China reporting the second highest ever monthly crude imports in September. Higher than expected demand and rising forecasts for demand growth next year are helping to reduce the global oversupply and aid producers in their bid to return stocks to their five year average.