Sample Category Title
USD/CHF Mid-Day Outlook
Daily Pivots: (S1) 0.9030; (P) 0.9058; (R1) 0.9087; More…
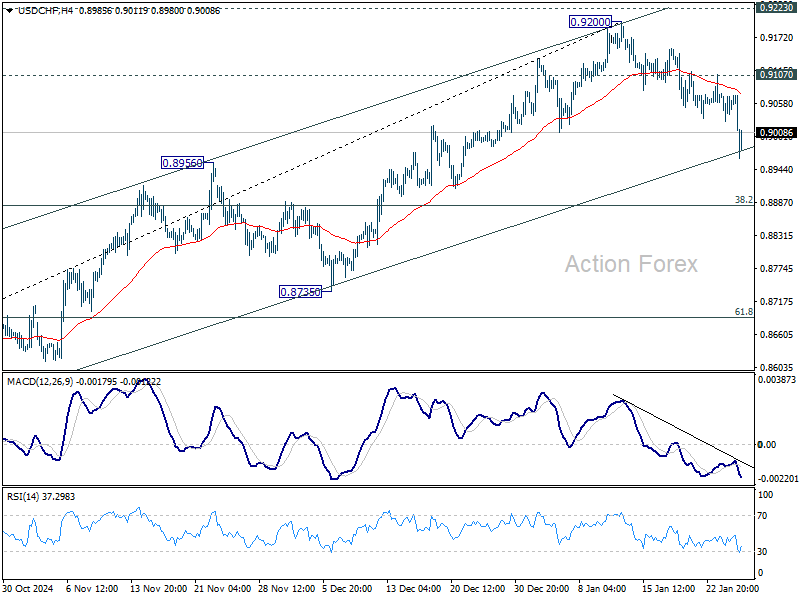
Intraday bias in USD/CHF remains on the downside as fall from 0.9200 short term top is in progress. Sustained break of 55 D EMA (now at 0.8959) will target 38.2% retracement of 0.8374 to 0.9200 at 0.8884 next. Firm break of 0.8884 will indicate bearish reversal. Nevertheless, break of 0.9107 will retain near term bullishness, and turn bias back to the upside for retesting 0.9200 high.
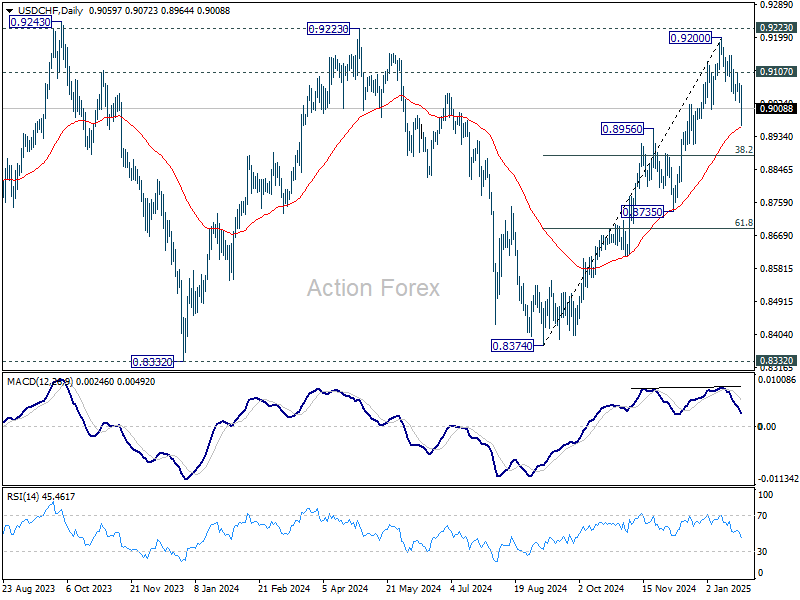
In the bigger picture, as long as 0.9223 resistance holds, price actions from 0.8332 (2023 low) are seen as a medium term corrective pattern. That is, long term down trend is in favor to resume through 0.8332 at a later stage. However, sustained break of 0.9223 will be an important sign of bullish trend reversal.
EUR/USD Mid-Day Outlook
Daily Pivots: (S1) 1.0431; (P) 1.0476; (R1) 1.0541; More...
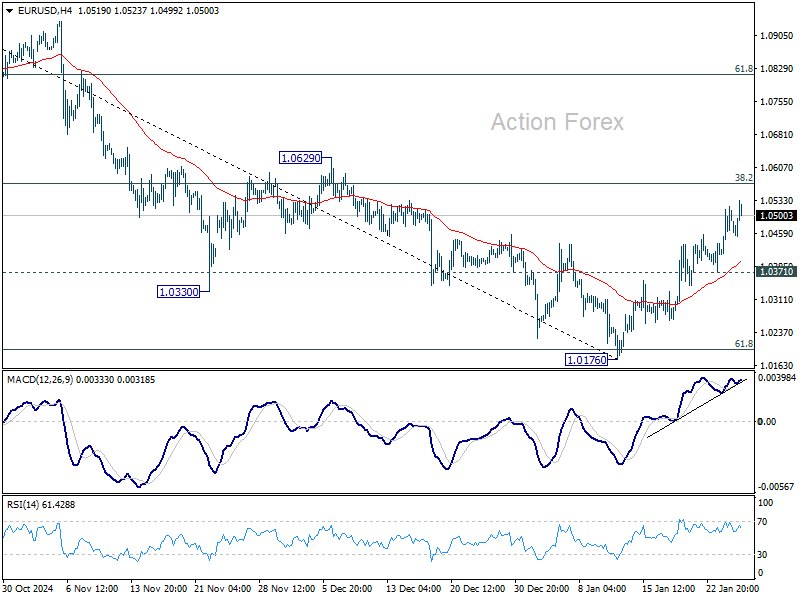
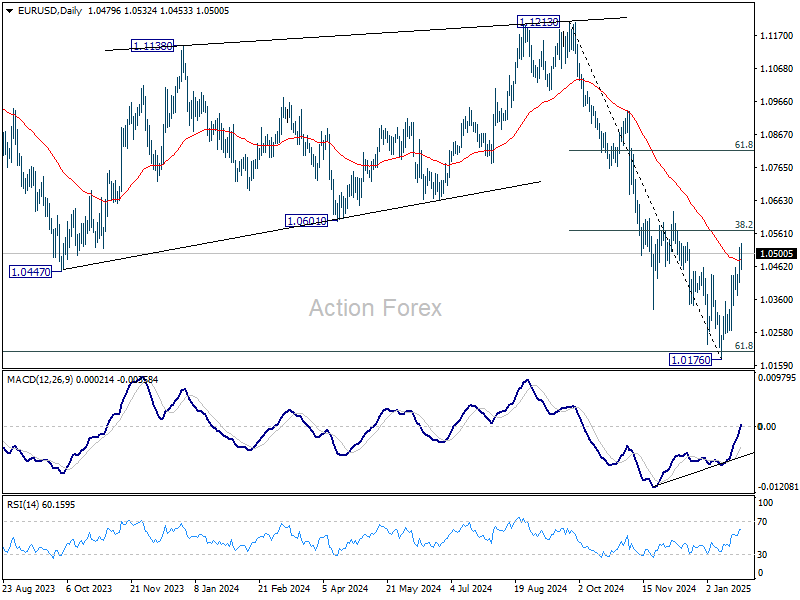
EUR/USD's rebound from 1.0176 short term bottom is in progress and intraday bias stays on the upside for 38.2% retracement of 1.1213 to 1.0176 at 1.0572. Decisive break there will raise the chance of bullish reversal, and target 61.8% retracement at 1.0817. Nevertheless, rejection by 1.0572 will maintain near term bearishness. Break of 1.0371 minor support will bring retest of 1.0176 low.
In the bigger picture, outlook is mixed as fall from 1.1274 (2023 high) could either be the second leg of the corrective pattern from 0.9534 (2022 low), or another down leg of the long term down trend. Strong support from 61.8 retracement of 0.9534 to 1.1274 at 1.0199 will favor the former case, and sustained break of 55 W EMA (now at 1.0722) will argue that the third leg might have started. However, sustained trading below 1.0199 will favor the latter case and bring retest of 0.9534 low.
GBP/USD Mid-Day Outlook
Daily Pivots: (S1) 1.2383; (P) 1.2442; (R1) 1.2543; More...
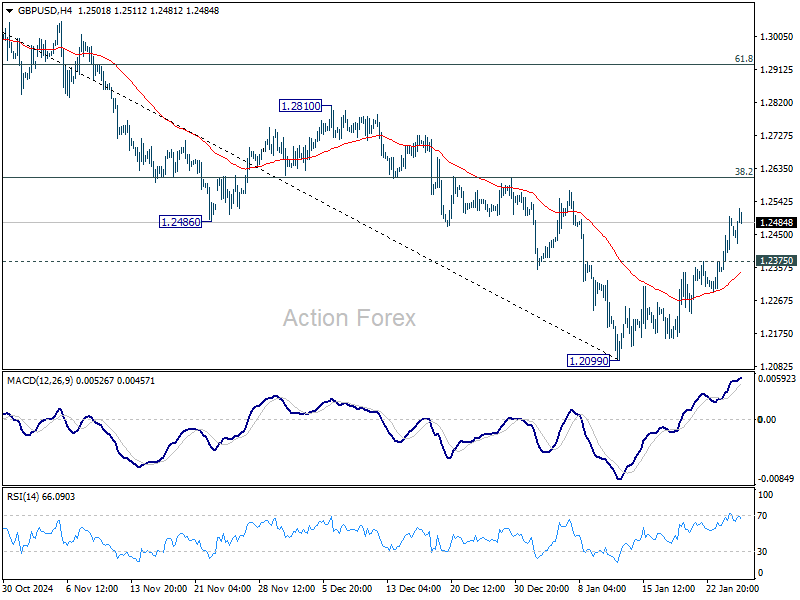
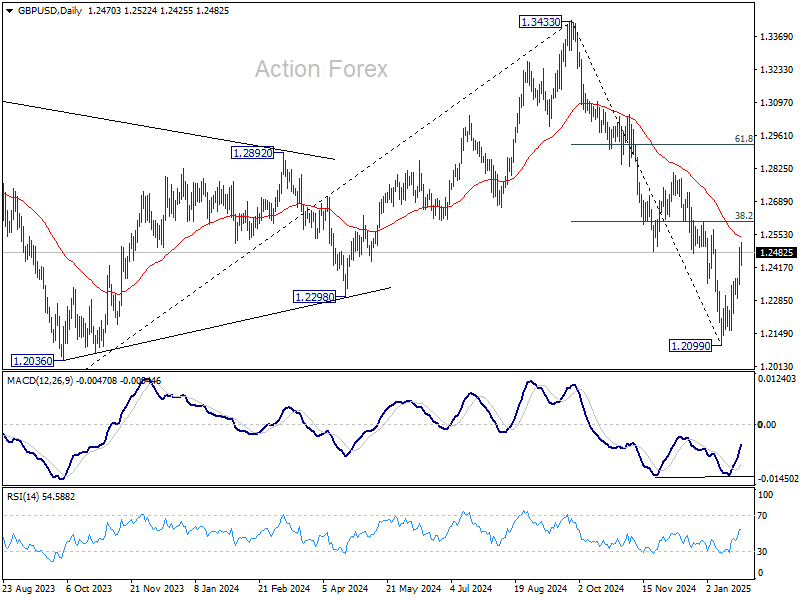
Intraday bias in GBP/USD remains on the upside as rebound from 1.2099 short term bottom is in progress. Strong resistance could be seen 38.2% retracement of 1.3433 to 1.2099 at 1.2609 to limit upside. On the downside, below 1.2375 minor support will turn intraday bias neutral first. However, sustained trading above 1.2609 will raise the chance of reversal and target 61.8% retracement at 1.2923.
In the bigger picture, rise from 1.0351 (2022 low) should have already completed at 1.3433 (2024 high), and the trend has reversed. Further fall is now expected as long as 1.2810 resistance holds. Deeper decline should be seen to 61.8% retracement of 1.0351 to 1.3433 at 1.1528, even as a corrective move. However, firm break of 1.2810 will dampen this bearish view and bring retest of 1.3433 high instead.
USD/JPY Mid-Day Outlook
Daily Pivots: (S1) 155.03; (P) 155.81; (R1) 156.77; More...
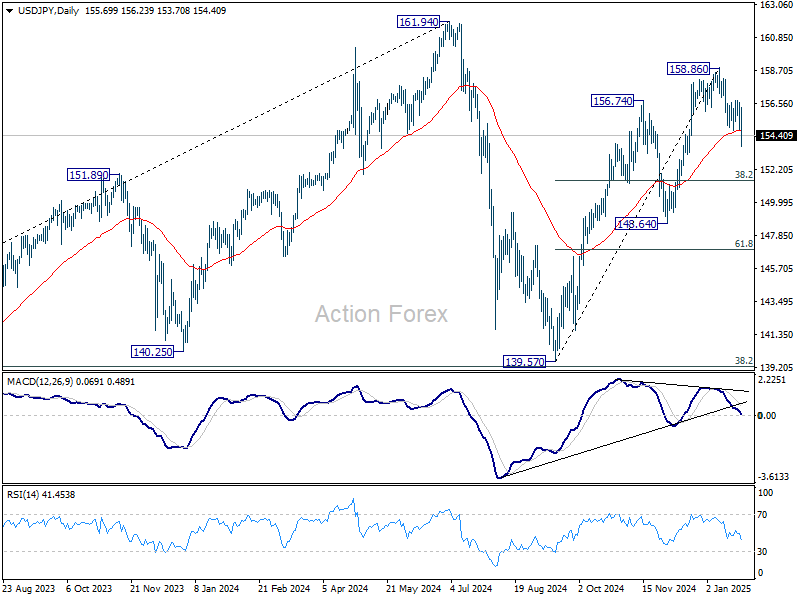
Intraday bias in USD/JPY stays on the downside this point. Fall from 154.77 is in progress for 38.2% retracement of 139.57 to 158.86 at 151.49. Sustained break there will suggest that whole rally from 138.57 has completed already. For now, risk will stay on the downside as long as 156.74 resistance holds, in case of recovery.
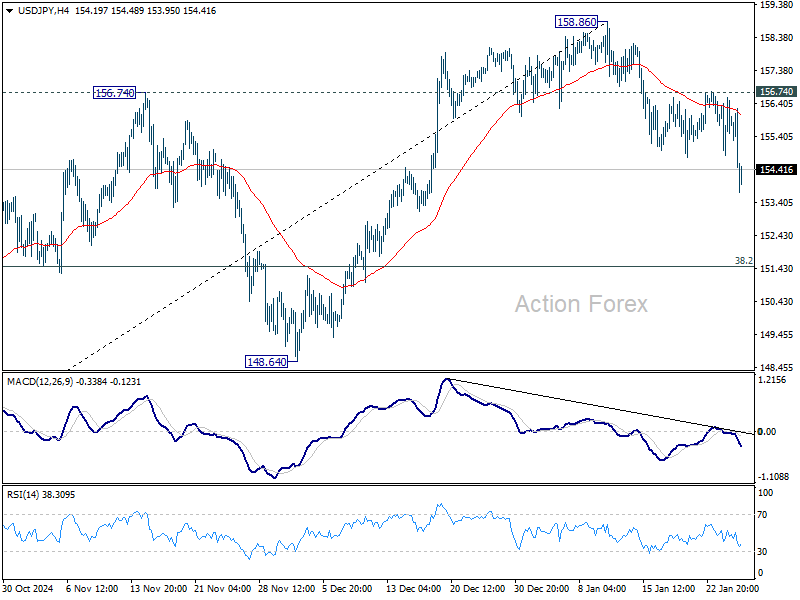
In the bigger picture, price actions from 161.94 are seen as a corrective pattern to rise from 102.58 (2021 low). The range of medium term consolidation should be set between 38.2% retracement of 102.58 to 161.94 at 139.26 and 161.94. Nevertheless, sustained break of 139.26 would open up deeper medium term decline to 61.8% retracement at 125.25.
Global Easing Expectations to Anchor Markets Despite Tech Sector Turmoil
Markets opened the week with a dramatic shift in risk sentiment as last week’s record-breaking highs in US equities gave way to sharp declines, driven by tech sector rout. Concerns over US dominance in artificial intelligence surfaced after Chinese startup DeepSeek unveiled a competing AI assistant, leading to fears of heightened competition. Nvidia saw its stock plummet over -12%, dragging NASDAQ down more than -3%. It should be emphasized that the long-term implications of this development remain unclear. Yet, some investors are treating it as an opportunity to take profits in the overheated tech sector, and wait for a sizeable correction, if any, to reenter the market.
Despite the tech selloff, it’s far too early to suggest that equity markets have peaked. The broader macroeconomic backdrop continues to support risk assets, with expectations for continued monetary easing from major global central banks still intact. In the US, President Donald Trump’s lack of action on tariffs, particularly toward allies, has helped contain inflation risks. These factors should help cushion market sentiment even as tech stocks experience turbulence.
Technically, DOW's retreat today is so far rather shallow. As long as 55 H EMA (now at 43907) holds, DOW's rally from 41884.98 should still be in progress. A serious test 45703.63 key near term resistance should at least be seen before any more sustained correction can be considered.
10-year yield's correction 4.809 resumed earlier than expected by gapping through last week's low of 4.552. But that's not so much a surprised and was inline with the outlook mentioned in our weekly report. Deeper correction looks more likely than not for now, but downside should still be contained by 38.2% retracement of 3.603 to 4.809 at 4.348. That's supported by expectations inflation in the US would remain sticky that keep Fed's easing much shallower than its global peers.
Overall in the currency markets, Yen and Swiss Franc are the strongest ones today, supported both by risk aversion in the stock markets and fall in US and European benchmark yields. Commodity currencies are all in red with Aussie being the worst, followed by Kiwi and then Loonie. Euro and Sterling are trading mixed in the middle with Dollar. The greenback is at a disadvantage with the deeper decline in US yields.
German Ifo rises to 85.1, slightly improvement but still pessimistic
German Ifo Business Climate ticked up from 84.7 to 85.1 in January. Current Situation Index also rose form 85.1 to 86.1. But Expectations Index fell from 84.4 to 84.2.
By sector, manufacturing fell from -24.9 to -25.3. Services rose from -5.6 to -2.2. Trade was unchanged at -29.5. Construction dropped notably from -26.2 to -28.2.
Ifo said that despite the slight improvement, "companies continue to be pessimistic".
China’s PMI manufacturing falls to 49.1, weak start to 2025
China's manufacturing activity slipped into contraction in January, with NBS Manufacturing PMI falling from 50.1 to 49.1, missing expectations of 50.1. This marks the first contraction since October and the lowest reading since August.
The decline was attributed to Lunar New Year holiday, as workers left early, according to NBS senior statistician Zhao Qinghe. Analysts also noted potential effects from slowing export demand after earlier front-loading tied to trade concerns.
The services sector showed similar weakness, with the Non-Manufacturing PMI dropping from 52.2 to 50.2, below the expected 52.0. Composite PMI, combining manufacturing and services, slipped to 50.1 from 52.2, reflecting a broad deceleration.
While some of this is likely seasonal, the magnitude of the slowdown raises concerns about underlying economic momentum, especially with external pressures like trade tensions still in play.
USD/JPY Mid-Day Outlook
Daily Pivots: (S1) 155.03; (P) 155.81; (R1) 156.77; More...
Intraday bias in USD/JPY stays on the downside this point. Fall from 154.77 is in progress for 38.2% retracement of 139.57 to 158.86 at 151.49. Sustained break there will suggest that whole rally from 138.57 has completed already. For now, risk will stay on the downside as long as 156.74 resistance holds, in case of recovery.
In the bigger picture, price actions from 161.94 are seen as a corrective pattern to rise from 102.58 (2021 low). The range of medium term consolidation should be set between 38.2% retracement of 102.58 to 161.94 at 139.26 and 161.94. Nevertheless, sustained break of 139.26 would open up deeper medium term decline to 61.8% retracement at 125.25.
AI Investors Rushed to Cash in on 2-Year Trade
Indices in the US and Europe declined due to the heavy selling of stocks triggered by investors exiting AI-related companies in the US. The reason for the relatively sudden sell-off was the rumoured high quality of AI model results from China’s DeepSeek-R1, unveiled on Monday. It is free for users, training was significantly cheaper than its US counterparts, and the results sometimes outperform ChatGPT.
In this environment, investors have started to exit the most popular trades of the past two years. Nvidia shares lost over 10% in the premarket, sending the Nasdaq-100 index down more than 5% from Friday’s closing level.
Markets are sensitive to this situation, as heightened price competition raises doubts about the timing of when profits from multi-billion-dollar investments will materialise. This is also putting pressure on Nvidia. Currently, it’s down 11% to levels below $127, testing the lower end of its trading range from October.
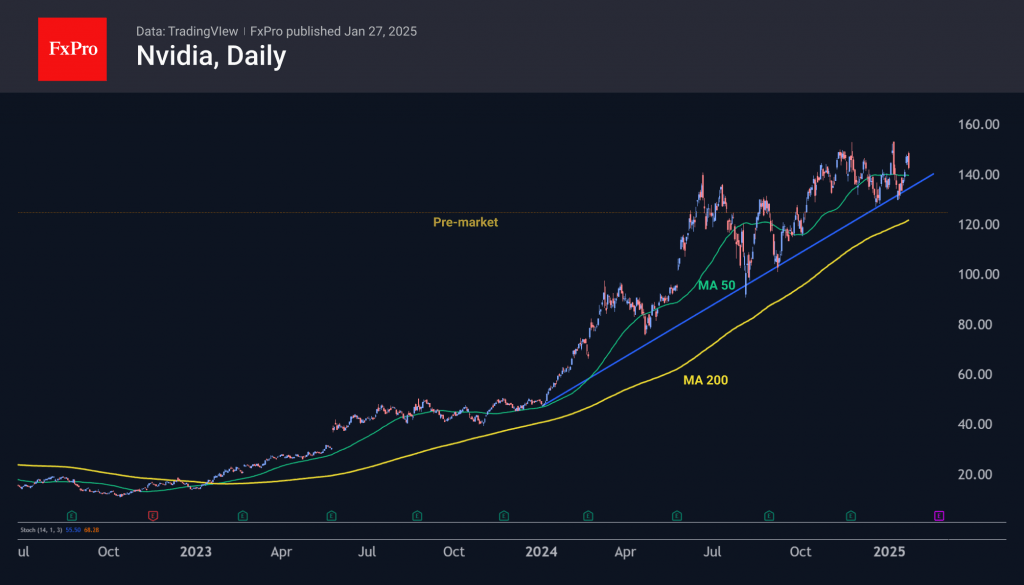
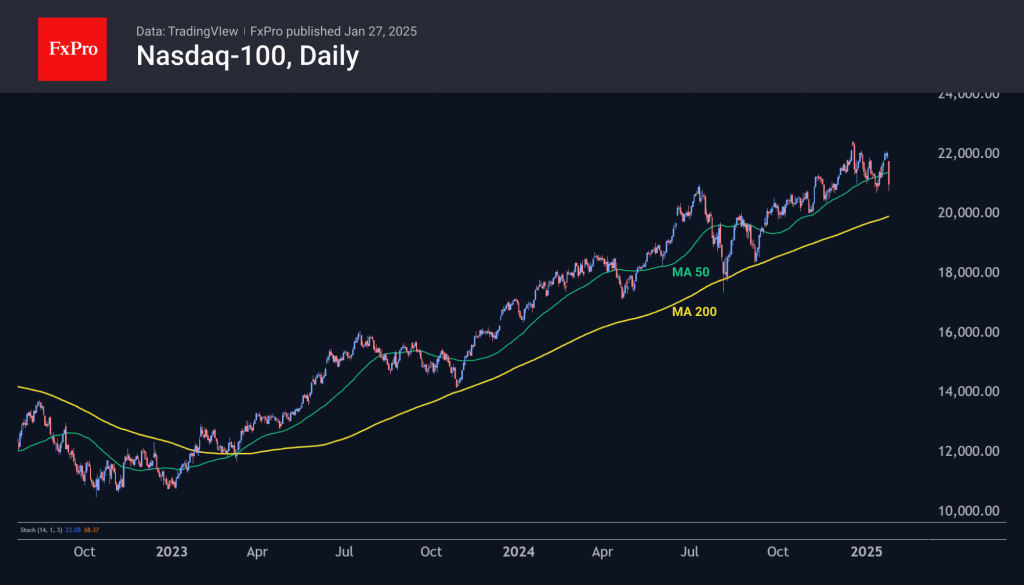
Technically, the latest decline breaks the upward trend of the entire 2024. The price is now approaching its 200-day moving average, above which it has traded solidly since early 2023. The situation looks like profit taking from the AI rally of the last two years, which is putting pressure on the market.
Nasdaq-100 index futures are trading below the 21000 level, back to the highs of last July. The fact that the market has reached these levels again after two weeks without updating the historical highs indicates increased seller activity. Under such conditions, the probability of the index dropping to a lower level is increasing.
The nearest target for sellers is the area of 20000. This is a significant level near which the 200-day moving average passes. Approaching this level attracted buyers in August and September last year, as well as in October 2023.
A fall below this level early in the week could trigger a further decline in share price, which could reduce market capitalisation by another 5-10%.
Yen Soars on Expectations of More BoJ Hikes
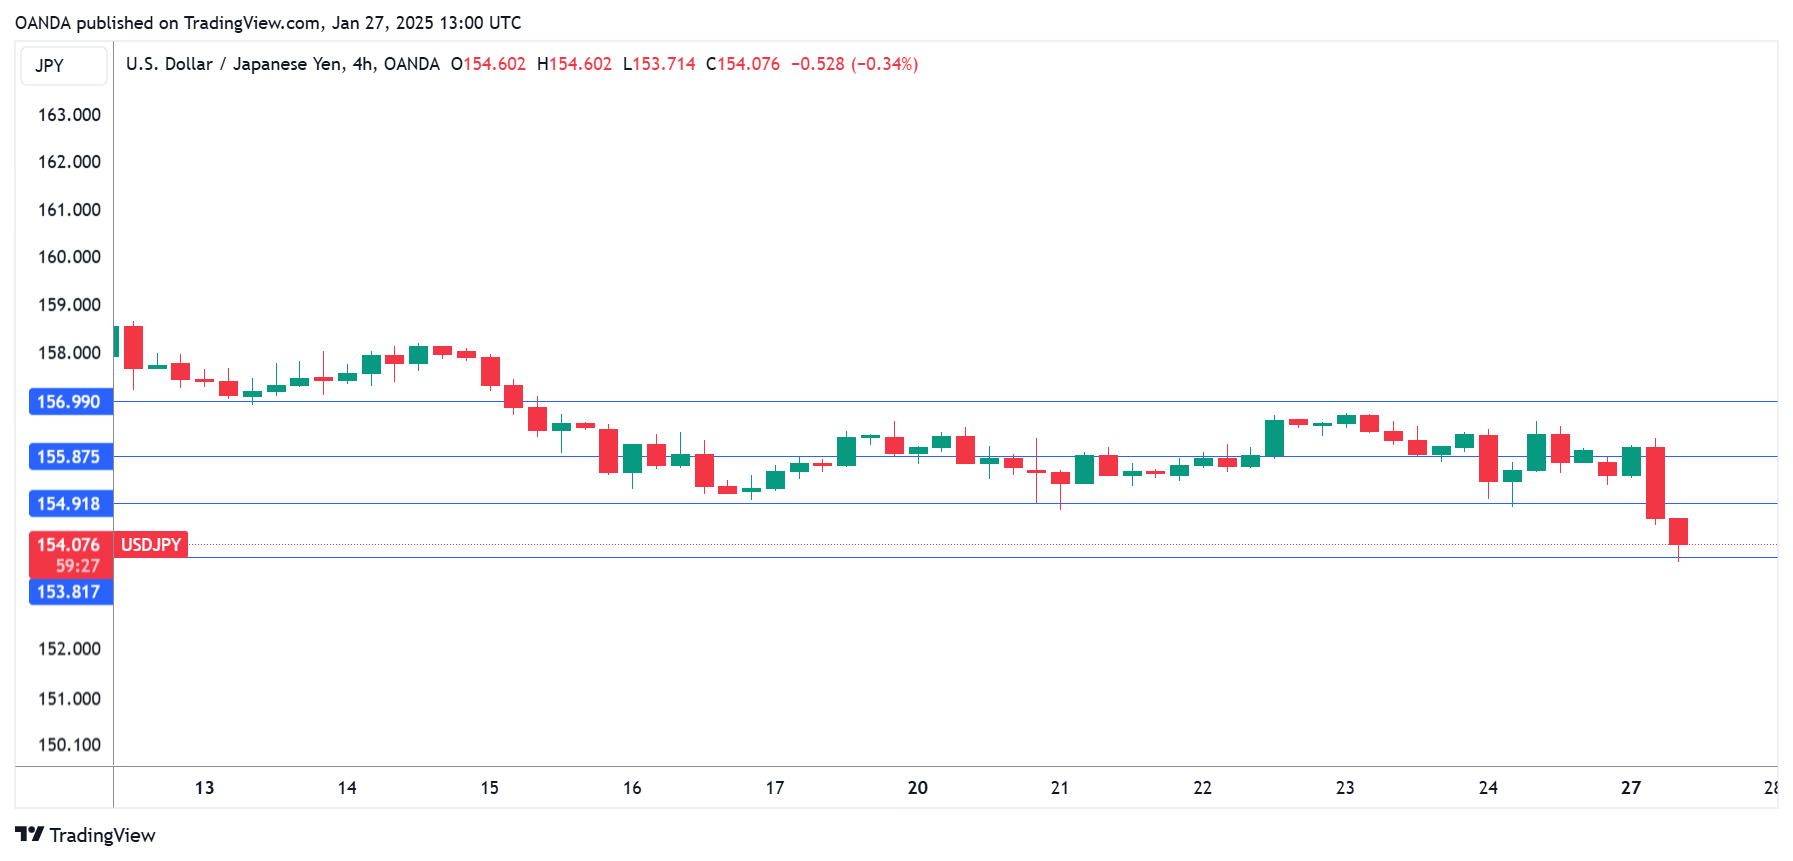
The Japanese yen has started the week with huge gains against the US dollar and has climbed to five-week highs. In the European session, USD/JPY is trading at 154.14, down 1.1% on the day.
Will BoJ continue its tightening cycle?
The Bank of Japan rate hike on Friday was expected by the markets but the Japanese yen continues to show strong movement in the aftermath of the rate decision. The yen initially recorded gains after the rate announcement but surrendered almost all of these gains on Friday. However, the yen has surged on Monday as investors are more confident that the BoJ will continue its move towards normalization and deliver additional rate hikes.
At a time when the major central banks are lowering interest rates, the BoJ is moving in the opposite direction. The move has been slow, as Friday’s hike was only the third since the tightening cycle began in March 2024. Governor Ueda said on Friday that “our basic thinking has not changed” but he also hinted at further interest rates, which has given the yen a sharp boost on Monday. Friday’s rate hike of 25 basis points brought the policy rate to 0.5%, its highest level since October 2008, during the global financial crisis.
What’s next for the BoJ? Governor Ueda didn’t provide any dates for a possible rate hike at his post-meeting press conference but noted that “there is still a considerable distance to the neutral rate”, a level that is not stimulative or restrictive to the economy. Ueda has repeatedly said that wage growth is needed to ensure that inflation remains sustainable and the rate statement expressed confidence that the annual spring labor talks would result in higher wages. If wages continue to rise, the BoJ could respond with another rate hike in May.
USD/JPY Technical
- USD/JPY has pushed below support at 154.90 and is testing support at 153.79
- 155.88 and 156.99 are the next resistance lines
Canadian Dollar Strengthens, But Its Outlook Hinges on Oil Prices and Trade Tariffs
The USD/CAD pair settled around 1.4393 after experiencing a volatile start to January. On Monday, the market showed interest in buying the Canadian dollar, which had earlier strengthened to a monthly high against the USD. This movement was driven by a weaker US dollar and a more favourable risk sentiment in global markets.
Factors influencing the Canadian dollar
The Loonie was boosted after US President Donald Trump called for an immediate interest rate cut by the Federal Reserve, which weighed on the USD. Additionally, enhanced risk appetite in the market supported currencies like the CAD.
However, the Canadian dollar’s ability to strengthen further is uncertain due to looming trade policy concerns. The potential of the US imposing 25% tariffs on Canadian imports in February 2025 has raised fears. This move could prompt the Bank of Canada to lower its interest rate by 25 basis points during its meeting.
Adding to the uncertainty is the continued decline in crude oil prices, a critical factor for the Canadian economy, given its reliance on commodities. The oil sector is particularly concerned about the potential impact of tariffs on Canada, Mexico, and China, as well as the broader implications for global energy demand and economic growth.
Technical analysis of USD/CAD
On the H4 chart, USD/CAD is in a broad consolidation range around the 1.4384 level. A short-term growth to 1.4455 is possible. After reaching this level, the pair may reverse and develop a downside wave targeting 1.4255. The MACD indicator supports this outlook, with its signal line positioned below the zero mark and signalling further potential for lower lows.
On the H1 chart, the pair completed a local decline wave to 1.4300 and then rebounded to 1.4377. The market is forming a consolidation range near 1.4377. If the pair breaks upwards, the range could extend to 1.4455. Conversely, a downward breakout would open the potential for a move towards 1.4255. This scenario is supported by the Stochastic oscillator, which shows its signal line below the 80 mark and trending sharply downwards towards 20, indicating bearish momentum.
Conclusion
The Canadian dollar’s recent gains reflect short-term factors such as a weaker USD and improved market risk sentiment. However, its outlook remains uncertain, with oil prices and potential US trade tariffs presenting significant risks. Technically, the USD/CAD pair is consolidating, with key levels to watch at 1.4455 on the upside and 1.4255 on the downside. Market participants will closely monitor developments in US trade policy and the Bank of Canada’s upcoming rate decision for further direction.
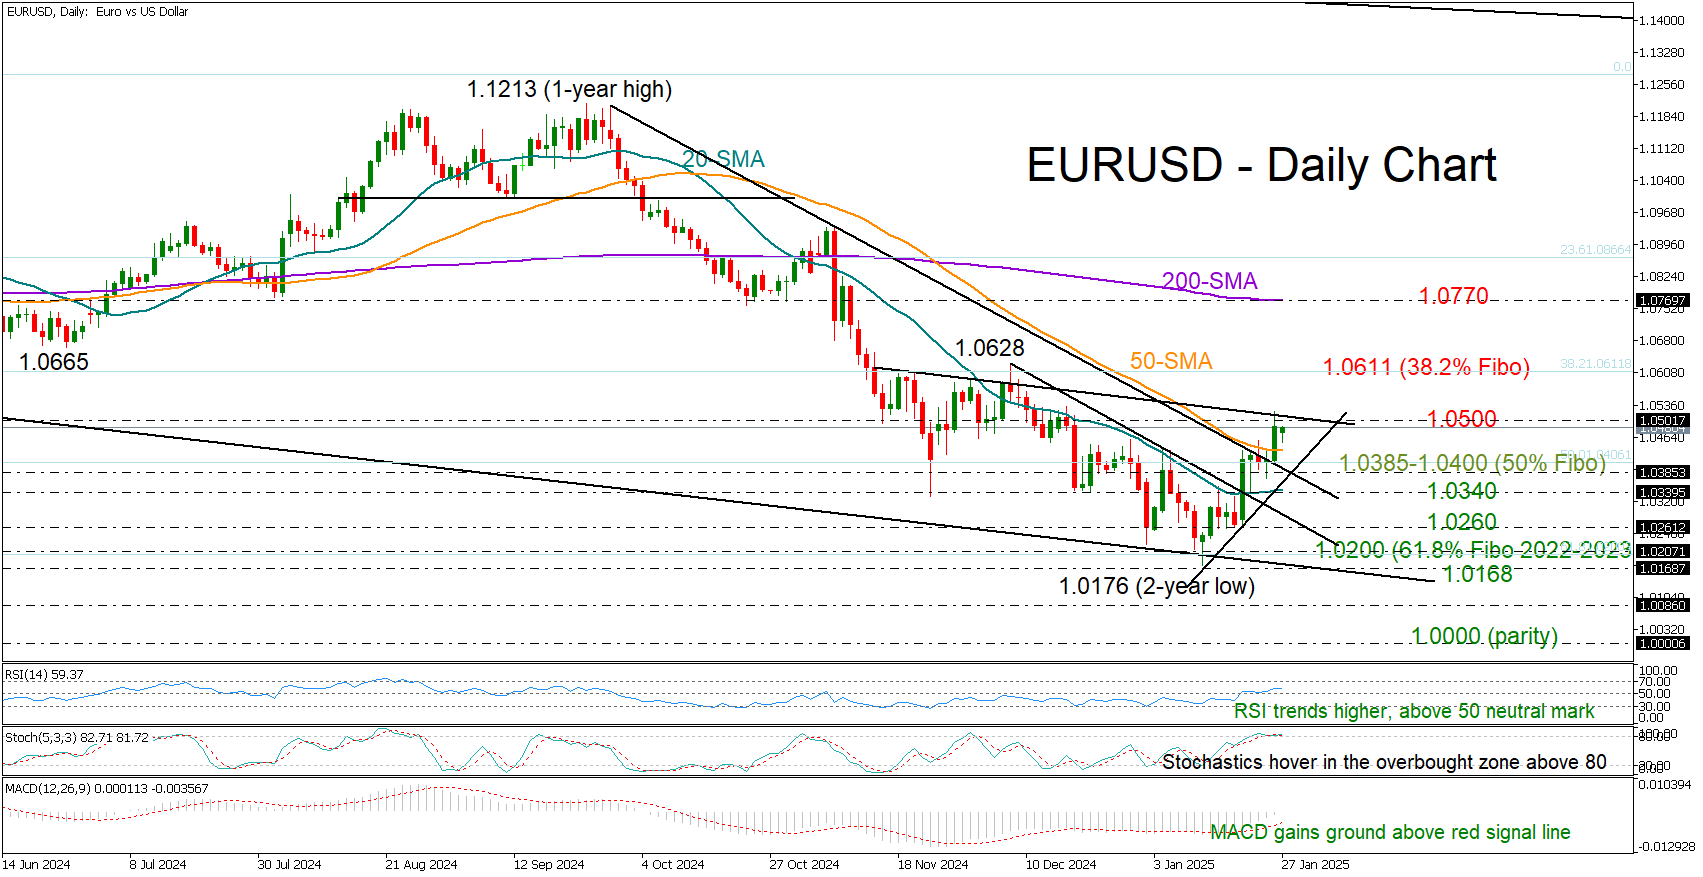
EUR/USD: Awaiting the Green Light Above 50-SMA
- EUR/USD sends bullish signals above 50-day SMA.
- A break above 1.0500 could bolster buying appetite.
- ECB rate decision due on Thursday, 13:15 GMT.
EUR/USD opened the week with a slight gap lower at 1.0473 after running as high as 1.0520 on Friday. The pullback, however, could be temporary.
While a sustainable move above the 1.0500 level might be necessary for a continuation higher, Friday’s close above the 50-day simple moving average (SMA)– the first since October – is feeding hopes that the bulls could roar back. If the pair decisively holds above this line, there is potential for an extension towards the 38.2% Fibonacci retracement of the 2022-2023 uptrend at 1.0611. Then, the focus could turn to the 200-day simple moving average (SMA) currently seen near 1.0770.
The positive trajectory in the RSI and the MACD adds weight to the bullish scenario, though with the stochastic oscillator hovering within overbought zone, downside pressures cannot be ruled out, especially if the price dives below the support area of 1.0385-1.0400. If the bears breach this floor, the 20-day SMA may immediately come to the rescue near 1.0340. Otherwise, the price could tumble toward the 61.8% Fibonacci of 1.0260, and even slide into the 1.0168-1.0200 area, where the support line from February 2024 is sitting.
In summary, EUR/USD is maintaining a bullish stance in the short-term picture despite today’s minor pullback. A close above 1.0500 could provide the confirmation needed for a march higher. However, traders should keep an eye on downside risks if a dip below 1.0384-1.0400 takes place.
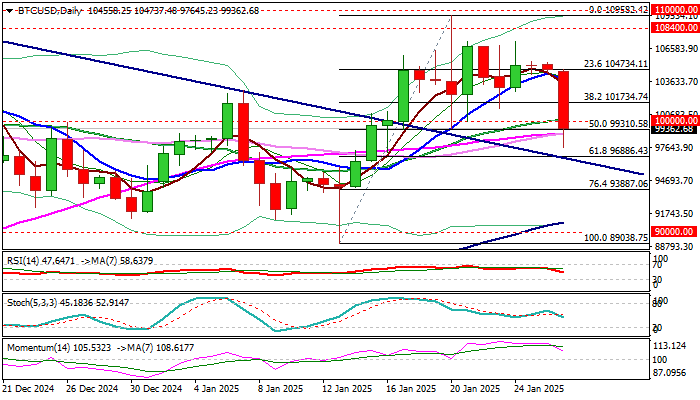
Bitcoin Collapses Below 100K
Bitcoin was sharply down and dipped below psychological 100K support in early Monday trading.
The price dropped around 6% in Asian session, in the biggest session drop in a weeks, mainly driven by risk-off selling.
Fresh drop weakened near-term structure, fueling risk of further losses, particularly if bears sustain break below 100K, although will face another significant supports which guard key 90K support zone.
On the other hand, larger picture shows that broader bulls remain in a consolidation phase and probably preparing for fresh push higher, as overall sentiment is positive, and traders await signals from Trump’s administration about promised overhaul and liberalizing of crypto market regulations in the US.
From this perspective, today’s drop looks like positioning for fresh rally, but price needs to hold above 90K breakpoint, to keep bullish stance.
It will be also interesting to watch January’s close, after Bitcoin repeatedly failed to register monthly close above 100K last month.
Another failure would signal prolonged sideways mode but also signal growing downside risk on formation of a double bull-trap above 100K on monthly chart.
Res: 100000; 101734; 102771; 104734
Sup: 97645; 96886; 93887; 91189