Sample Category Title
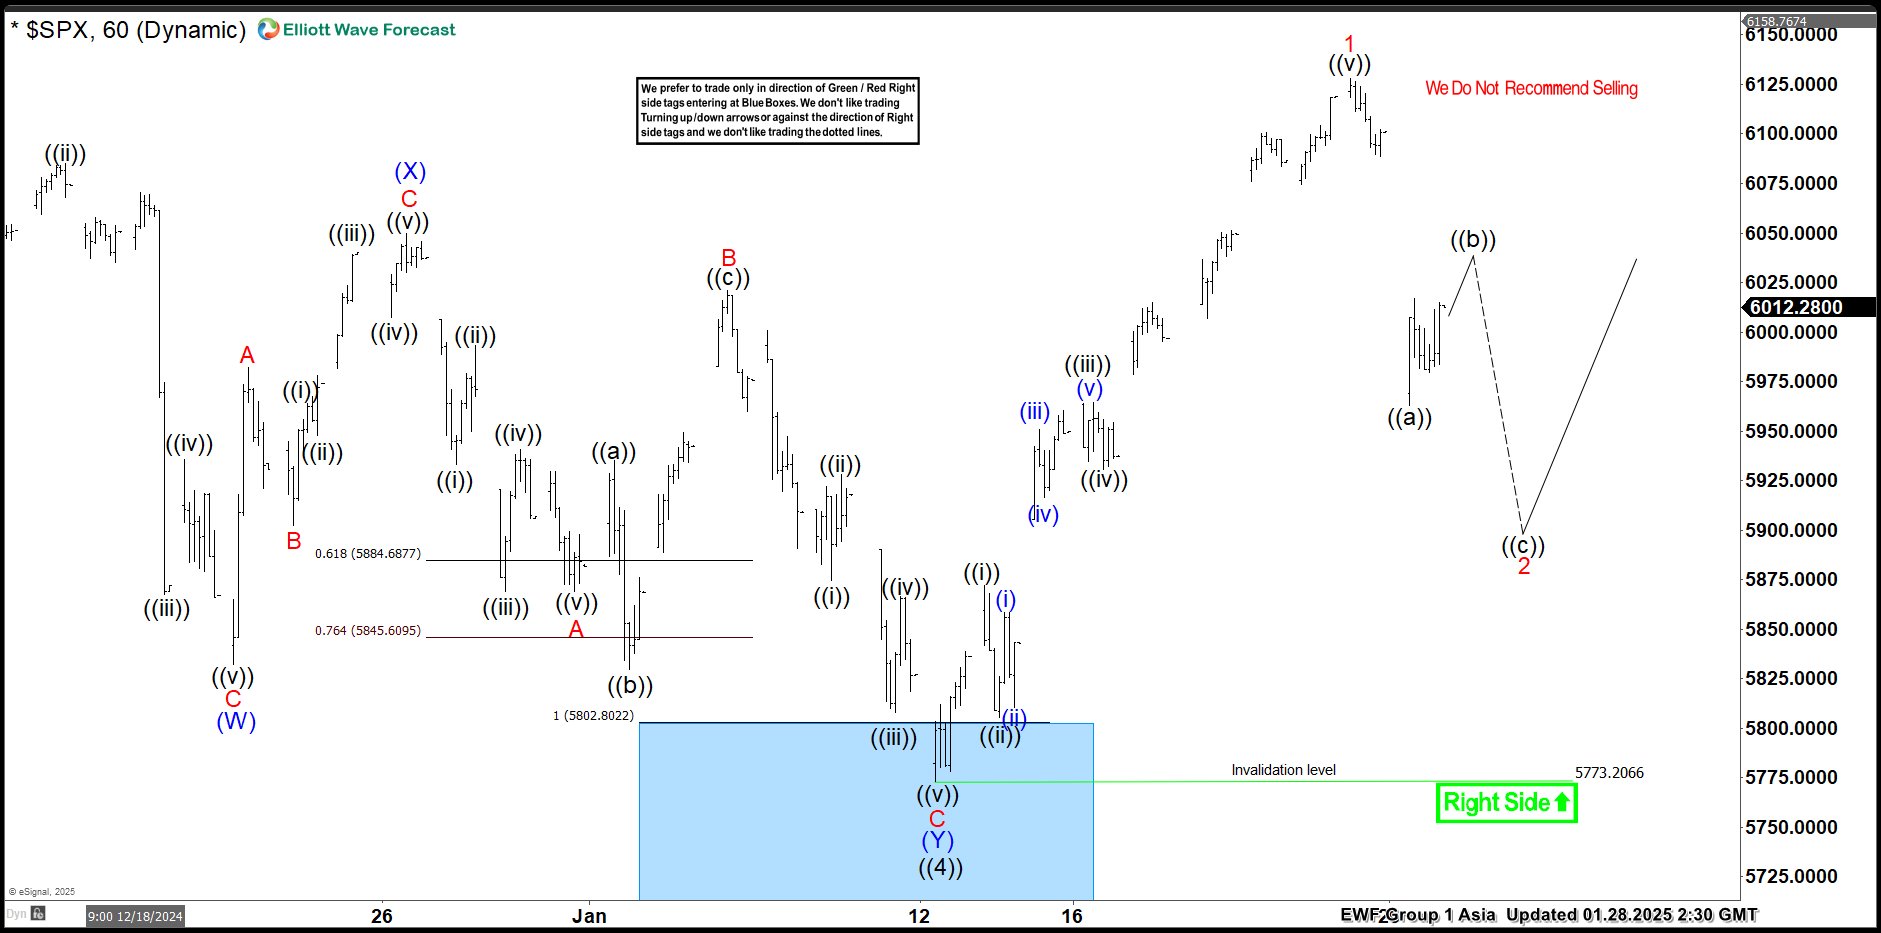
SPX Pullback Expected To Hold in 3, 7 Or 11 Swings
Short Term Elliott Wave view in S&P 500 ( SPX) suggests that rally to new all time high on 12.16.2024 at $6099.97 ended wave ((3)). Pullback in wave ((4)) is proposed complete at $5773.20 as the 1 hour chart below shows. Internal subdivision of wave ((4)) unfolded as Elliott wave double three structure. Down from wave ((3)), wave (W) ended in lesser degree 3 swings at $5832.30. Wave (X) bounce ended in 3 swings at $6049.75 high. Then wave (Y) lower ended at $5773.20 low with another lesser degree 3 swings thus completed wave ((4)) pullback.
The Index has turned higher in wave ((5)) and managed to make a new high above previous wave ((3)) high of $6099.97 confirming the next extension higher. Up from wave ((4)), the rally took place as an impulse sequence where wave ((i)) ended at $5871.92 high. Wave ((ii)) pullback ended at $5805.42 low. Index nested higher in wave ((iii)) & ended at $5964.69 high. Then wave ((iv)) pullback ended at $5930.72 low. Above from there, wave ((v)) ended with extension at $6128.18 high & completed wave 1. Down from there, the index is doing a pullback in wave 2 against 1.13.2025 low. Therefore, pullback should hold in 3, 7 or 11 swings looking for more upside.
SPX 1-Hour Elliott Wave Chart From 1.28.2025
SPX Elliott Wave Video
https://www.youtube.com/watch?v=Z3ighVqtFz4
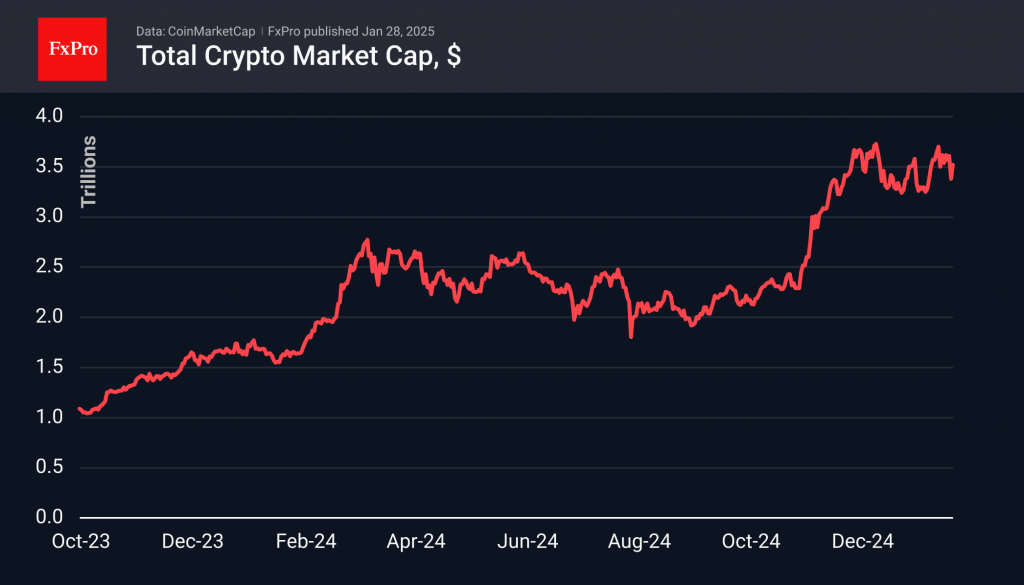
Crypto Market Withstood the Sell-off
Market Picture
On Monday, the cryptocurrency market partially recovered from the initial decline, regaining about 2/3 of the lost value. As a result, the cryptocurrency market capitalisation increased by 4.3% from the previous day and, by the start of trading in Europe, stands at $3.52 trillion. This is still below the level of the previous weeks when capitalisation hovered around $3.6 trillion.
The cryptocurrency market sentiment index rose to 72 over the past day, showing a steady appetite for risk assets despite the recent sell-off.
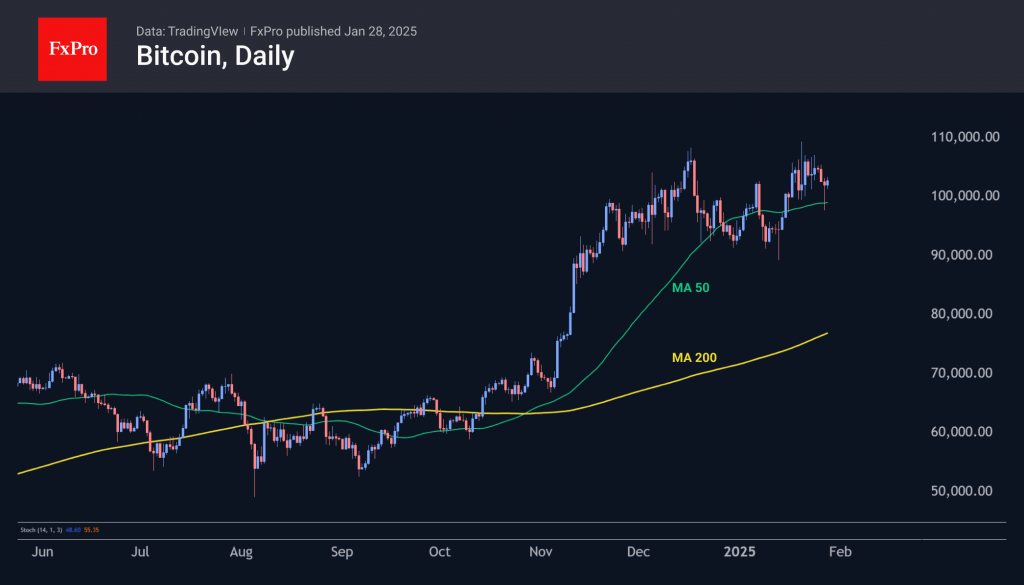
By the end of Monday, bitcoin had recovered from its fall and was back above the $101K mark. On Tuesday morning, its price approached $103K, crossing the 50-day moving average.
XRP, after losing more than 15% during Monday’s day, ended trading above the important $3 level. The price is currently at $3.09, showing a full recovery from the slump and a demonstration of strength that many other altcoins lack.

News Background
After another recalculation, bitcoin’s mining difficulty fell 2.12% to 108.11T, the first decline since September 2024.
According to CoinShares data, global crypto fund investments totalled $1.858bn last week, up from $2.195bn a week earlier. This positive trend continued for the third week in a row, intensifying in the last two weeks. Bitcoin investments were up $1.591bn, Ethereum up $205m, XRP up $19m and Solana up $7m.
CoinShares suggests that the rise in investment in digital assets can be attributed to President Trump’s executive orders to create a strategic reserve asset in Bitcoin. Among smaller digital assets, Solana, Chainlink, and Polkadot received the largest investment inflows.
According to CryptoQuant data, the share of investors with a balance of at least 1,000 BTC who purchased coins in the last 155 days increased from 43% to 60%, reflecting the emergence of large players amid optimistic sentiment.
Bitcoin Price Holds Above $100k. For Now?
In our previous analysis of the BTC/USD chart, we highlighted the increasing volatility in the cryptocurrency market leading up to Trump’s inauguration.
Today, the BTC/USD chart shows that the presidential inauguration triggered a peak in the ATR indicator, reflecting heightened market activity amid the launch of $TRUMP and $MELANIA memecoins. Crypto enthusiasts closely followed mentions of cryptocurrencies in Trump’s speech.
The last time the market was this volatile was in May 2022, when Bitcoin's price plummeted following news of the collapse of the TerraUSD (UST) stablecoin and its associated LUNA token.
What could this current spike in activity signify?
Such an active and broad market creates opportunities for significant capital to adjust portfolios—perhaps locking in profits from long positions and opening short positions.
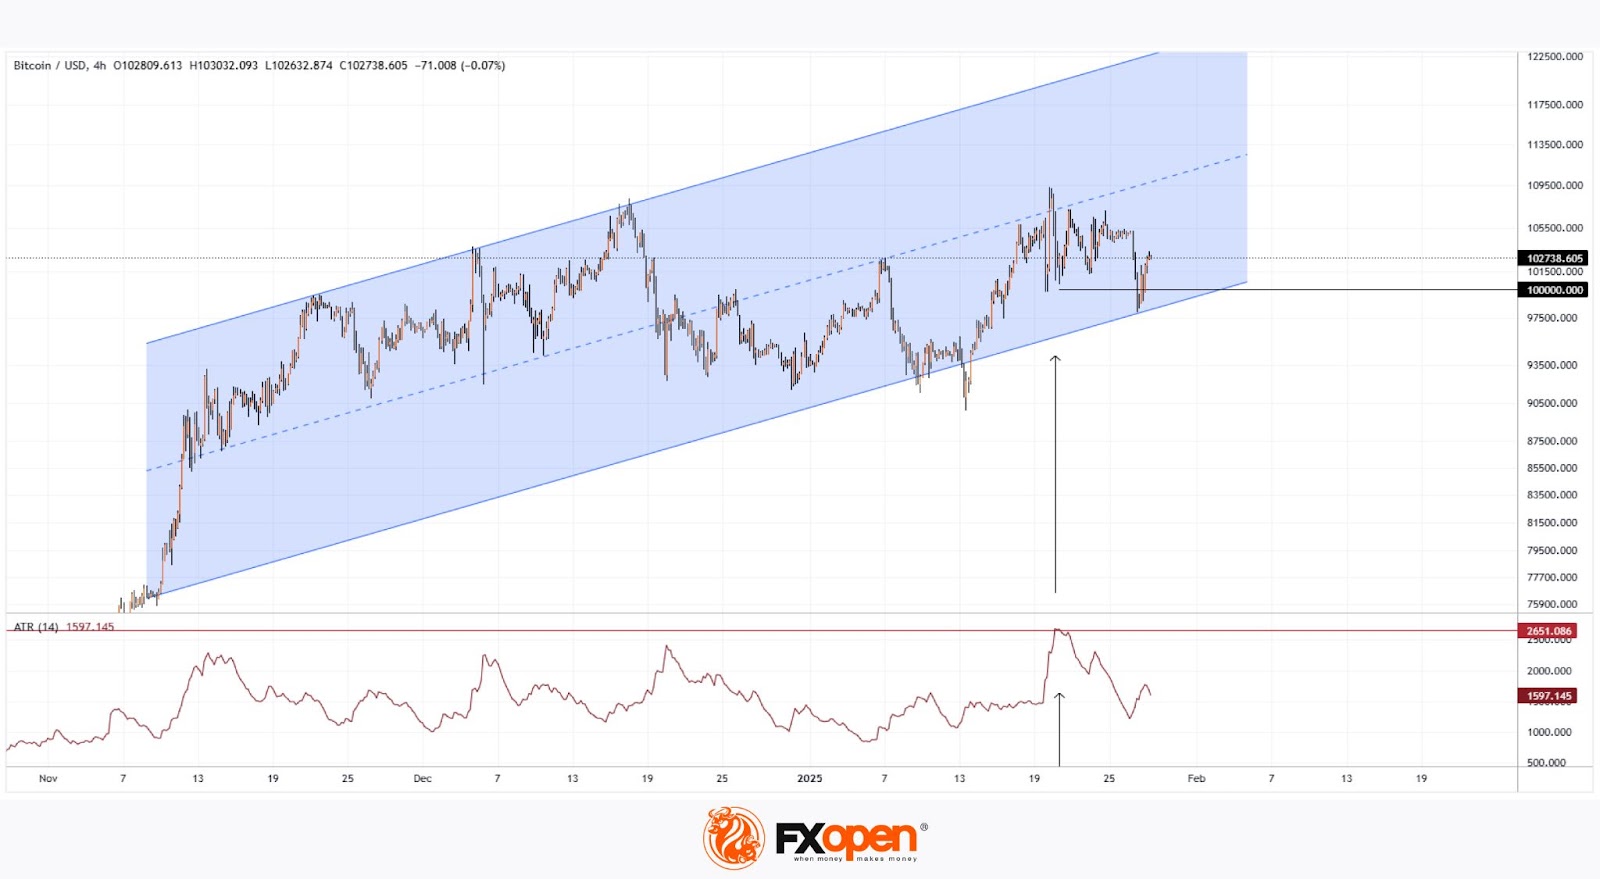
Technical analysis of the BTC/USD chart reveals that:
→ Bitcoin’s price movements since Trump’s victory in early November have established an upward trend, forming a channel (marked in blue on the chart).
→ As of today, the price has rebounded from the lower boundary of this channel, and the bearish break below the psychological $100k level proved to be false.
However, what if significant players have insights into upcoming events that could have a bearish impact on the Bitcoin market? If such events occur, they may drive the price below $100k and lead to an attempt to break the channel’s lower boundary.
FXOpen offers the world's most popular cryptocurrency CFDs*, including Bitcoin and Ethereum. Floating spreads, 1:2 leverage — at your service. Open your trading account now or learn more about crypto CFD trading with FXOpen.
*At FXOpen UK, Cryptocurrency CFDs are only available for trading by those clients categorised as Professional clients under FCA Rules. They are not available for trading by Retail clients.
This article represents the opinion of the Companies operating under the FXOpen brand only. It is not to be construed as an offer, solicitation, or recommendation with respect to products and services provided by the Companies operating under the FXOpen brand, nor is it to be considered financial advice.
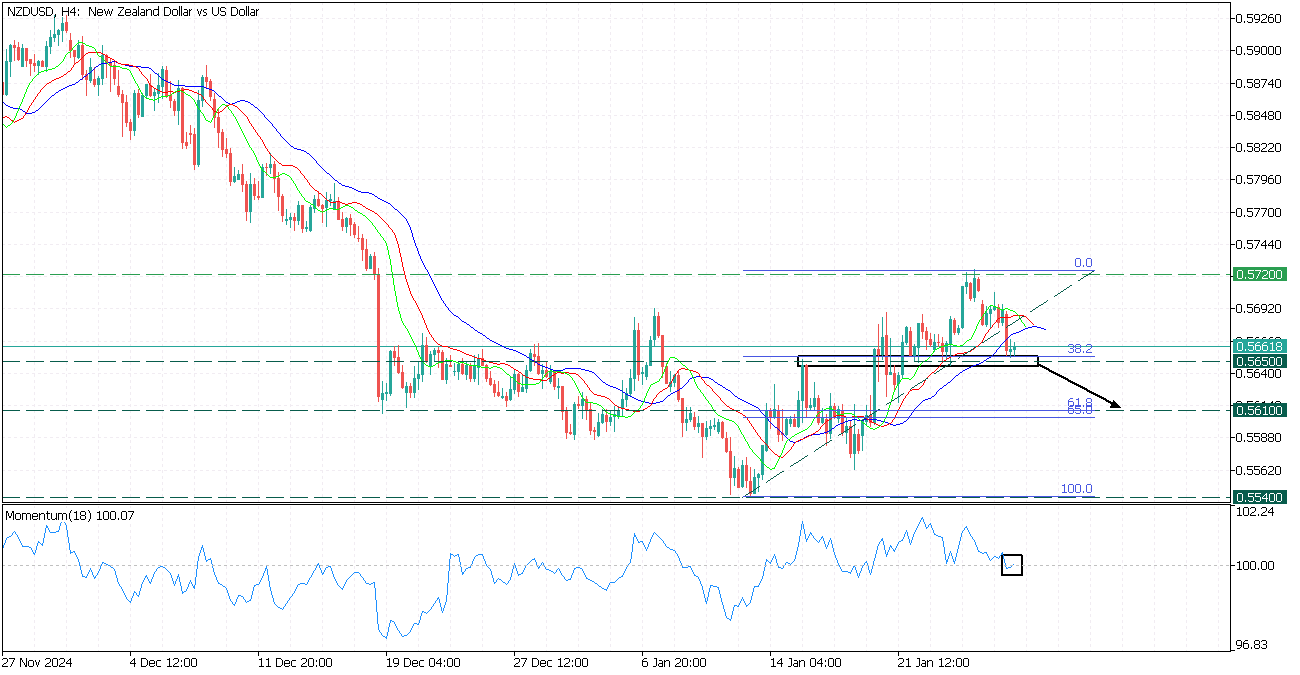
NZDUSD: Potential Downturn
NZDUSD, H4
NZDUSD corrected after a rebounding from the 0.5720 resistance and faced the 0.5650 support at the 38.2 Fibonacci ratio.
- The Alligator’s lips cross the jaw line, while the Momentum oscillator crosses the 100 lines downwards, giving a potential trend reversal sign.
- Consider a short trade if the price breaks below the 0.5650 support with the target at 0.5610.
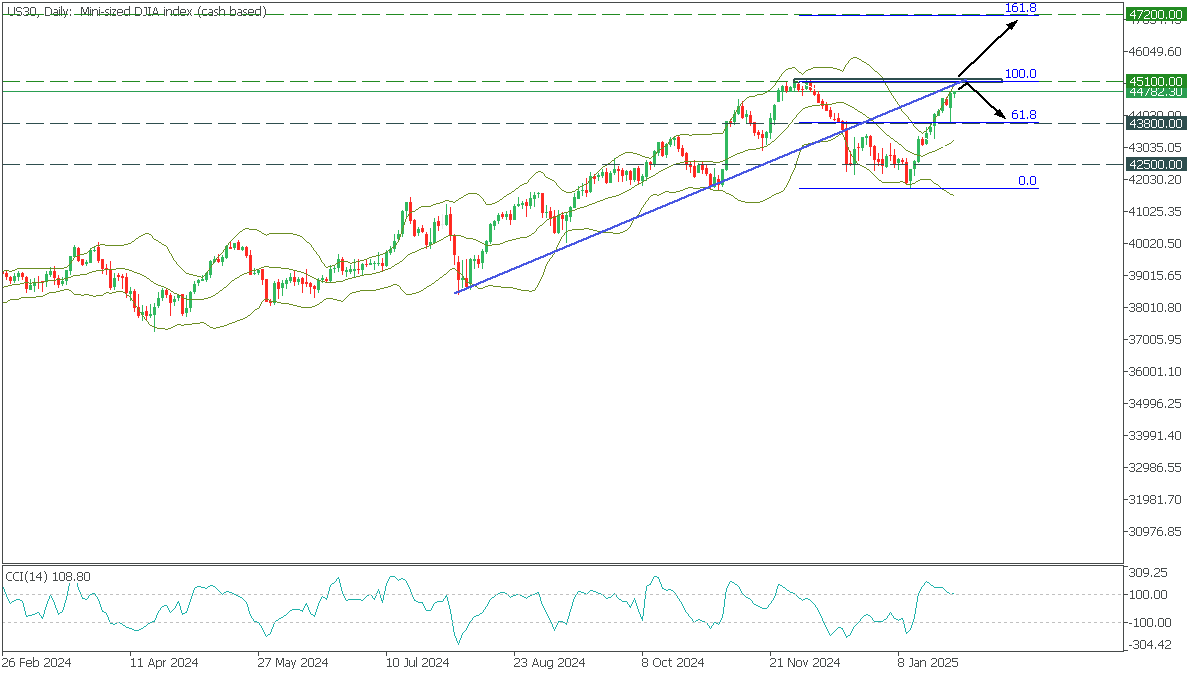
US30: Historic High Retest
US30, Daily
In the Daily timeframe, US30 rose again after a small correction and almost reached the ATH. The price is preparing to test the critical level and the broken global trend line. However, the CCI is ready to come out of overbought, and the price crossed the upper Bollinger line.
- A break of the trendline above 45100 will open the way for a rise to 47200, corresponding to 161.8 Fibonacci;
- A bounce off the trendline will take US30 back to 43800;
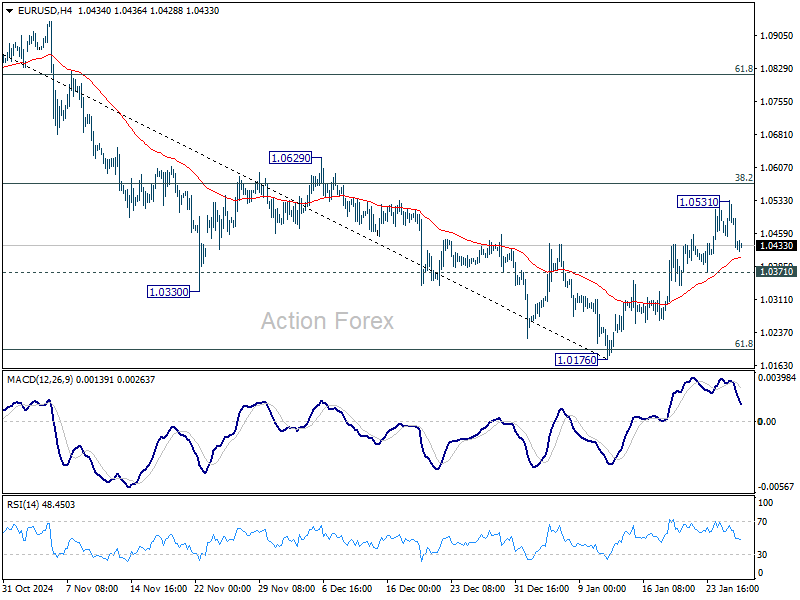
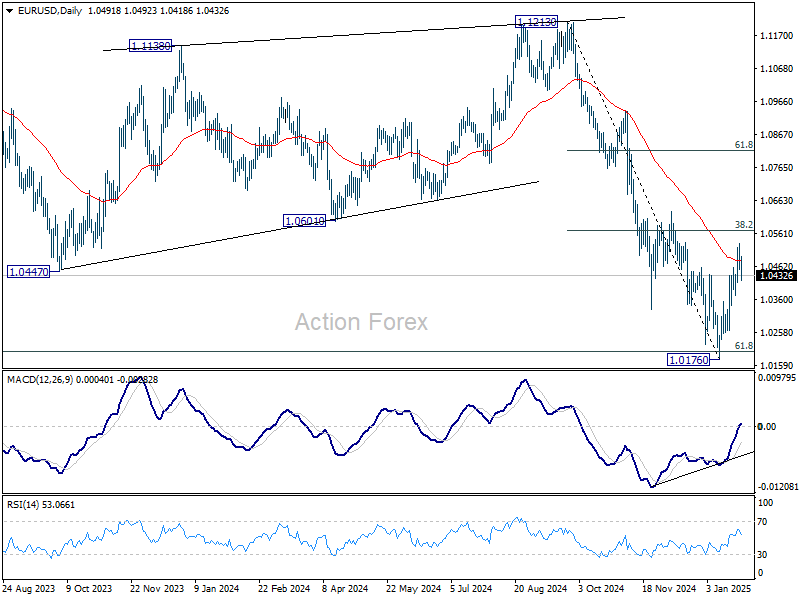
EUR/USD Daily Outlook
Daily Pivots: (S1) 1.0453; (P) 1.0493; (R1) 1.0532; More...
Intraday bias in EUR/USD is turned neutral with current retreat. On the downside, break of 1.0371 support will indicate rejection by 38.2% retracement of 1.1213 to 1.0176 at 1.0572 and retain near term bearishness. Retest of 1.0176 low should be seen next. On the upside, though, decisive break of 1.0572 will raise the chance of bullish reversal, and target 61.8% retracement at 1.0817.
In the bigger picture, outlook is mixed as fall from 1.1274 (2023 high) could either be the second leg of the corrective pattern from 0.9534 (2022 low), or another down leg of the long term down trend. Strong support from 61.8 retracement of 0.9534 to 1.1274 at 1.0199 will favor the former case, and sustained break of 55 W EMA (now at 1.0722) will argue that the third leg might have started. However, sustained trading below 1.0199 will favor the latter case and bring retest of 0.9534 low.
USD/JPY Daily Outlook
Daily Pivots: (S1) 153.40; (P) 154.82; (R1) 155.94; More...
USD/JPY recovered after dipping to 153.70 and intraday bias is turned neutral first. On the upside, break of 156.74 resistance will indicate that fall from 158.86 has completed as a correction. Intraday bias will be back on the upside for 158.86 and above to resume the whole rally from 138.57. On the downside, below 153.70 will resume the fall from 158.86 to 38.2% retracement of 139.57 to 158.86 at 151.49.
In the bigger picture, price actions from 161.94 are seen as a corrective pattern to rise from 102.58 (2021 low). The range of medium term consolidation should be set between 38.2% retracement of 102.58 to 161.94 at 139.26 and 161.94. Nevertheless, sustained break of 139.26 would open up deeper medium term decline to 61.8% retracement at 125.25.

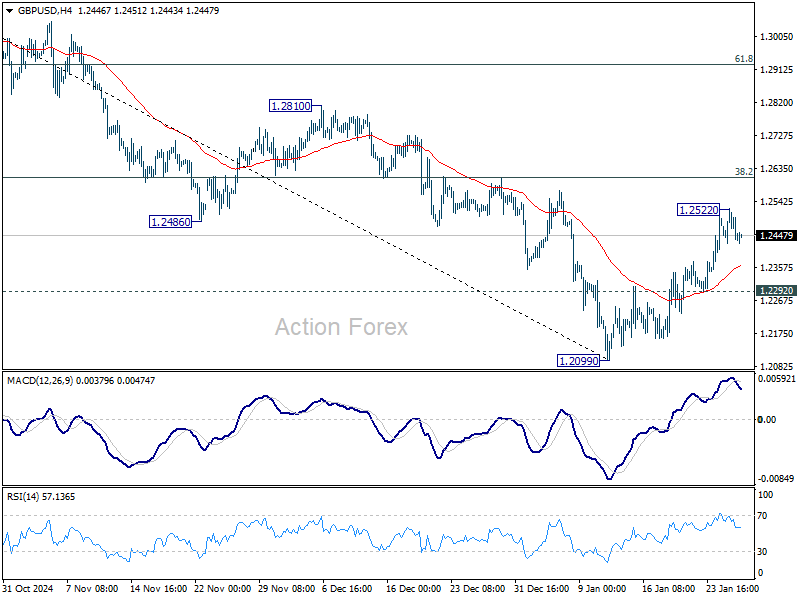
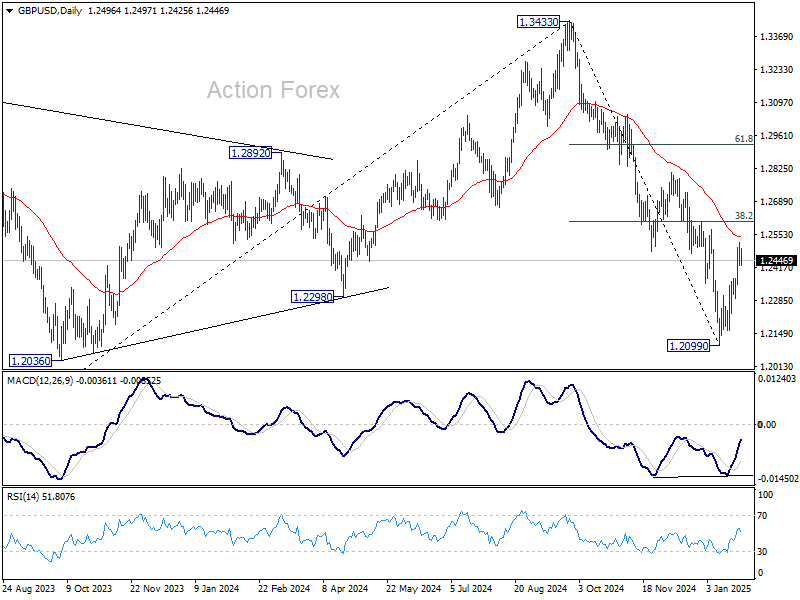
GBP/USD Daily Outlook
Daily Pivots: (S1) 1.2443; (P) 1.2483; (R1) 1.2540; More...
GBP/USD's rebound from 1.2099 lost momentum as seen in 4H MACD, and intraday bias is turned neutral. While another rise cannot be ruled out, strong resistance could be seen 38.2% retracement of 1.3433 to 1.2099 at 1.2609 to limit upside. On the downside, below 1.2292 minor support will bring retest of 1.2099 low. However, sustained trading above 1.2609 will raise the chance of reversal and target 61.8% retracement at 1.2923.

In the bigger picture, rise from 1.0351 (2022 low) should have already completed at 1.3433 (2024 high), and the trend has reversed. Further fall is now expected as long as 1.2810 resistance holds. Deeper decline should be seen to 61.8% retracement of 1.0351 to 1.3433 at 1.1528, even as a corrective move. However, firm break of 1.2810 will dampen this bearish view and bring retest of 1.3433 high instead.
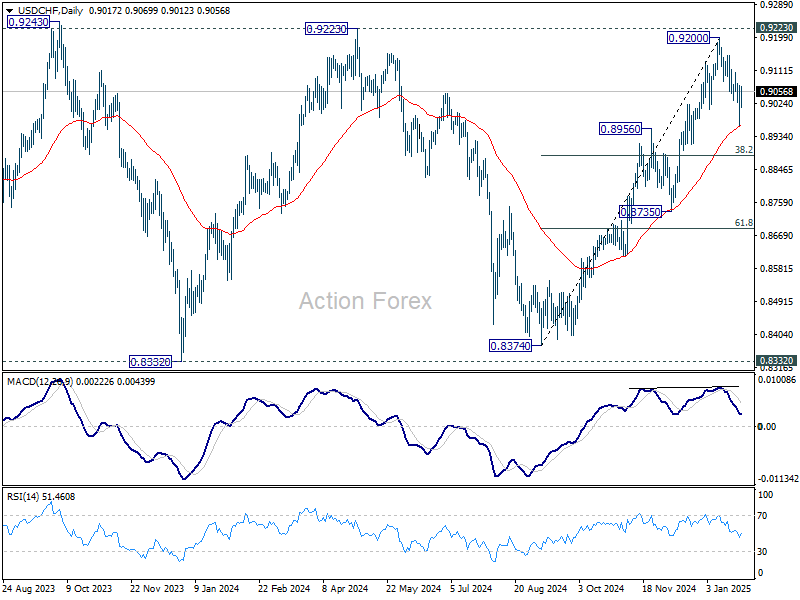
USD/CHF Daily Outlook
Daily Pivots: (S1) 0.8966; (P) 0.9019; (R1) 0.9074; More…
USD/CHF recovered after drawing support from near term rising channel and 55 D EMA. Intraday bias is turned neutral first. Rise from 0.8374 remains intact so far. On the upside, break of 0.9107 will target 0.9200 and 0.9223 key resistance. On the downside, break of 0.8964 will resume the fall from 0.9200 to 38.2% retracement of 0.8374 to 0.9200 at 0.8884 next.
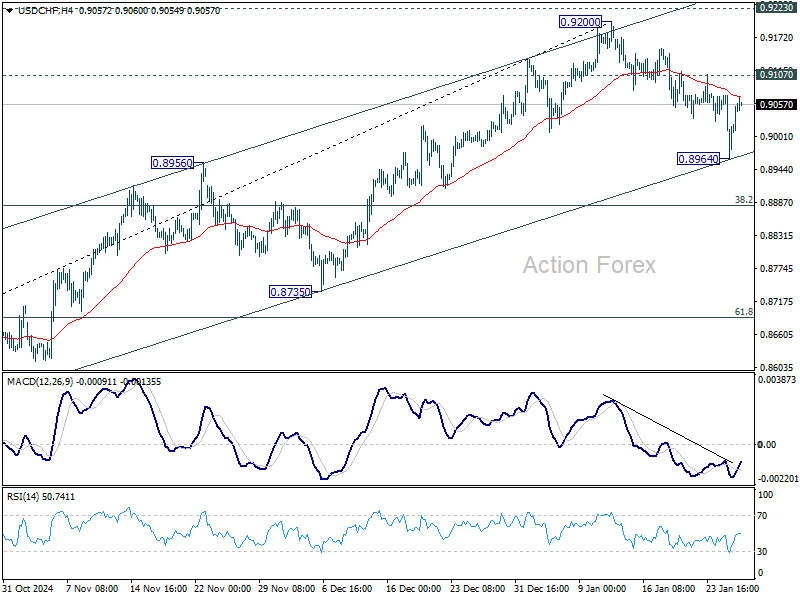
In the bigger picture, as long as 0.9223 resistance holds, price actions from 0.8332 (2023 low) are seen as a medium term corrective pattern. That is, long term down trend is in favor to resume through 0.8332 at a later stage. However, sustained break of 0.9223 will be an important sign of bullish trend reversal.
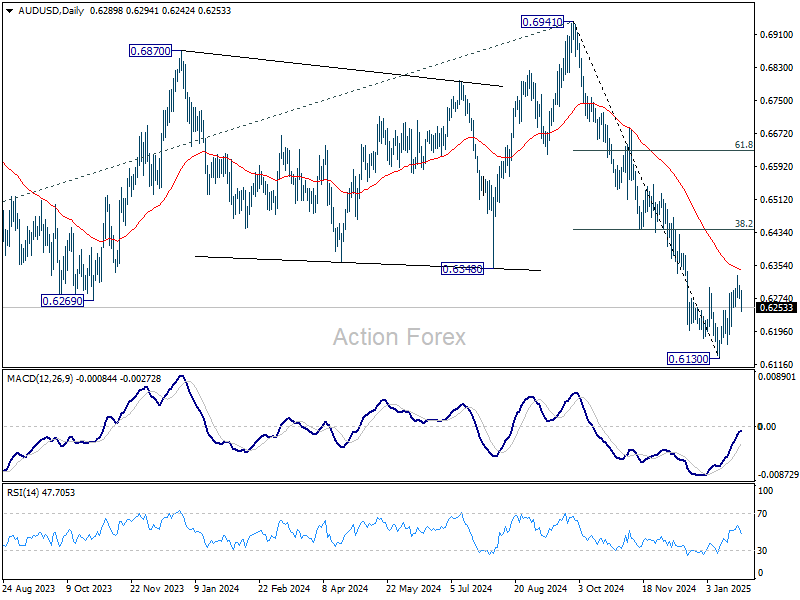
AUD/USD Daily Report
Daily Pivots: (S1) 0.6276; (P) 0.6292; (R1) 0.6309; More...
AUD/USD's breach of 0.6252 minor support argues that corrective rebound from 0.6130 has completed at 0.6329 already. Intraday bias is now mildly on the downside for retesting 0.6130 low. On the upside, above 0.6329 will resume the rebound. But still, strong resistance is expected from 38.2% retracement of 0.6941 to 0.6130 at 0.6440 to limit upside to complete this corrective rebound.
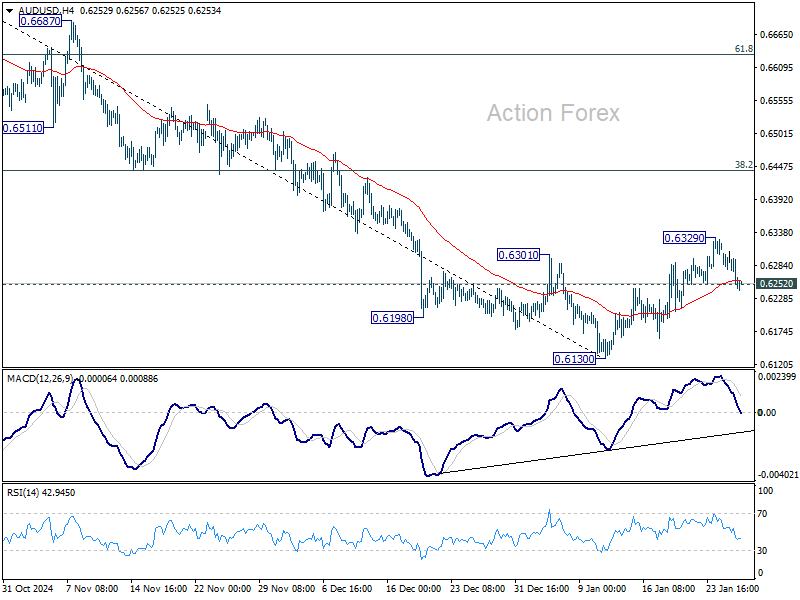
In the bigger picture, fall from 0.6941 (2024 high) is seen as part of the down trend from 0.8006 (2021 high). Next medium term target is 61.8% projection of 0.8006 to 0.6169 from 0.6941 at 0.5806. In any case, outlook will stay bearish as long as 55 W EMA (now at 0.6545) holds.