Sample Category Title
GOLD – Targets Further Weakness Towards Psycho Support At 1,300.00 Zone
GOLD - The commodity closed lower the past week to open the door for more weakness. On the downside, support comes in at the 1,310.00 level where a break will turn attention to the 1,300.00 level. Further down, a cut through here will open the door for a move lower towards the 1,290.00 level. Below here if seen could trigger further downside pressure targeting the 1,280.00 level. Conversely, resistance resides at the 1,330.00 level where a break will aim at the 1,340.00 level. A turn above there will expose the 1,350.00 level. Further out, resistance stands at the 1,360.00 level. All in all, GOLD looks to weaken further.
The Winds Of Change
FOMC Week
Very choppy trading to end the week as the US data dump provided little clarity for Fed watchers while traders are back positioning for an apparent central bank move towards global policy convergence.
The market is smelling the coffee and finally coming to grips that yields should be higher given that central banks are getting ready to drain the trough and some even on the verge of hiking interest rates.
The Winds of Change
The biggest shift is the Bank of England who will join the rate hike centeral bank fraternity which has turned global fixed income offered. Also, the market has completely ignored the latest NK missile test; it appears traders are viewing these events as little more than posturing and are poised to fade the overreactions. Finally, last weeks higher than expected US CPI gives the Feds the glimmer of inflation required to nudge rates higher. Even if the CPI bump is on the back of the dual hurricanes, price pressure in both housing and gasoline will likely drag on for months ahead.
Given these shifting sentiments, the markets may be erring on too dovish of a Federal Open Market Committee meeting this time around.
Taper Time
FOMC should begin with its much-telegraphed balance sheet reduction, and while not particularly noteworthy in itself; the market reaction to an announcement on the eventual size of the balance sheet is the great unknown. But ultimately draining the economy of cheap money can’t be viewed as a positive for markets accustomed to feeding off central bank largess. Why investors are so complacent is a mystery, but perhaps the reality check will set in midweek.
The market will enter the meeting with 50% probability of a rate hike priced for December, but ultimately investors will focus on the Fed’s inflation forecast and in particular if they have comprehensively overlooked the recent string of weak inflation prints.
FOMC View
Usually, the FOMC decision week is an easy read from a currency traders perspective as markets seldom stray from current midpoints and ranges. But this has been far from your typical pre-meeting build- up with North Korea tension on the simmer, BOE aggressively shifting policy to the hawks nest and US CPI inflation finally broke the previous string of five consecutive downside surprises.
The BoE hawkish comments have sent waves of policy convergence risk through the markets so traders will continue to estimate the relative pace of monetary policy normalisation in the G10. And while the BoE s policy shift likely dampened the dollar boost from US CPI, there is a chance the dollar does play some catch up this week. However, the Central Bank convergence narrative should remain flowing until after the FOMC meeting.And given the plethora uncertainties, we could see traders taking on minimal risk early in the week.
Euro
Difficult to make a meal out of the latest Euro movements. The 1.2000 level remains the seller’s zone while so far low 1.1900’s remain the preferred buy on dip region.So until the next ECB meeting, we could be mired in tight ranges with 1.1875 and 1.2025 providing the bookends
Japanese Yen
Fool me once, shame on you; fool me twice, shame on me. Traders have figured out the North Korea charade and are looking to buy the USDJPY dip on escalation. Also, last weeks perky US CPI data has some traders changing their conviction on December rate hike. As the market continues to focus on surging yields a push through 111.25-50 resistance would seem likely. If not for the FOMC uncertainly we’re likely only one strong US economic data print away from a push to 112.00
In what could be a risky move Japanese Prime Minister Shinzo Abe is considering calling a snap election as early as October. Keep in mind, we saw a similar move fail famously in the UK, so this does not come without considerable risk. However, one has to wonder about the timing given the NK escalation but none the less, there you have it.
As for the BoJ meeting this week, I’m not viewing any shift from the BoJ unconventional policy stance, but given much of the current policy committee members were elected by the Abe administration, there will be heightened focus on the election rhetoric
The Australian Dollar
The RBA is making every excuse it can to talk the Aussie down, and with other G-10 Central Banks moving towards policy convergence with the US and given the RBA looks happy to sit out the central bank taper, one would expect the AUD to struggle to hold onto its current posture over the medium term. On Tuesday, the Reserve Bank of Australia minutes are released which will be of interest to AUDUSD traders but given that much of the bigger Aussie movements have come on the back of external drivers, it’s difficult to imagine the minutes having too much of a punch ahead of the FOMC.
New Zealand Dollar
Friday, Kiwi traders will be sidelined awaiting the results of the following day’s election. The National Party and Labour Party are virtually tied in polls which is creating a bit of rollercoaster whipsawing back on forth on the polls as Labour victory means an RBNZ overhaul suggesting policy will be decided by a committee that would include external members, rather than the governor as lone decision maker.
Chinese Yuan
China economic data does not have the punch it used to have on the global markets, and this is likely a reflection of the more stable RMB.
The Pboc have worked their way into a happy place where policy mechanism can pass through USD movements in more balanced manner. Over the near term, stability will be the primary focus for administrators particularly over the Party Congress,
3 Steps to Building a Winning Mindset for Successful Trading
Statistics say that hardly 2% of traders actually make the cut. The remainders of the 98% are merely a flash in the pan. Some traders give up at the first taste of failure; others continue to spend money in hopes of finding the 'Holy Grail' of trading.
Others simply use a social trading or a PAMM account and hope that other's decisions will affect their equity to grow. Trading, be it stocks, forex or bonds is just like any other endeavor. Nothing happens overnight! You cannot expect to find a trading strategy and expect that you will get the same stellar results as the guy who posted it on a forum or a vendor selling you a system.
Hard work and perseveration are one of the essential aspects that will determine your success in trading. What keeps the best traders going is that hunger to understand how the markets work. Success in trading is in finding a system that suits you perhaps in a way a trading system is like an extension of yourself.
Struggling to make the cut? Probably more than money management or a trading system you should prime your mind.
Trading, as you might know, is a part-psychological game. It is after all the reflection of other humans/traders. When you trade, you are basically trading with or against this mass sentiment.
It can be easy to get discouraged with trading. A few string of losses (which are not that uncommon) can easily make a trader to doubt one's ability to trade successfully. Further to this, the fact that losing money is the result of such losses can easily make a trader to give up.
Here are three things that will help you to have a winning mindset and will help you to become just a little bit more successful.
1. Know what you are trading
So you want to trade EURUSD. That's great. But do you know what factors are behind moving the price in this currency pair? Using just technical indicators will not help you get far. And if you aim for consistency you need to take the time and learn and get intimate with the currency pair or the security that you want to trade.
Most often, traders only focus on a security or a currency pair because they think they can bank money easily. But sooner or later you will realize that this will only end up in burning a hole in your pocket. There are numerous resources available these days. Traders can easily take advantage of this and learn more about the fundamentals and the history of the currency pair that they are trading.
To illustrate this point, take the example of the EURCHF peg that was broken in 2015. While many traders were surprised, history showed that the SNB did this quite a few times before. Therefore, traders who spent time researching into the history of the currency pair were at an advantage while most others relied on technical indicators and the greed to make money quickly.
2. Make a commitment and stick to it
Traders who keep jumping from one strategy to another will often find themselves running in circles. They will end up either spending money on black box trading systems or paying a signals provider without actually making much money.
If you want to be successful in trading, then the first thing to do is to build your own trading system. The options are endless. What determines a good trading system from bad is how well you know it.
Some traders are quick to jump from one strategy to another at the first sign of taking losses. This way one doesn't really give themselves a chart to truly understand the dynamics of their trading system.
It is only through these losses that you can get to know the strength and weakness of your trading system.
3. Don't give up
If you think you can become rich trading forex within a year, then that is being very ambitious. While the timeframe may vary, traders should know that the only way they can make the markets work is by not giving up.
For some, it might take a year, for others, it can take more than three years. The bottom line that differentiates a winning trader from a losing trader is that they don't give up. The urge to excel at trading is what keeps some traders going until they make the 2% cut.
Forex trading is often glamorized, and most often the trader's psychology is preyed upon. Disguised as a way to trade and make money, most traders fall prey to this tactic.
However, being fully aware of what the currency markets are and how they work, and most importantly taking a serious step to learn and be good at trading is what will eventually decide whether you will be consistently profitable or here just to give your money away to the other 2% of successful traders.
Learn How to Become a Grade A Student of Forex Trading
Start off strong and ace your forex trading education. Through good forex education, traders can become successful no matter what strategies they apply. To do well in both execution and analysis, you must first learn how to become an efficient and knowledgeable trader. When initially focusing on education, traders can begin to understand the market and learn the best ways to profit from it. For long term success, master forex education to build a healthy and profitable trading career.
Ace forex trading education for optimal performance and mastery of skill.
What is the importance of forex education?
"From market analysis to trading techniques, good forex education sets the standards for strategy and performance. It is one of best ways to make use of the opportunities from the forex market." - The Importance of Good Forex Education
To start a successful career, you must begin your trading journey by focusing on education. Before worrying about risks and profits, traders should first build a good foundation. This can allow you to fully understand and apply any knowledge taken from the forex market. To ensure proper comprehension of forex trade, learn the importance of building good forex education before live trading:
- To secure a well-rounded foundation for forex trading
- To optimize decision making especially for vital activities
- To achieve the correct mindset needed for success
- To create an effective and reliable forex trading strategy
- To build a long lasting trading career with mastery of skill and performance
Qualities of a good learner
In the beginning of your trading education, you will need characteristics that will help you ace your forex trading education. This involves becoming a good learner. Having the qualities of a good student is a valuable aspect of achieving a well rounded trading mindset. Whether at the start or in the middle of your trading efforts, being a good learner improves the way you take in data and research.
To guarantee quality forex education, make sure to achieve these qualities and become a great learner:
- Resilience to experience different trading scenarios and know that any setbacks are part of the learning process.
- Diligence. According to Global Digital Citizen, good learners are willing to put time into gaining knowledge.
- Discipline to exercise mental focus and proper time management while learning.
- Perceptiveness to help interpret all information and develop the right strategy that works best for you.
- The right attitude towards the learning process means being positive while persevering.
The best ways to ace forex trading education
Every trader learns at their own pace. Because of this, there are many methods to gain quality forex education. To acquire the right knowledge, mindset and skills, each trader needs to trust the process of a forex trading education while ensuring optimal learning. For successful trades, learn the top ways to build a good foundation and ace forex trading education:
Optimize your learning skills
In forex trading, the ability to learn is essential to develop valuable skills and absorb incoming information. Learning is a lifelong skill that provides many advantages for mental health and character development. These are derived from the capability to take in new ideas and apply them as needed. Without good learning skills, traders will not be able to immediately process forex education and information.
To optimize your learning skills, here are the best tips to remember to help you ace forex education:
- Practice a growth mindset. When your mindset views every experience as a learning opportunity, your learning skills effectively optimize.
- A good way to learn is to sharpen your memory. This will eventually influence brain power and concentration skills while keeping in mind everything you've learned.
- Learning skills can be optimized with the right environment. Be sure to create the correct learning atmosphere and attain the best mental condition before starting your forex trading education.
Focus!
Focus is plays a big role in acing your forex education. It ensures that your time and efforts are directed towards vital knowledge and capabilities. Most forex traders already have innate skills that can be advantageous in a forex trading career. Whether it is good analytical or organizational skills, it is important to establish your strengths and focus from there. By concentrating on progress, you may also determine new skills for further development.
In this day and age, distractions are frequent. When learning about forex trading, focus is key to efficiently learn and master the forex market. While studying forex trade, make it a habit to focus and avoid multi-tasking.
Before putting all efforts towards profit, first focus on achieving a solid forex education.
Choose the right type of education
With access to many educational tools and channels, make sure you choose the right type of education that works for you. According to 9 Tips for Getting Through Forex Education, there are many ways to attain practical and theoretical knowledge in forex trading. The most important thing to remember is to ensure that you are getting favorable results from the kind of education you are investing in. Here are the different types of forex education you can try:
- Mentorship from a reputable trader or group in the area or online
- Educational online courses about trading or in relation to trading
- Trading webinars or seminars
- Books or ebooks about trading or financial analysis
- Educational websites that offer helpful blogs or tips
Remain organized
Because of the endless possibilities in the forex market, most traders would like to trade as soon as possible. To ace forex education, you must be highly organized with both studies and practice. To increase efficiency, be sure to learn these management tools:
- Time saving strategies to develop a more efficient trading routine to balance time for personal life.
- Task management to schedule and prioritize vital tasks
- Being a common trading concern, apply stress management to ensure practical ways to approach any anxiety.
- Energy management to ensure you have the right amount of energy to achieve your target output.
Being organized can be carried out for your forex trading career. Since there is plenty of data coming in, the time and effort for all trading activities should be properly planned. By becoming a highly organized trader, every experience is beneficial to the trading journey.
Determine your learning style
Before starting your forex education, make sure to establish the learning style you should pursue. Like forex trading strategies, a trader's learning style is different from the other. Because of this, it is advantageous to determine the learning style that best suits you. Doing this will guide and influence traders towards the type of learning that is most effective.
Learn Dash shares these 7 Major Learning Styles:
- Visual - Do you respond better to diagrams compared to written explanations?
- Physical - Are you able to learn faster by practicing on a demo account?
- Aural - Are you able to better understand trading concepts through trading videos?
- Verbal - Do you feel that you learn more from direct mentorship?
- Logical - Can you better understand the forex market through technical analysis?
- Social - Do you respond better by talking and learning with groups?
- Solitary - Do you find yourself learning more efficiently through self-study?
Continue your forex education
Continuing forex education is the best way to persevere and succeed in the forex market. Forex education is not only about initial studies, research and practice. It is about constantly exposing yourself to new ideas and different trading scenarios while learning from each one. The learning skills derived from every experience will allow you to build a stronger forex trading character and eventually, profitable trades.
Proper forex trading education is necessary for constant growth and success. The best way to ace forex education is to start by evaluating your personal capabilities and optimizing from there. Since it is an individual process, it is important to face any endeavor at your own pace. No matter what your goals are, include forex education in your trading strategy for a successful career.
For continuous growth, remain a diligent and an open-minded student of forex trade.
Why is Personal Accountability Needed in a Trading Career?
Personal accountability is a valuable trait to have in a forex trading journey. It encourages traders to focus on experiential learning and quality performance to reach target goals. No matter what the market movement is, an accountable trader will take charge of how trades are achieved. Instead of placing blame on things like the forex market or economies, a trader with personal accountability will immediately accept every outcome and efficiently learn from it. This creates a more fruitful trading experience and improves overall mental health. To gain a more proactive and positive way of thinking, apply personal accountability for a better mindset and more enjoyable trades.
What is personal accountability?
Do you believe that you control the success of your forex trading career? Long term success is achieved through determination as well as self-accountability. Personal accountability means taking responsibility for both actions and outcome in any trading scenario. It is an act of showing readiness to accept the circumstance, evaluate what went wrong and improve from there. According to Habits for Wellbeing, personal accountability is a habitual commitment achieved by taking ownership and action. When you hold yourself accountable, output, efficiency and performance greatly improve.
Use personal accountability to optimize decision making as well as trading results.
Importance of self-accountability when forex trading
Being accountable is an influential characteristic for good work ethic. Like in any career, target goals can be achieved when you take responsibility for all your efforts. In forex trading, it is easy to quickly blame market movement for unforeseen mishaps. Whether you end up with a winning or losing trade, it is important to know that you are in control of all your trading output.
Self-accountability in a forex trading career is a beneficial characteristic when facing different types of trading scenarios. The idea of being accountable for all actions can mould any new trader into an effective and growth-oriented expert. Get to know the important benefits of personal accountability:
- Avoids unnecessary reactions like procrastination or blame
- Promotes a proactive way of thinking
- Encourages solid work ethic
- Reduces trading anxiety or distress
- Boosts management skills for completing tasks
- Inspires traders to stay consistent with efficiency and diligence
- Enables you to move on from trading losses
The power behind taking responsibility for your actions lies in putting an end to negative thought patterns. You no longer dwell on what went wrong or focus on whom you are going to blame. You don't waste time building roadblocks to your success. Instead, you are set free and can now focus on succeeding. – Lorii Myers, Entrepreneur / Award Winning Author / Adventurer / Sports Enthusiast / Relentless Self-promoter
Action plan for personal accountability
Successful forex traders are responsible for accomplishing vital tasks. After these tasks are completed, they are also accountable for every outcome. Whether these results are favorable or not, an accountable trader will always accept the scenario and find ways to optimize. By taking accountability of your actions, problem solving and positive thinking can easily be attained. To become a profitable trader, be sure to accept the results of every decision and learn from it. Here are great ways to achieve personal accountability when forex trading:
Start with the right mindset
In every trade, it is beneficial to have a mindset that is responsible of all outcome. Before building an action plan for personal accountability, you must first start with the right way of thinking. When you achieve the right mindset, you can efficiently follow through with the skills needed for self-accountability and success. If traders habitually blame the forex market, this negative mindset may lead to undesirable results. Here are top tips to acquire the right mindset for personal accountability:
- Find your mantra. Use your target goal and an inspiring thought to help you during challenges. Once you put value to why you have to succeed in trading, following through with personal accountability will be effortless.
- Expose yourself to positive traders or successful individuals who can inspire you with a sense of self-empowerment. Learn how to achieve success as 7 Experts Share Their Secrets To Achieve a Positive Mindset.
- Read the right blogs or books to get the right mindset while you are away from your trades. If you continuously expose your mind to positive thoughts, your mindset can greatly improve for trading and for your personal life.
In a changeable market, traders can easily place all the blame on sudden movement. Because of this, you have to be in control of your reactions and thought process. Whether these are vital activities or day-to-day tasks, having an accountable mindset can boost positivity and proactive planning. For efficient and enjoyable trading career, try these Best Mindsets for Optimal Forex Trading.
Proper education and updated knowledge
Self-accountability has much to do with being knowledgeable. A well educated trader knows that forex trading can lead to scenarios beyond their control. Because of this, forex education and staying updated can provide more direction and an overview of the forex market. This means less risky trades and more control over your strategy.
In the long run, being a well informed forex trader can encourage a more accountable frame of mind. With a market full of possibilities, it is inevitable to experience unexpected turns. Forex traders should gain quality education and updated news to foresee any mishaps and to be responsible for all output.
The more you practice personal accountability, the closer you get to your trading goals.
Define your target output
You cannot attain personal accountability without knowing what you want out of trading. To become a self-reliant and accountable trader, you must clearly define your target goals. Once you determine what you want out of forex trading, you can efficiently plan and organize the steps needed to succeed. Doing this can help you achieve personal accountability when trading. Planning your progress can provide more discipline and effectiveness to deliver target results.
Always manage expectations
After achieving quality education and defining your goals, it is important to actively manage your expectations. This is an important step towards personal accountability because it enables traders to always see think realistically. With the right knowledge and results in mind, forex traders can be clearer about personal expectations. Doing this will not only help with self-accountability, but also the amount of work expected from the trader. It can encourage traders to oversee reality versus target goal. Practicing this mindset will allow you to easily accept challenges and remain accountable for all trades.
You must put in time and effort to achieve your goals while also keeping in mind the expected challenges of forex trading. To help you manage expectations, learn the 10 Healthy Ways to Set Trading Expectations.
Practice problem solving with technical know-how
Once you've achieved personal accountability, the next step is to practice problem solving. Without knowing how to improve the technical aspect, some traders may have a more challenging time creating an action plan. Because of this, always pair problem solving with optimal technical know-how.
After you hold yourself responsible for all trading output, you can easily stay consistent or enhance your trading strategy. Here are the 3 most effective ways to practice problem solving:
- According to Jon Mertz of Thin Difference, to solve the problem we must understand the problem. He suggests to turn the problem inside out to determine the details of challenge.
- Optimize your technical expertise to follow through and solve the problem. It is difficult to be accountable if you are not fully equipped with the necessary technical skills.
- To be self-accountable, you have to become instinctively adaptive. This means being able to change while remaining optimistic in the process.
For continuous growth, apply personal accountability to achieve optimal trading.
Responsibility while taking accountability
To become a successful trader, you have to take responsibility to efficiently accomplish all the tasks required. After this, you have to achieve personal accountability to be able to take action when needed. Even though trading is a personal venture, every activity still requires accountability. It means being able to rise above any situation and provide solutions for further progress. Whether you are a new or expert trader, mishaps can happen. By practicing personal accountability, you will be able to evaluate your efforts and effectively direct them towards success. Doing this will not only boost your performance but also encourage a well-rounded trading character.
For long term success, wanting profitable trades is not enough. Traders have to make a conscious effort to optimize strategies and accomplish tasks. In an uncontrollable market, taking responsibility of your decisions will build better trading character and initiative. Self-accountability also promotes better leadership skill which enhances overall mindset during any hardship. Practicing personal accountability will also ensure a performance-driven growth and proactive problem solving. A trader who is accountable has a great sense of when a strategy or skill needs improvement. Without viewing the challenge negatively, traders can easily take on obstacles with a progressive mindset.
EUR/USD Weekly Outlook
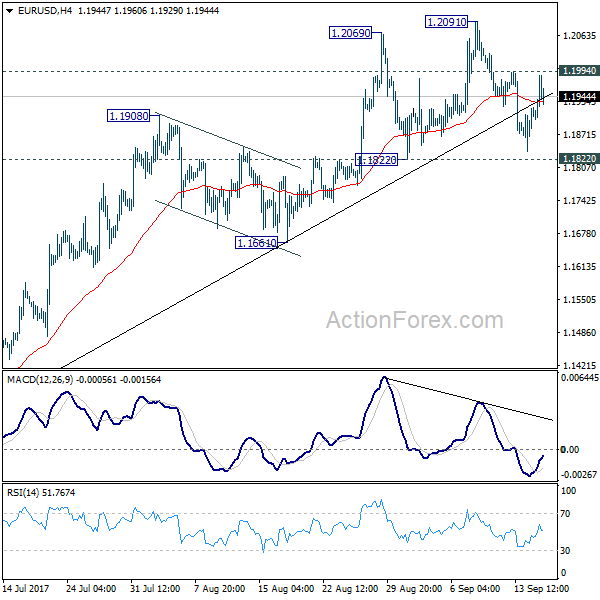
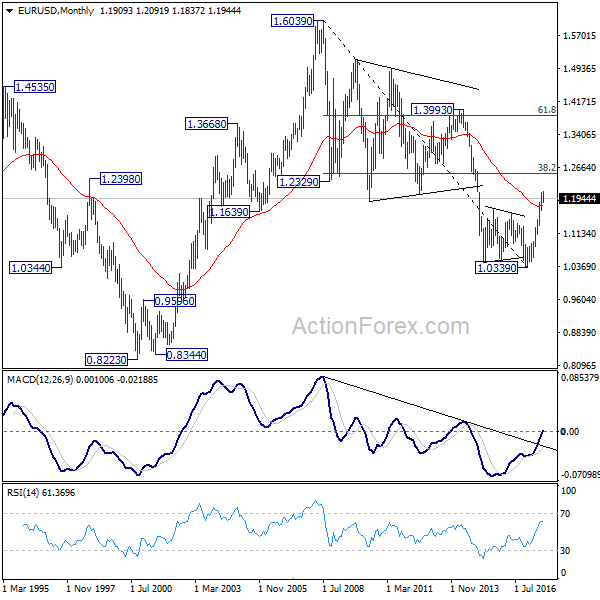
EUR/USD stayed in corrective trading below 1.2019 last week. But downside is contained above 1.1822 support so far. Hence, near term outlook remains bullish. Initial bias remains neutral this week first. Above 1.1994 will target 1.2091 high. Break there will extend larger rise from 1.0339 and target next key fibonacci level at 1.2516. But considering bearish divergence condition in 4 hour MACD, break of 1.1822 will confirm short term topping and bring deeper fall back to 1.1661 support and below.
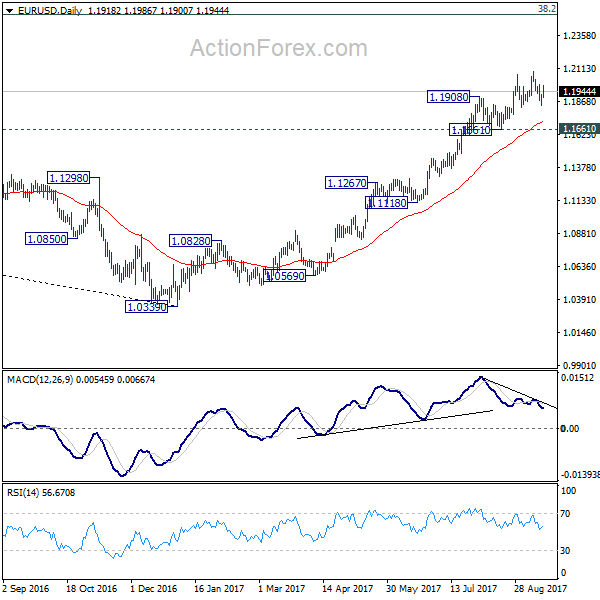
In the bigger picture, rise from medium term bottom at 1.0339 is still in progress for 38.2% retracement of 1.6039 (2008 high) to 1.0339 (2017 low) at 1.2516. However, it should be noted that there is no confirmation of trend reversal yet. That is, such rebound from 1.0399 could be a correction. And the long term fall fro 1.6039 (2008 high) could resume. Hence, we'd be cautious on strong resistance from 1.2516 to limit upside. But after all, break of 1.1661 is needed to indicate medium term topping. Otherwise, outlook will remain bullish in case of pull back.
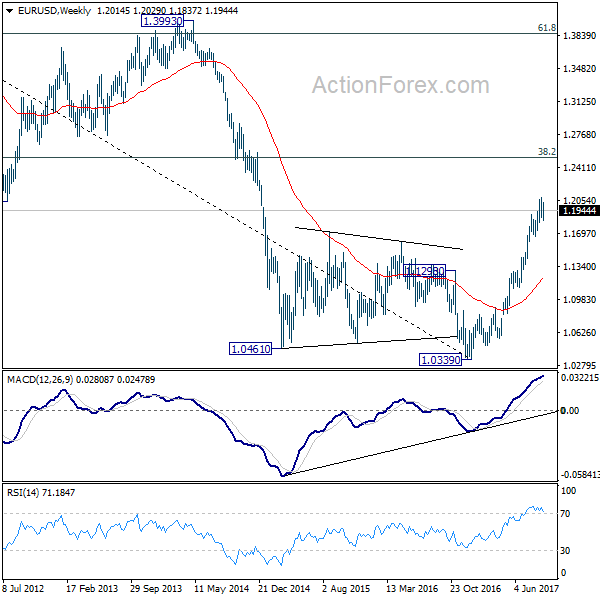
In the long term picture, 1.0339 is now seen as an important bottom as the down trend from 1.6039 (2008 high) could have completed. It's still early to decide whether price action form 1.0339 is developing into a corrective or impulsive move. But in either case, further rally would be seen to 38.2% retracement of 1.6039 to 1.0339 at 1.2516
USD/JPY Weekly Outlook
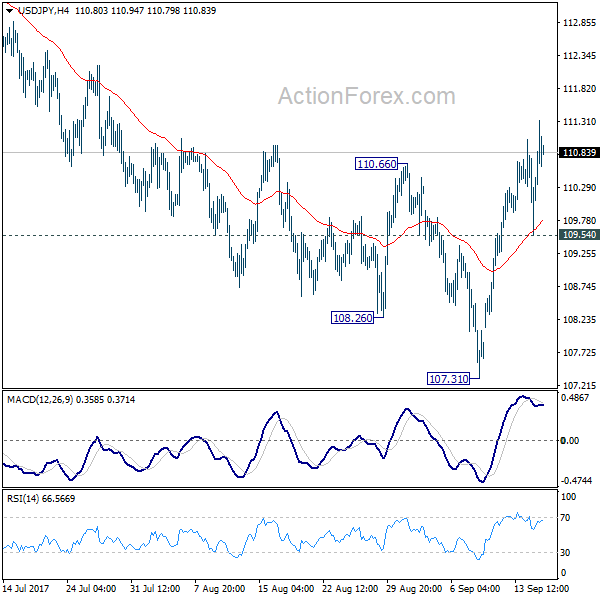
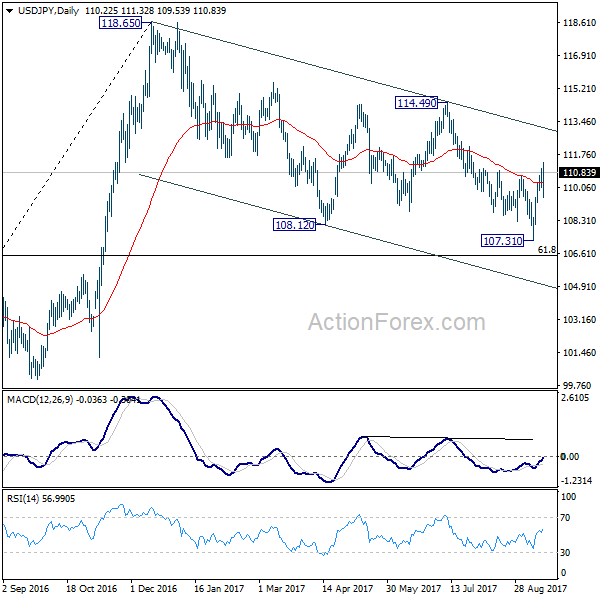
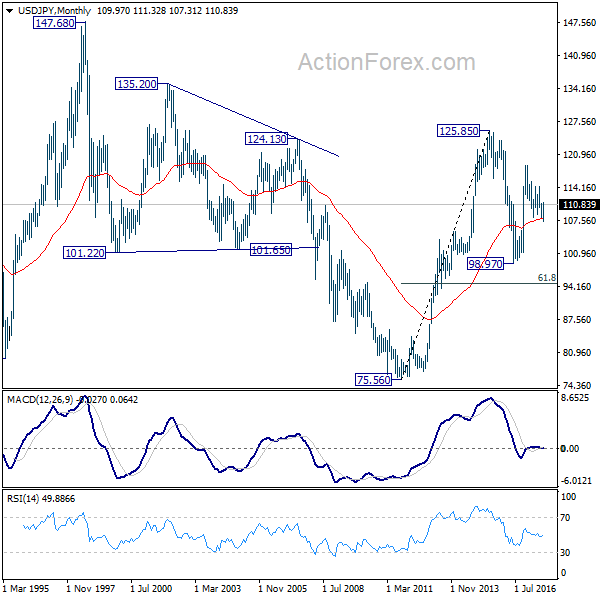
USD/JPY's strong rally last week argues that fall from 114.49 has completed at 107.31 already. Initial bias stays on the upside this week for medium term channel resistance (now at 113.14. Sustained break there will argue that whole correction from 118.65 has completed too. In that case, further rise should be seen to 114.49 resistance for confirmation. On the downside, below 109.54 minor support will turn bias back to the downside for 107.31 instead.
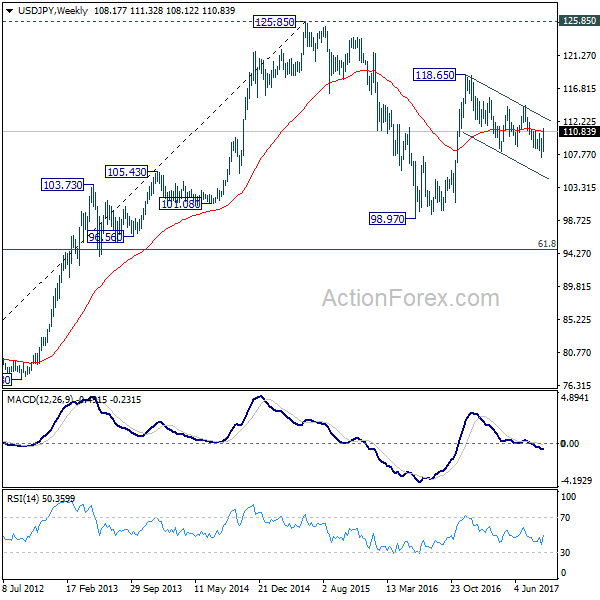
In the bigger picture, rise from 98.97 (2016 low) is seen as the second leg of the corrective pattern from 125.85 (2015 high). It's unclear whether this this second leg has completed at 118.65 or not. But medium term outlook will be mildly bearish as long as 114.49 resistance holds. And, there is prospect of breaking 98.97 ahead. Meanwhile, break of 114.49 will bring retest of 125.85 high. But even in that case, we don't expect a break there on first attempt.
In the long term picture, the rise from 75.56 (2011 low) long term bottom to 125.85 top is viewed as an impulsive move, no change in this view. Price actions from 125.85 are seen as a corrective move which could still extend. In case of deeper fall, downside should be contained by 61.8% retracement of 75.56 to 125.85 at 94.77. Up trend from 75.56 is expected to resume at a later stage for above 135.20/147.68 resistance zone.
GBP/USD Weekly Outlook
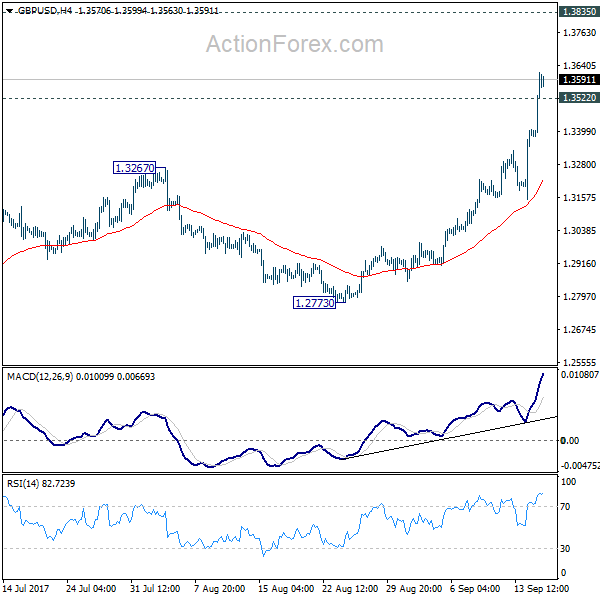
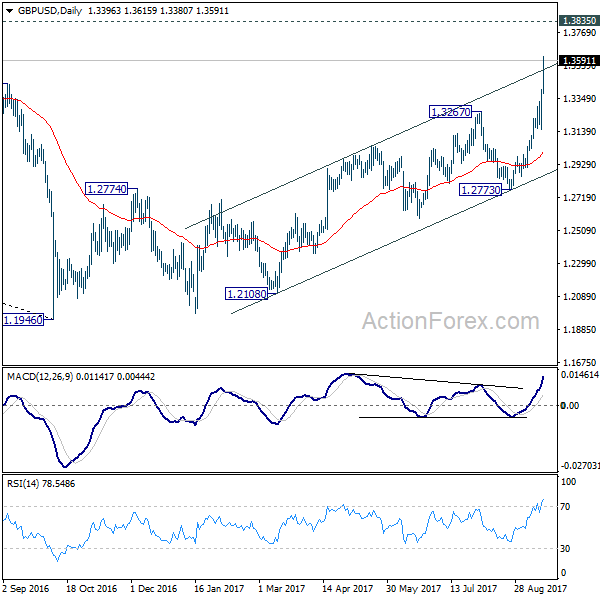
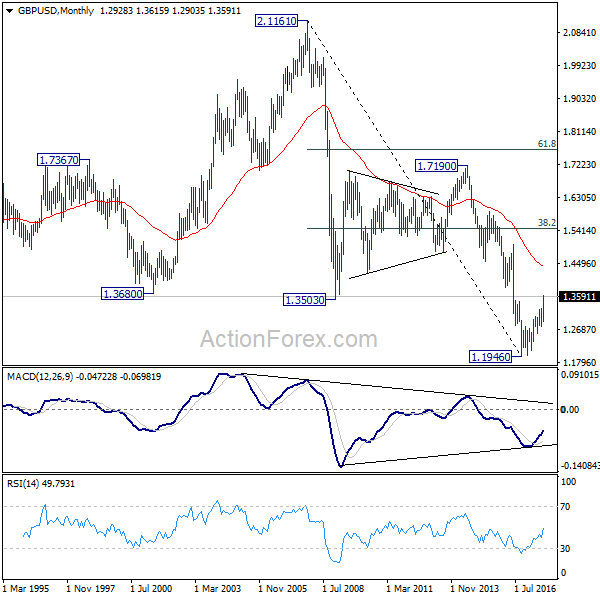
GBP/USD's strong rally last week and firm break of 1.3444 resistance is taken as a sign of larger trend reversal. Initial bias remains on the upside this week for medium term 1.3835 support turned resistance next. On the downside, below 1.3522 minor support will turn intraday bias neutral and bring consolidations, before staging another rally.
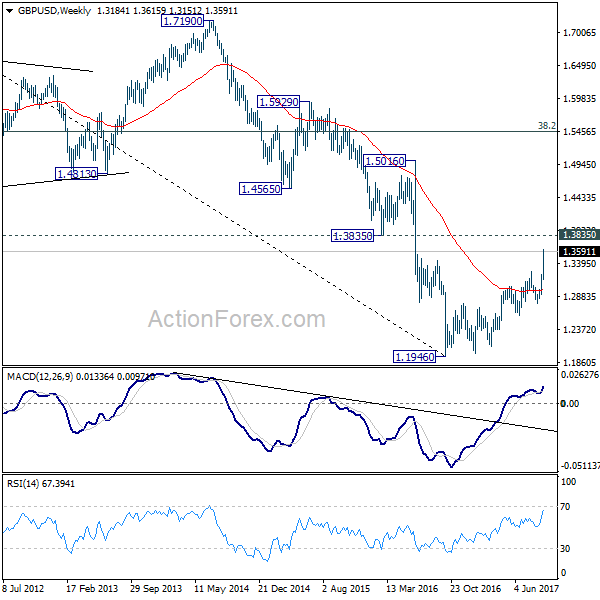
In the bigger picture, the strong break of 1.3444 key resistance now argues that the long term trend in GBP/USD has reversed. That is a key bottom was formed back in 1.1946 on bullish convergence condition in monthly MACD. Current rise from 1.1946 will target 38.2% retracement of 2.1161 (2007 high) to 1.1946 (2016 low) at 1.5466 next. In any case, medium term outlook will now stay bullish as long as 1.2773 support holds.
In the longer term picture, current development argues that whole down trend form 2.1161 (2007 high) is completed at 1.1946 already (2016 low). It's too early to tell is GBP/USD is staying a long term up trend. But in any case, further rise is in favor to 38.2% retracement of 2.1161 to 1.1946 at 1.5466 next. We'll monitor the structure of the current rally from 1.1946 to decide if it's an impulsive move.
USD/CHF Weekly Outlook
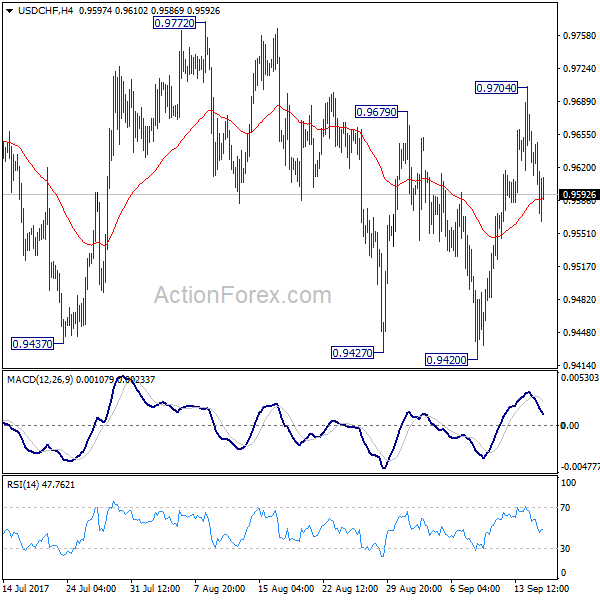
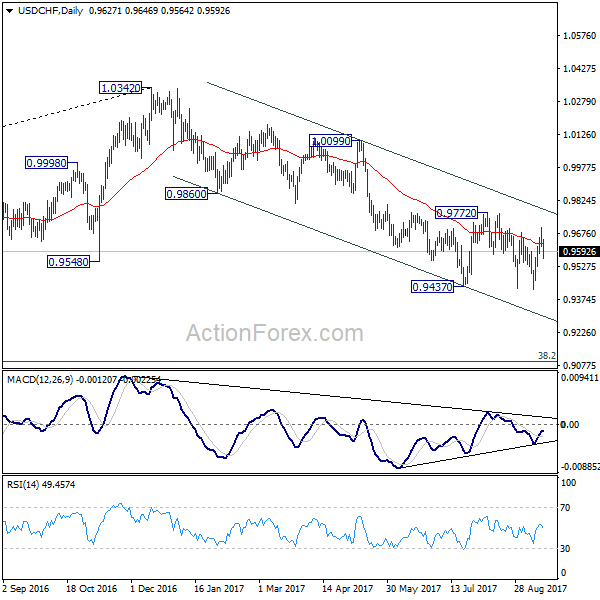
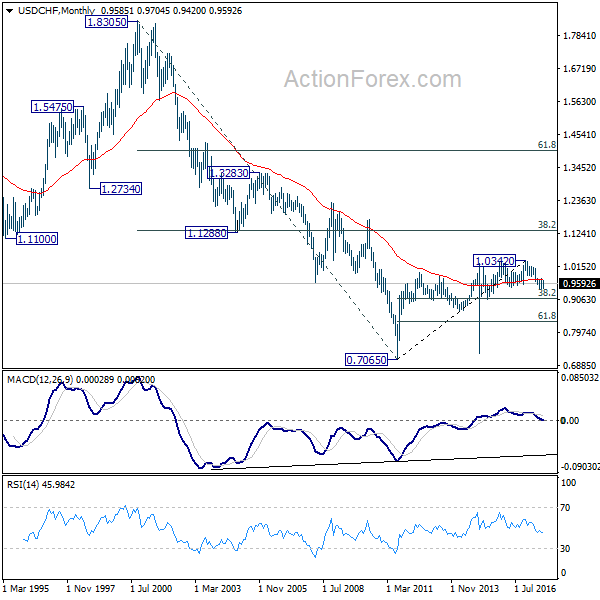
USD/CHF edged higher to 0.9704 last week but reversed since then. With 0.9772 resistance intact, outlook remains bearish. Initial bias stays mildly on the downside this week for 0.9420 low. Break will resume medium term fall from 1.0342 and target next long term fibonacci level at 0.9090. However, firm break of 0.9772 will indicate trend reversal and turn outlook bullish.
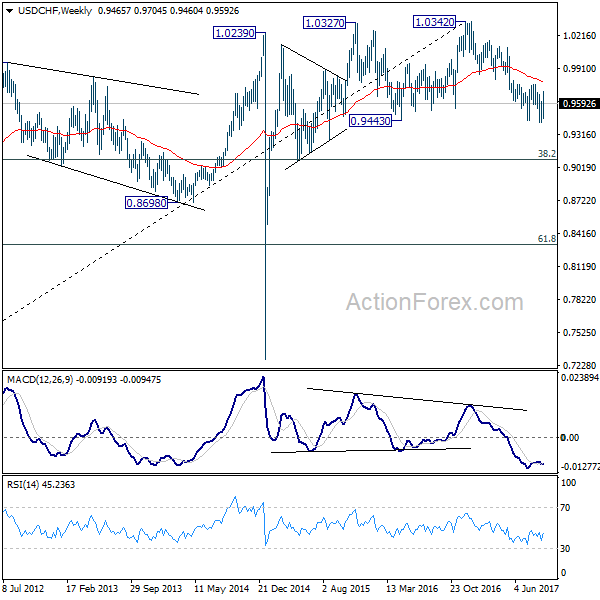
In the bigger picture, current development suggests that 0.9443 key support (2016 low) could be taken out firmly as down trend form 1.0342 extends. There are various interpretation of the price actions. But in any case, medium term outlook will stay bearish as long as 0.9772 resistance holds. Current down trend could extend to 38.2% retracement of 0.7065 (2011 low) to 1.0342 (2016 high) at 0.9090. However, break of 0.9772 will indicate that USD/CHF has successfully defended 0.9443 again and turn outlook bullish for 1.0099 resistance.
AUD/USD Weekly Outlook
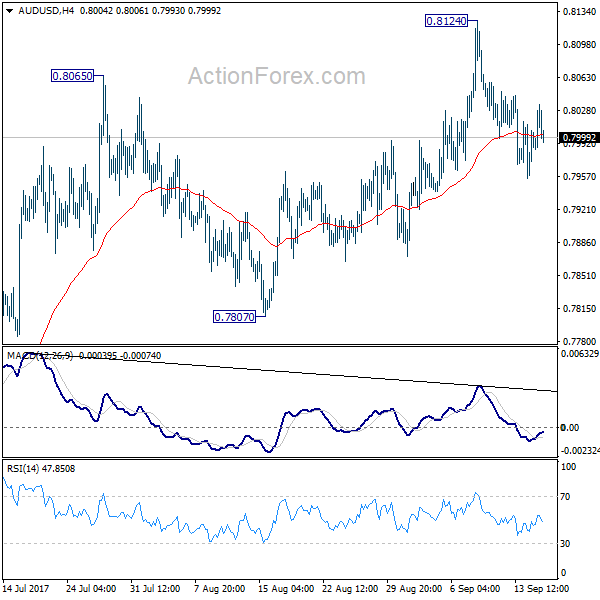
AUD/USD turned into consolidation below 0.8124 last week. Initial bias remains neutral first. With 0.7807 support intact, outlook stays bullish for another rally. Above 0.8124 will target 100% projection of 0.6826 to 0.7833 from 0.7328 at 0.8335 next. However, considering bearish divergence condition in 4 hour MACD, firm break of 0.7807 will indicate near term reversal and turn bias back to the downside for 0.7328 key support.
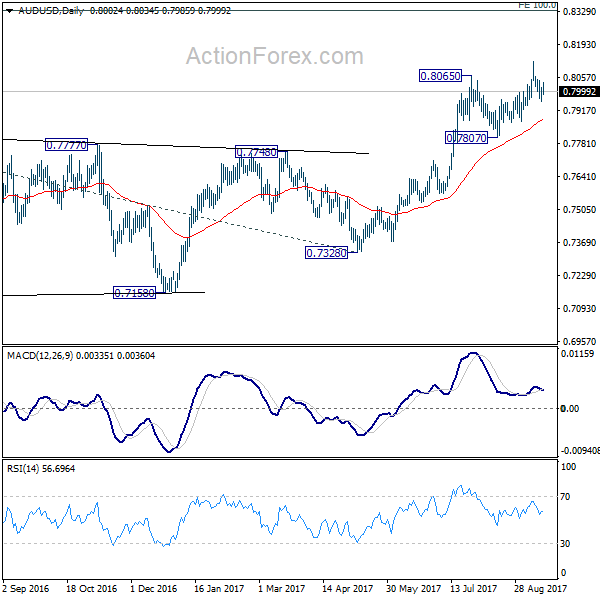
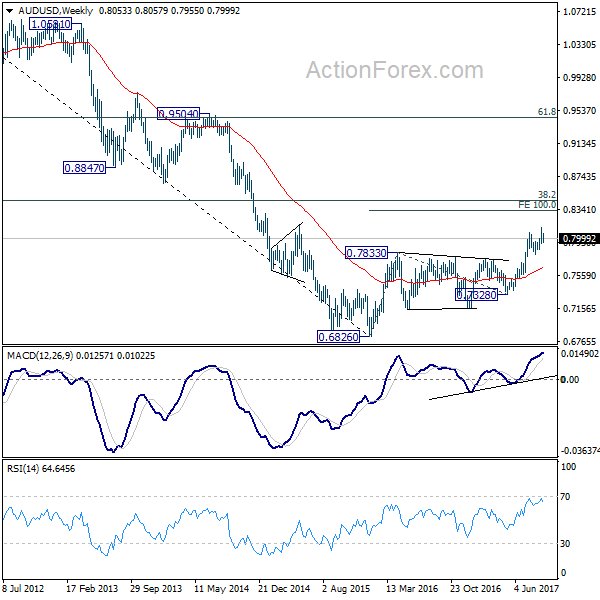
In the bigger picture, rise from 0.6826 medium term bottom is still in progress. At this point, there is no confirmation of trend reversal yet and we'll continue to treat such rebound as a corrective pattern. But in any case, break of 55 month EMA (now at 0.8090) will target 38.2% retracement of 1.1079 to 0.6826 at 0.8451. Break of 0.7807 support is needed to to be the first sign of completion of the rebound. Otherwise, further rise is now in favor.
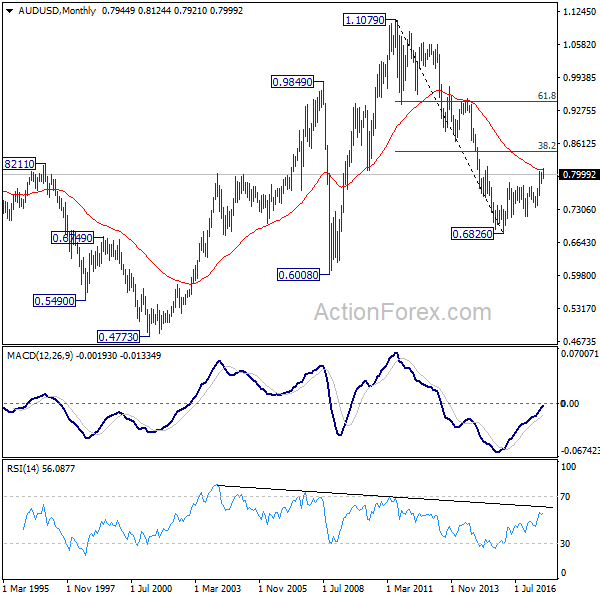
In the longer term picture, 0.6826 is seen as a long term bottom. Rise from there could either reverse the down trend from 1.1079, or just develop into a corrective pattern. At this point, we're favoring the latter. And, as long as 38.2% retracement of 1.1079 to 0.6826 at 0.8451 holds, we'd anticipate another decline through 0.6826 at a later stage.