Sample Category Title
New Zealand CPI unchanged at 2.2% yoy, non-tradeable pressures persist
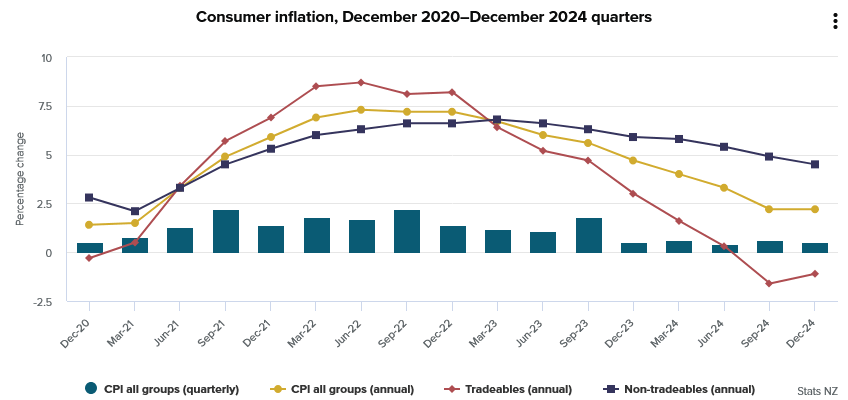
New Zealand’s CPI rose 0.5% qoq in Q4 2024, in line with expectations, as tradeable inflation increased 0.3% qoq and non-tradeable inflation rose 0.7% qoq. Annually, CPI was unchanged at 2.2% yoy, slightly exceeding the anticipated 2.1% yoy. This marks the second consecutive quarter that inflation has stayed within RBNZ's target range of 1% to 3%.
The data highlights diverging trends within inflation components. Non-tradeable inflation, which reflects domestic demand and supply conditions and excludes foreign competition, stood at 4.5% yoy, highlighting persistent internal price pressures. Tradeable inflation, influenced by global factors, recorded a -1.1% yoy decline.
Rent prices were the largest contributor to the annual CPI increase, rising 4.2% and accounting for nearly 20% of the overall 2.2% gain. Lower petrol prices, down -9.2% yoy, offset some of the upward momentum, with CPI excluding petrol increasing 2.7% yoy.
First Impressions: NZ Consumers Price Index, December quarter 2024
Consumer prices rose by 0.5% in the December quarter. That saw annual inflation remaining at 2.2%. However, core inflation has continued to ease. The result was close to expectation.
Headline inflation
- Quarterly change: +0.5% (prev: +0.6%)
- Westpac forecast: +0.5%, RBNZ (November MPS): +0.4%
- Market median: +0.5%, range +0.3% to +0.6%
- Annual change: +2.2% (prev: +2.2%)
- Westpac forecast: +2.1%, RBNZ (November MPS): +2.1%, Market: +2.1%
Non-tradables
- Quarterly change: +0.7% (prev: +1.3%)
- Westpac forecast: +0.8%, RBNZ (November MPS): +0.8%
- Annual change: +4.5% (prev: +4.9%)
Tradables
- Quarterly change: +0.3% (prev: -0.2%)
- Westpac forecast: -0.1%, RBNZ (November MPS): -0.2%
- Annual change: -1.1% (prev: -1.6%)
Consumer prices rose 0.5 % in the December quarter. That saw the annual inflation rate remaining unchanged at 2.2%.
The December quarter inflation result was in line with our forecast and just slightly above the RBNZ’s last published forecast (which had been finalised back in November).
Importantly, measures of core inflation (which track the underlying trend in consumer prices) have continued to trend down towards the RBNZ’s target range. And domestic inflation (non-tradables) has also been gradually dropping back. Consequently, we don’t think today’s result will have been a big surprise for the RBNZ.
What underpinned inflation in the December quarter?
The largest contributors to December’s rise in consumer prices were travel and accommodation costs, which typically record larger increases over the holiday months. The past three months saw domestic airfares rising 9%, with international airfares up 7%. Similarly, holiday accommodation costs were up around 3%.
We also saw further solid increases in insurance premiums over the past three months. However, after very large increases over the past year, the pace of those rises is now easing off as many insurance policies have now rolled on to higher premiums.
Housing costs were again an important contributor to the rise in overall consumer prices. Rents were up 0.8% in the December quarter, leaving them up 4.2% over the past year. We also saw construction costs rising by 0.3%. However, on both of these fronts, pressures are not as strong as they have been in recent years.
The December quarter also a large 4.7% increases in used car prices, which can be volatile on a quarter-to-quarter basis.
Balanced against those increases, food prices (19% of the CPI) fell 0.5% over the quarter as a result of the usual seasonal fall in fresh produce prices. Petrol prices (4% of the CPI) were also down 1.3% over the quarter. The December quarter also saw continued softness in the prices of apparel.
Annual and core inflation
The annual inflation rate remained unchanged at 2.2% in the year to December. However, it is well down from the levels we saw in recent years and comfortably within the RBNZ’s target band.
Importantly, while the December quarter did see large increases in some specific areas, price and cost pressures more generally have continued to ease. That was reflected in measures of core inflation which have continued to trend down and are now back inside the RBNZ’s target band (Core inflation measures smooth through volatile quarter-to-quarter movements and instead track the underlying trend in prices. They are a key focus for the RBNZ when assessing the strength of inflation pressures.). In terms of specifics:
- Inflation excluding food, fuel and energy costs fell to 3.0% from 3.1% previously.
- Trimmed mean inflation fell to 2.4% from 2.5% previously
- Weighted median inflation fell to 2.6% for 2.8% previously.
The downtrend in overall inflation over the past year is in large part due to the low level of tradables inflation, which mainly relates to imported retail goods
- Tradable prices rose by 0.3% this quarter, leaving them down 1.1% over the past year. Tradables inflation was stronger than expected in the December quarter. However, that was mainly due to the large increase in used car prices. The broader trend in imported inflation remains soft.
- The fall in tradables prices has in part been due to a reversal of the tight global supply conditions that saw import prices rise sharply in recent years.
- The downward pressure on prices has been amplified by the pressures on household budgets and the related weakness in discretionary spending. That’s resulted in softness in the prices of a range of consumer goods like clothing.
- However, the downturn in imported inflation looks like it is now coming to an end, especially with oil prices pushing higher and the NZD dropping in recent weeks. Over the coming year, even though we don’t expect high levels of tradable inflation, it won’t have the same dampening impact on overall consumer prices that we saw in 2024.
On the domestic front, non-tradable prices rose 0.7% in the December quarter. That saw annual non-tradables inflation slowing to a still elevated rate of 4.7%. While that result was softer than we or the RBNZ expected, changes in how the cost of pharmaceutical products are recorded contributed to the surprise. More generally, the underlying trend in non-tradables inflation looks in line with expectations for a continued gradual easing in domestic prices.
- The strength in non-tradables inflation has been a key concern for the RBNZ in recent years. And we’re still seeing solid increases in cost such as local council rates and insurance premiums, which tend to be less sensitive to the level of interest rates. That’s limiting the decline in overall domestic inflation.
- However, price and cost pressures have been cooling in parts of the domestic economy that are sensitive to the high level of interest rates in recent years. For instance, weak demand over the past year has contributed to a marked slowdown in construction cost inflation and has also restrained price increases in the hospitality sector.
Implications
Overall inflation is close to 2%, and both core and domestic inflation are easing. In addition, economic activity was softer than expected through the latter part of last year. Against that backdrop, we expect that the RBNZ will deliver another 50bp cut when they next meet in February.
We expect inflation will remain well contained over the year ahead. However, the risks for inflation aren’t all to the downside, especially given the rocky global environment and downside risk for the New Zealand dollar. That will be an important area to watch over the coming year if inflation is to remain close to 2% on a sustained basis.
Amazing Netflix
Netflix blew past the market expectations last quarter and closed the year on a very high note. The company added 18.9 mio new subscribers last quarter – its biggest ever quarterly jump in subscriptions. The company added more than 41 mio subscribers over the year and has now more than 300 mio subscribers around the world. And it’s not even due to a pandemic or a temporary situation (like the Squid Game peak). It’s because their strategic bet of streaming major live sport events is paying off and hints at a further upside potential. Even more so as the company is planning to raise the price of its services in the US, Canada, Portugal, and Argentina between $1-1.5 depending on the plan which could bring up to $1bn additional revenue to the company. No wonder the company raised its revenue outlook for this year to between $43.5 and $44.5bn. The share price jumped more than 14% in the afterhours trading and will claim the $1000 psychological level, defying yesterday’s shooting star pattern.
More good news for the tech lovers. Trump, together with Softbank and Oracle, announced to invest as much as $500bn in AI infrastructure in the next four years. An initial investment of around $100bn will focus in date centers in Texas to provide the necessary storage and processing capabilities to handle vast amounts of data efficiently. The broader – so called Stargate project – will also include plans for electricity generation to support these data centers, which will also rely on nuclear energy to ensure a reliable and sustainable power supply for the energy-intensive operations of AI systems. Oracle jumped more than 7% on the news, while VanEck’s uranium and nuclear ETF gained almost 5%.
The news also boosted growth and productivity expectations more than they fueled the ballooning debt worries. The US yields were higher yesterday with the 2-year yield is settling around the 4.30% level but the equity indices were better bid despite the rising yields. The S&P500 extended gains by 0.88%. Nasdaq 100 was also up, but the index printed a doji day hinting at some hesitation among the tech investors. Nvidia gained more than 2% on the AI news but Apple’s 3% dive due to a 18% fall in its China sales kept sentiment somewhat mitigated. Note that the meltdown in Chinese numbers resulted in a 5% slide in Apple’s global iPhone sales. But anyway, the US small and mid caps led the rally on hope that Trump’s America First policies would boost domestic industries. And that matched this year expectation of a broadening equity rally beyond the tech and beyond the US borders.
Elsewhere, the Stoxx 600 index gained yesterday and closed a few points below an ATH level defying the morose growth outlook for the European economies. Here, the rally is mostly backed by the big valuation gap between the US and Europe that gets investors looking for gems in Europe. Citigroup’s top investment banker said that ‘you have gems of companies’ in Europe that they sometimes call ‘good houses in bad neighbourhoods’. Rough, right. The good news is that the valuation of good houses in bad neighbourhoods could rise if the overall market conditions are right – and right now, the ECB’s easing policy stance and the bets of convergence in valuations with the US are supportive. But the valuations will certainly be capped by the external constraints, like lack of innovation, overly strict regulations and political issues. And that’s what worries me with the broader European companies. You really have to find those gems.
The same goes for the UK. The UK’s FTSE 100 has printed its third record high in the 3 past sessions, but the index is fueled by global optimism and certainly by weak pound that allows investors to buy UK companies with international businesses at cheaper prices. Happily for Rachel Reeves, though, the gilt yields came further down yesterday after the jobs data showed that the wages grew more than expected but the number of payrolled people fell by 47K – that’s the biggest decline since late 2020 – when the pandemic hit and is a sign that companies are cutting staff on the government’s tax rise plans. This leaves the BoE in a difficult place. The BoE is expected to deliver around 64bp cuts this year. So that reads as two 25bp cuts and maybe a third cut. Cable gained yesterday on the back of a hotter-than-expected wages figures and probably also on the back of crowded US dollar longs that led to a broadbased meltdown in the US dollar. Yesterday’s doji candlestick and, trend and momentum indicators hint that we could see a deeper downside correction in the US dollar. The dollar index could retreat a few pips before threatening to reverse the medium term bullish trends. Technically, the EURUSD will remain in the bearish trend unless it breaks above the 1.06, the major 38.2% Fibonacci retracement on the September to now selloff, while Cable will remain in the negative trend below the 1.2650, its own 38.2% Fibonacci retracement on the September to January selloff.
Elsewhere, US crude remains under pressure, but will likely seek support near the $75.20/75.40pb range – corresponding to the 200-DMA and the major 38.2% Fibonacci retracement that should distinguish between the continuation of the latest positive trend and a medium term bearish reversal.
Initial Responses to the First Moves of President Trump
In focus today
Markets remain closely focused on President Trump's actions during this first week of his presidency. He is anticipated to issue several executive orders building on his current momentum, leading to US news continuing to dominate the headlines as markets and world leaders alike are left navigating the implications.
Economic and market news
What happened overnight
In the US, President Trump halted more than USD 300bn in US green infrastructure funding, while paving the way for a USD 500bn private-sector investment in AI infrastructure. He also disclosed that his administration was currently discussing a 10% tariff on China, as well as saying the EU will get tariffs due to the EU's "troubling" trade surplus with the US.
What happened yesterday
In the US, President Trump continued his signing off on executive orders, freezing federal hiring for all except the military and immigration services. Overnight, he announced that he would impose 25% tariffs on imports from both Canada and Mexico over border problems on 1 February. He also threatened the EU over the US trade deficit with Europe, suggesting that either tariffs or increased EU oil purchases from the US could be a solution.
Political leaders from, among others, the EU, Germany, Canada, China and Mexico argued against tariffs and urged Trump to be cautious, with specifying how they might react if tariffs or other sanctions come into place.
In Germany, the ZEW index for January showed a mixed picture: The assessment of the current situation rose to -90.4 (cons: -93.1) from -93.1, marking the highest point in three months and suggesting some stabilization after a six-month decline. However, expectations declined to 10.3 (cons:15.1) from 15.7, indicating reduced optimism for future growth. We do not anticipate that these mixed signals, nor the upcoming PMIs on Friday will significantly affect the ECB's rate decisions for January and March.
In the UK, the labour market report for November/December came out in line with expectations. The unemployment rate increased as expected to 4.4% in November (from 4.3%) and vacancies continue to trend lower signalling a cooling trend in the jobs market. Wage growth remains elevated with wage growth ex-bonus coming in slightly hotter than expected at 5.6% 3M/YoY (cons: 5.5%, prior: 5.2%) with a tick up in private sector wage growth as well. We continue to expect the BoE to opt for a gradual easing cycle with the next 25bp cut in February.
Equities: Global equities rose following the inauguration of Trump. In all fairness, the limited macro data and earnings reports on the agenda yesterday were generally strong too and probably helped the positive sentiment in equities. However, we argue that investors perceived the sum of Trump's speeches and approximately 50 executive orders as less negative than feared. Consequently, a relief rally took place, which may continue if Trump refrains from making further threats, especially regarding tariffs directed at China and Europe. The 10% tariff against China he mentioned yesterday is still significantly lower than what consensus had anticipated. Additionally, having moved past this event and the associated event risk, we should increasingly see focus shifting back to macro and micro factors this week. We are currently receiving considerable support for equities and risky assets. Next week, we have the major central banks to help divert attention away from politics.
In the US yesterday, the Dow rose by 1.2%, the S&P 500 by 0.9%, the Nasdaq by 0.6%, and the Russell 2000 by 1.9%. By examining the differences between indices, one can observe that the breadth was positive again yesterday as the equal-weight S&P continued to build on last week's approximately 100 basis points outperformance versus the cap-weighted S&P. Asian markets are mostly higher this morning, buoyed by Japan. However, Chinese markets are reacting negatively to Trump's tariff comments. US and European futures are higher this morning, led by some of the companies reporting after the US cash close yesterday.
FI: European rates ended in a slight bull flattening move, with the short end about 1bp lower and the 30y point about 3bp lower. 10y Bunds stands at 2.51%. However, this only came following the mid-day reversal of the morning sell-off. The reversal may be attributable to markets taking comfort with Trump not announcing an elaborate tariff plan upon inauguration.
FX: USD remained on a weak footing yesterday amid the lack of immediate action from US President Trump on key policies, including import tariffs. SEK had another strong day together with GBP and EUR. EUR/USD ended the day above 1.04 and EUR/SEK fell firmly below 11.50.
USD/CHF Holds Gains: Will Dollar Bulls Be Back In Action?
Key Highlights
- USD/CHF corrected some gains and tested the 0.9050 support.
- A key declining channel is forming with resistance at 0.9120 on the 4-hour chart.
- EUR/USD is consolidating below the 1.0450 resistance.
- Gold extended gains and might climb further toward the $2,750 level.
USD/CHF Technical Analysis
The US Dollar climbed steadily above the 0.8950 and 0.9000 levels against the Swiss Franc. USD/CHF even tested 0.9200 before there was a pullback.
Looking at the 4-hour chart, the pair traded as low as 0.9050 and is currently preparing for the next move. It is still well above the 200 simple moving average (green, 4-hour). If the bulls take over, they could face resistance near the 0.9120 level.
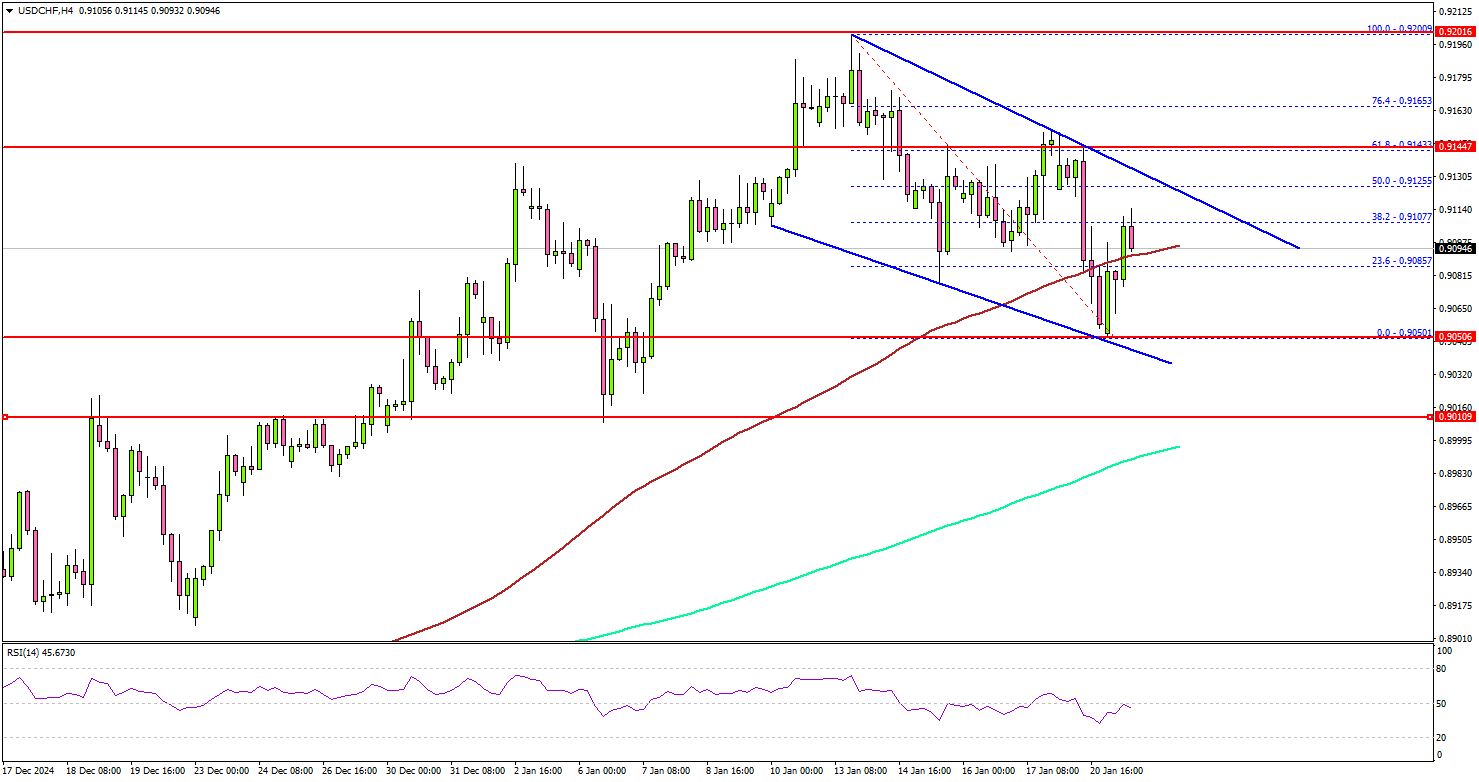
There is also a key declining channel forming with resistance at 0.9120 on the same chart. The next major resistance is near the 0.9140 level.
A close above the 0.9140 level could set the tone for another increase. In the stated case, the pair could rise toward the 0.9200 resistance. The main hurdle could be 0.9240.
On the downside, immediate support sits near the 0.9050 level. The next key support sits near the 0.9020 level. Any more losses could send the pair toward the 0.9000 level and the 200 simple moving average (green, 4-hour).
Looking at EUR/USD, the pair started a short-term recovery wave, but the bears are active below the 1.0450 resistance zone.
Upcoming Economic Events:
- ECB's President Lagarde speech.
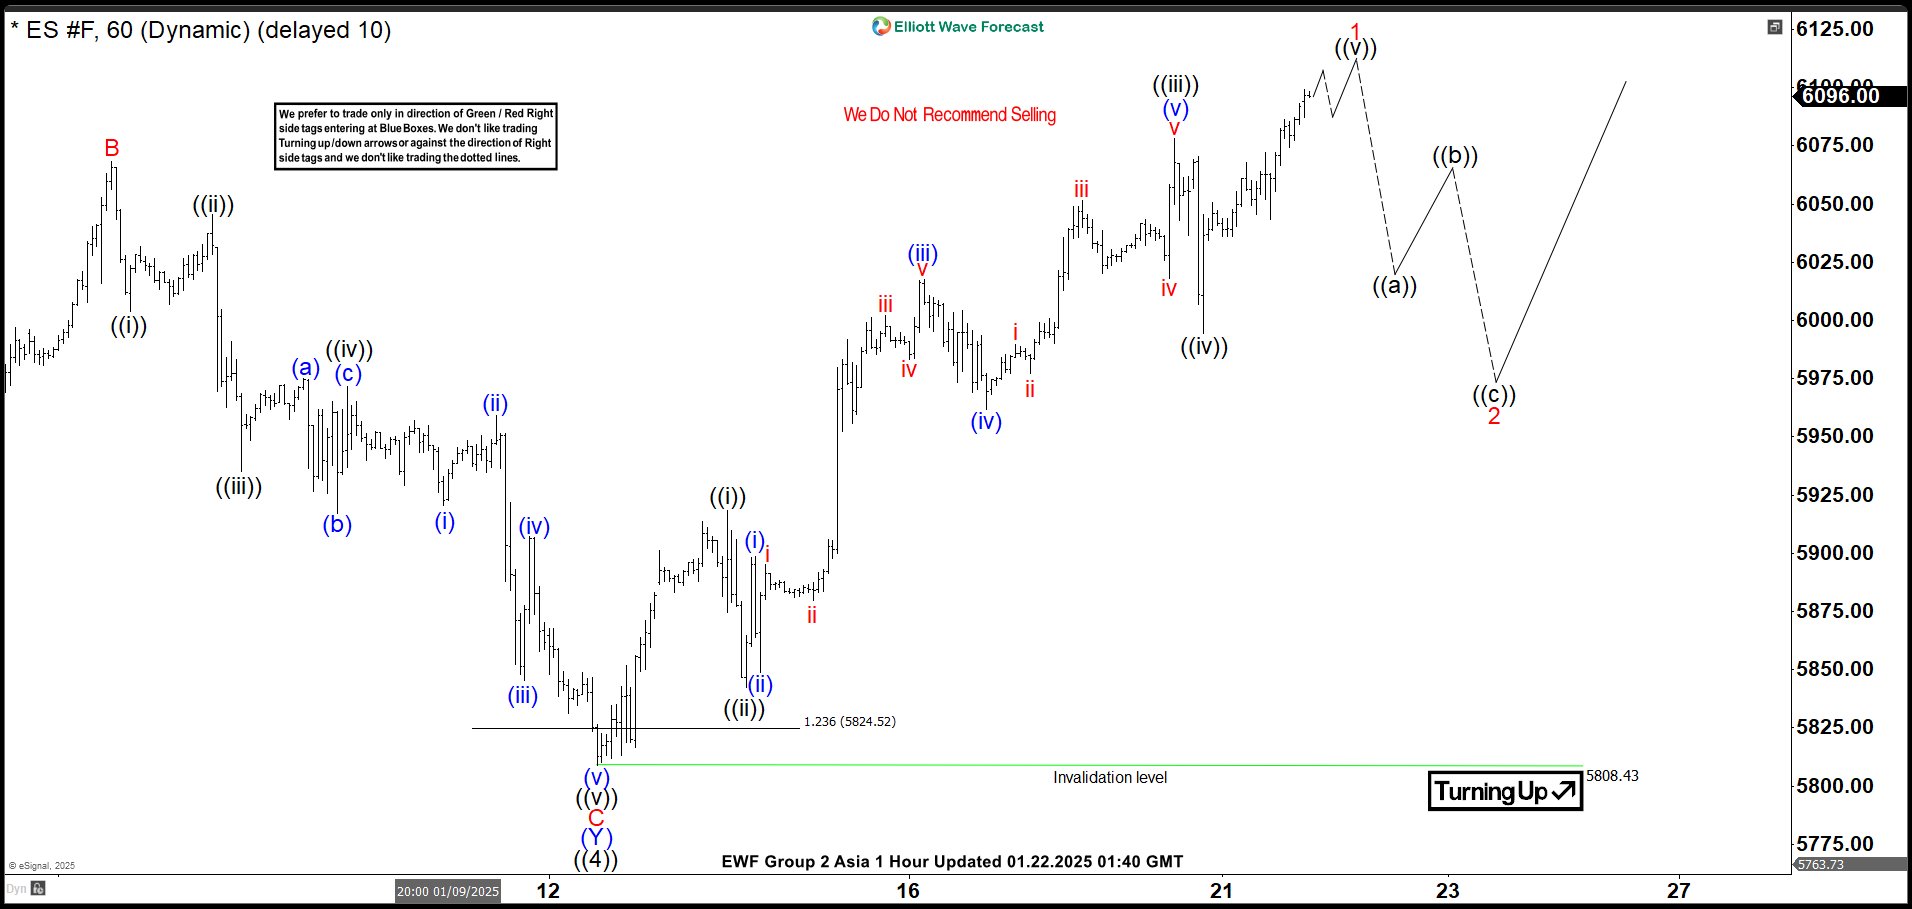
Elliott Wave View on S&P 500 Futures (ES) Looking to Resume Higher
Short Term Elliott Wave view in S&P 500 Futures (ES) suggests that rally to new all time high on 12.16.2024 at 6163.75 ended wave ((3)). Pullback in wave ((4)) is proposed complete at 5808.4 as the 1 hour chart below shows. Internal subdivision of wave ((4)) unfolded in a double three structure. Down from wave ((3)), wave (W) ended at 5866 and wave (X) ended at 6107.5. Wave (Y) lower ended at 5809 which completed wave ((4)).
The Index has turned higher in wave ((5)), but it still needs to break above wave ((3)) at 6163.75 to rule out a double correction. Up from wave ((4)), wave ((i)) ended at 5918.5 and wave ((ii)) pullback ended at 5842.50. Index nested higher in wave ((iii)). Up from wave ((ii)), wave (i) ended at 5898.75 and pullback in wave (ii) ended at 5848.75. Wave (iii) higher ended at 6017.50 and pullback in wave (iv) ended at 5961.75. Final leg wave (v) ended at 6078.25 which completed wave ((iii)). Dips in wave ((iv)) ended at 5994.5. Expect wave ((v)) to complete soon which should end wave 1 in higher degree. Afterwards, it should pullback in wave 2 to correct cycle from 1.13.2025 low in 3, 7, or 11 swing before it resumes higher.
S&P 500 Futures (ES) 60 Minutes Elliott Wave Chart
ES_F Elliott Wave Video
https://www.youtube.com/watch?v=CQydGNh_lOI
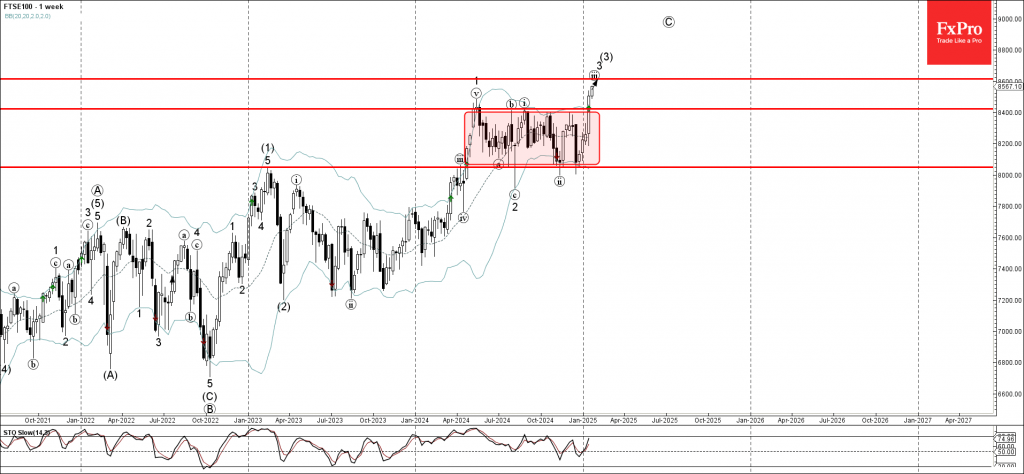
FTSE 100 Wave Analysis
- FTSE 100 broke strong resistance level 8400.00
- Likely to rise to resistance level 8600.00
FTSE 100 index rising sharply after the price broke the strong resistance level 8400.00, which is the upper border of the sideways price range inside which the index has been moving from the start of 2024.
The breakout of this price range inside accelerated the active impulse waves iii and 3, which belong to the weekly upward impulse sequence (3) from the start of 2023.
Given the overriding uptrend seen on weekly charts, FTSE 100 index can be expected to rise to the next resistance level 8600.00, the target price for the completion of the active impulse wave iii.
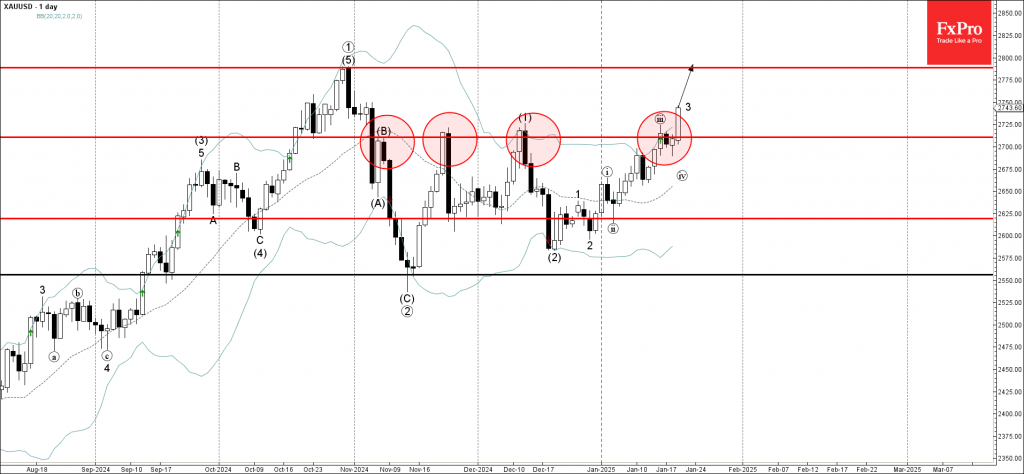
Gold Wave Analysis
- Gold under bullish pressure
- Likely to rise to resistance level 2785.00
Gold under the bullish pressure after the earlier breakout of the key resistance level 2710.00, which has been steadily reversing the price from November.
The breakout of the resistance level 2710.00 accelerated the active impulse wave 3, which belongs to the medium-term impulse wave (3) from December.
Given the clear uptrend that can be seen on the daily and the weekly charts, Gold can be expected to rise to the next resistance level 2785.00, former multi-month high from October.
January Flashlight for the FOMC Blackout Period
Summary
- The FOMC cut its target rate for the federal funds rate by 100 bps between September and December. However, a pause in its easing cycle seems like a done deal when the Committee meets next on January 29.
- Not only has the economy entered 2025 with a solid head of steam, but progress on returning inflation to the Fed's target of 2% has been painfully slow in recent months. Therefore, many FOMC members seem to question the need for further policy accommodation at this time.
- The FOMC is not scheduled to release a "dot plot" at the conclusion of the meeting, so it will need to signal any policy intentions it wishes to give via the post-meeting statement and Chair Powell's press conference. We expect the FOMC will make only modest tweaks to its post-meeting statement. We also believe Chair Powell will continue to indicate that the Committee is not on a preset course, and that future policy moves will depend on incoming data.
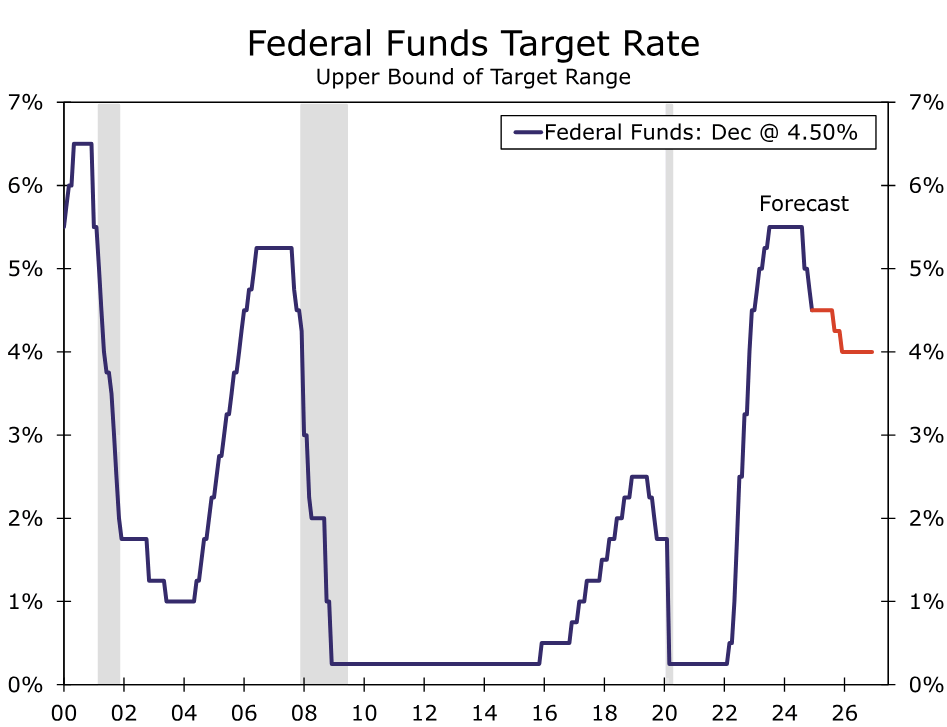
- Looking forward, we expect the FOMC will maintain its target range for the federal funds rate at 4.25%-4.50% through the first half of the year. We have penciled in a 25 bps rate cut at the September policy meeting, and a similar-sized reduction in December. We then look for the FOMC to remain on hold at 3.75%-4.00% throughout 2026.
- That noted, the FOMC's policy actions in coming months will be dictated in part by policy choices, especially related to tariffs, that the Trump administration makes. In our view, uncertainty related to the new administration's economic policy imparts uncertainty onto the outlook for monetary policy.
- We have pushed back our forecast for the end of quantitative tightening (QT). We now expect the FOMC will announce the end of QT at its May meeting, one meeting later than our previous forecast. We look for balance sheet runoff to cease at the beginning of June, although MBS runoff likely will continue, with mortgage paydowns replaced one-for-one with Treasury securities.
All Signs Point to a Pause in the Easing Cycle on January 29
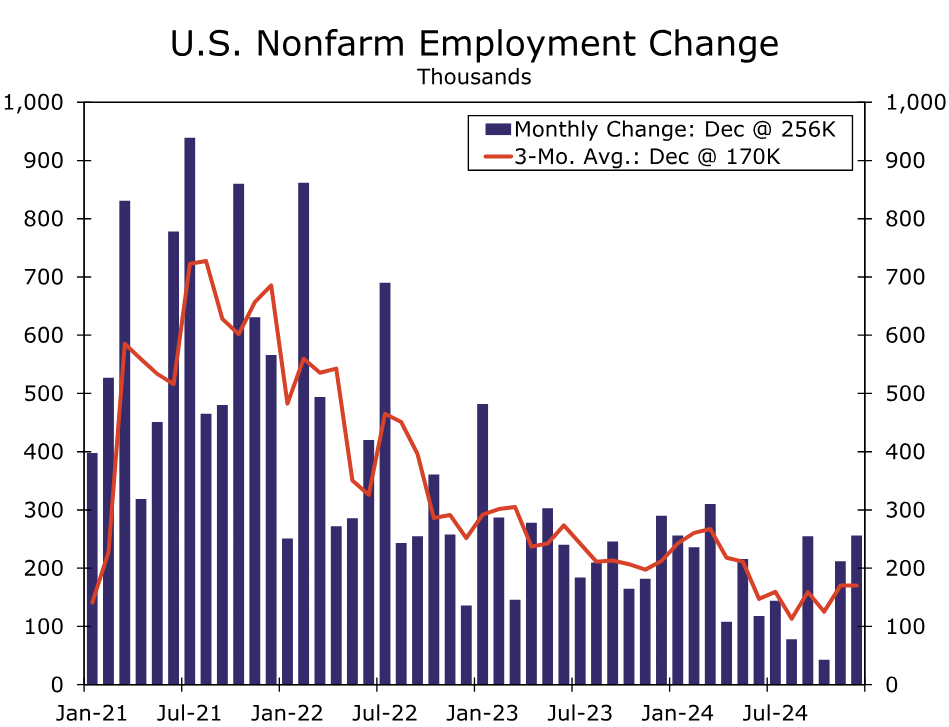
As we discussed in our recent U.S. Economic Outlook, the American economy entered 2025 with solid momentum. We estimate real GDP grew 2.7% (annualized rate) on a sequential basis in the fourth quarter of last year. (The Bureau of Economic Analysis will publish real GDP data for Q4-2024 on January 30.) If this estimate is reasonably accurate, then real output would have expanded at a strong rate of 2.8% on an annual average basis in 2024. Moreover, job creation, which is a good coincident indicator of the pace of economic activity, remained solid as the economy created 170K jobs per month on average in the fourth quarter (Figure 1).
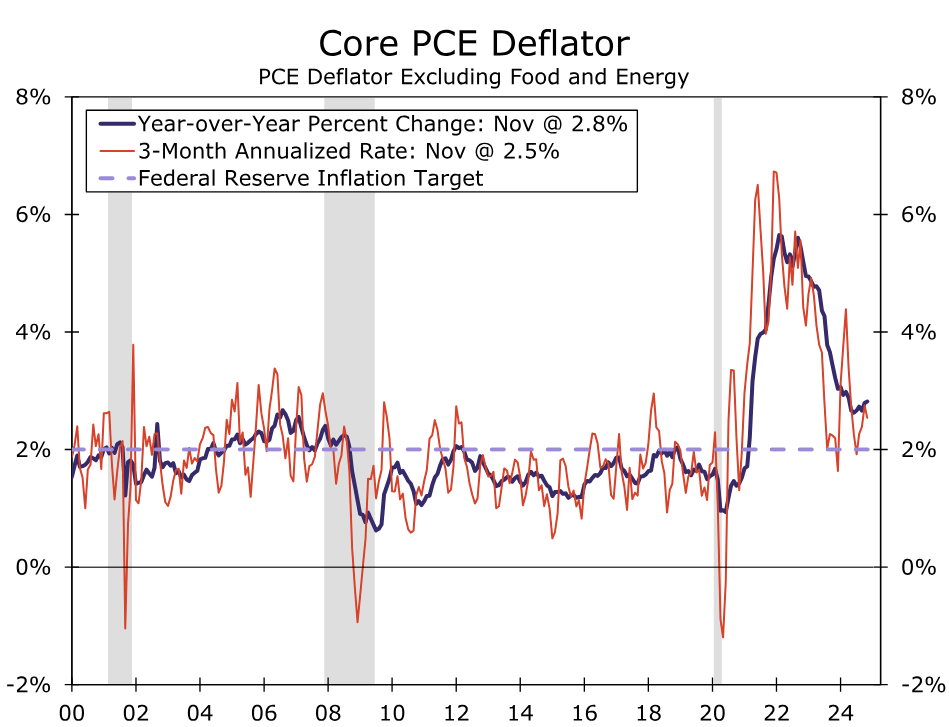
Meanwhile, progress on returning inflation to the Fed's target of 2% appears to have stalled. The year-over-year change in the core PCE deflator, which most Fed officials believe is the best measure of the underlying rate of consumer price inflation, fell from 5.6% in September 2022 to 2.6% in June 2024 (Figure 2). However, this rate of inflation has subsequently edged up to 2.8% in November, and we estimate it stayed at 2.8% in December.
Market participants widely expect the policymaking Committee to keep its target range for the federal funds rate unchanged at 4.25%-4.50% at its upcoming meeting on January 29, an expectation we share. There are a few factors that support our expectation of a pause in the recent easing cycle. First, the solid pace of economic growth and disappointing news on inflation that we highlighted above argue against the need for more policy accommodation at this time.
Second, many FOMC members have indicated that pausing the easing cycle, at least for the time being, may be appropriate. Beth Hammack, the president of the Federal Reserve Bank of Cleveland, voted against the Committee's decision to cut rates by 25 bps at the previous FOMC meeting on December 18. Three non-voting members seemed to agree with her, with a total of four participants leaving their "dot" for the appropriate policy rate at the end of last year at 4.50%-4.75%. Minutes of that meeting revealed that "a majority of participants noted that their judgments about this meeting's appropriate policy action had been finely balanced." With the economy showing few signs of deterioration since December 18, these members presumably feel even less need to cut rates further, at least at this time.
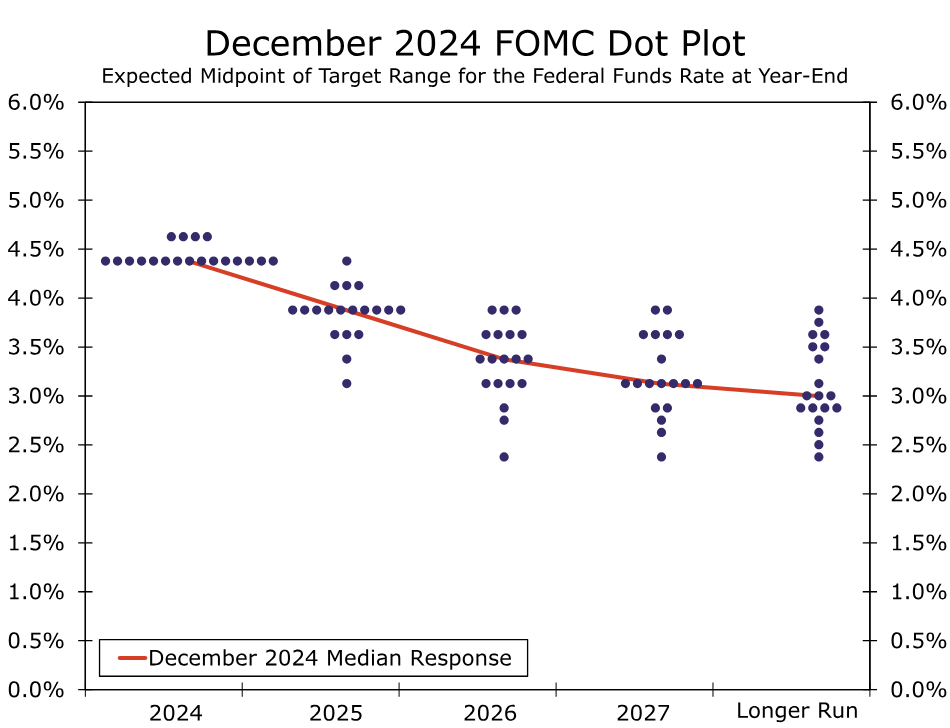
The "dot plot" that was released at the conclusion of the December 18 meeting showed that 14 of the 19 Committee members judged that a target range for the federal funds rate of 3.75%-4.00% or higher at the end of 2025 would be appropriate (Figure 3). This range is only 50 bps lower than the current one. When the previous dot plot was released in September, 17 of the 19 members judged that it would be appropriate to reduce the target range below 3.75%-4.00% by the end of this year. Clearly, there has been a significant reassessment among FOMC members about the degree of additional policy easing that is appropriate this year.
There will not be a Summary of Economic Projections (SEP) released at the conclusion of the meeting on January 29. Therefore, the FOMC will need to signal its intentions via the post-meeting statement and comments that Chair Powell makes in his press conference. We expect the FOMC will make only modest tweaks to its post-meeting statement relative to the one that was released on December 18. The Committee likely will continue to characterize the pace of economic growth as "solid," and it probably will continue to refer to inflation as "somewhat elevated." The last statement used the clause "in considering the extent and timing of additional adjustments to the target range for the federal funds rate..." to help signal the FOMC's "bias" to ease further. Because the vast majority of Committee members at the last FOMC meeting viewed some additional policy easing as appropriate in 2025, we believe the January 29 statement will retain this clause in order to preserve policy optionality. We also believe Chair Powell likely will continue to indicate that the Committee is not on some preset course, and that future policy moves will depend on incoming data.
New Voting Members on the FOMC at this Meeting
The first meeting of 2025 will include the annual shift in the voting members of the FOMC. All 19 FOMC officials participate in every Committee meeting, but only 12 get to vote on the policy decision. For the seven-member Board of Governors, there will be no changes. There are not currently any vacancies on the Board, with the next vacant seat scheduled to be Adriana Kugler's in January 2026. Governor Michael Barr intends to step down from his position as Vice Chair of Supervision effective February 28, 2025—or earlier if a successor is confirmed. However, Barr has signaled his intention to continue to serve as a member of the Board of Governors. The remaining five voters on the FOMC are drawn from the ranks of the 12 regional Federal Reserve Banks, with the Federal Reserve Bank of New York holding a permanent voting seat. The new 2025 voters will be Austan Goolsbee (Chicago), Susan Collins (Boston), Alberto Musalem (St. Louis) and Jeffrey Schmid (Kansas City). We believe the new voters include a healthy mix of policymakers with both more dovish leans (e.g., Goolsbee) and hawkish leans (e.g., Schmid), and we do not expect this year's rotation to result in a dramatic departure from the policy course that was signaled at the December FOMC meeting.
Upcoming Policy Choices of the Administration Imparts Uncertainty onto Outlook for Monetary Policy
As we also outlined in our U.S. Economic Outlook, we have made some adjustments to our forecast for Fed policy this year. Previously, we had expected the FOMC would cut rates by 25 bps at each of its meetings in March, June and September. We now think the FOMC will keep its target range unchanged at 4.25%-4.50% until the second half of this year. We currently are forecasting a 25 bps rate cut at the September policy meeting followed by a similar-sized reduction in December (Figure 4). We then look for the Committee to remain on hold at 3.75%-4.00% throughout 2026.
That noted, the FOMC's policy actions in coming months will be dictated in part by policy choices, especially related to tariffs, that the Trump administration makes. Across-the-board tariffs on America's trading partners could lead to a modest rise in inflation this year. Higher inflation would erode growth in real income and weigh on growth in real consumer expenditures. The growth-slowing effects of tariffs could be exacerbated if foreign countries levy retaliatory tariffs on U.S. exports. The FOMC's response to any tariff-related effects on the U.S. economy will depend on how Committee members judge the risks to the achievement of their dual mandate (i.e., price stability and full employment). In short, the uncertainty at present that is related to the economic policy choices of the incoming administration imparts uncertainty onto the outlook for Fed policy.
QT: Expected End Date June 2025
We expect the upcoming FOMC meeting to include a preliminary discussion about the path ahead for the Federal Reserve's balance sheet runoff program, more commonly known as quantitative tightening (QT). QT has been ongoing since June 2022, when the Federal Reserve began reducing its holdings of Treasury securities and mortgage-backed securities (MBS) by up to $60 billion and $35 billion per month, respectively. These caps remained in place until June 2024, at which time the Committee reduced the cap for Treasury securities to $25 billion in an effort to slow, but not stop, the pace of balance sheet runoff. Those caps remain in place today.
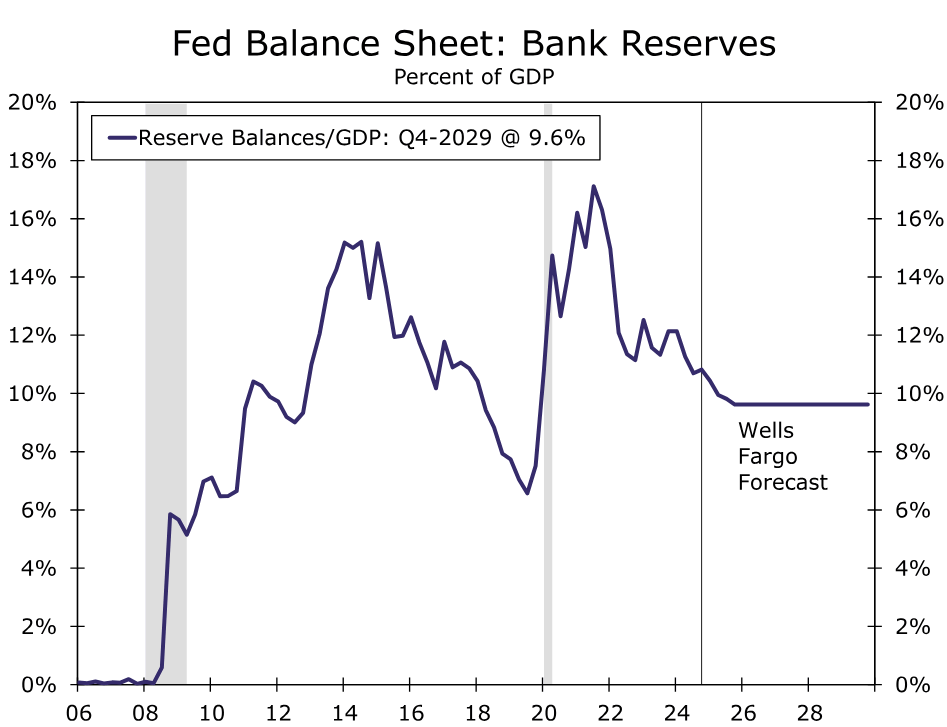
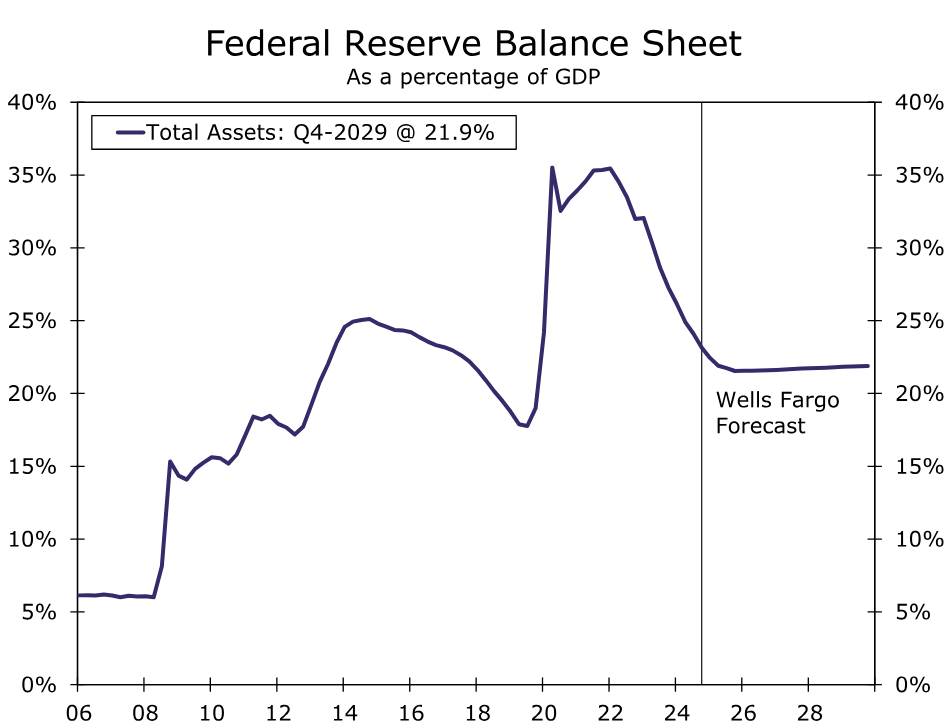
At present, the Federal Reserve's security holdings total $6.4 trillion, a $2 trillion decline from the central bank's peak holdings in 2022. The Federal Reserve's balance sheet has fallen even more as a share of GDP, declining from 35% at the peak to 23% today (Figure 5). This passive balance sheet runoff has been a secondary form of monetary policy tightening and likely has contributed to some modest upward pressure on longer-term interest rates, perhaps on the order of 20-40 bps or so.
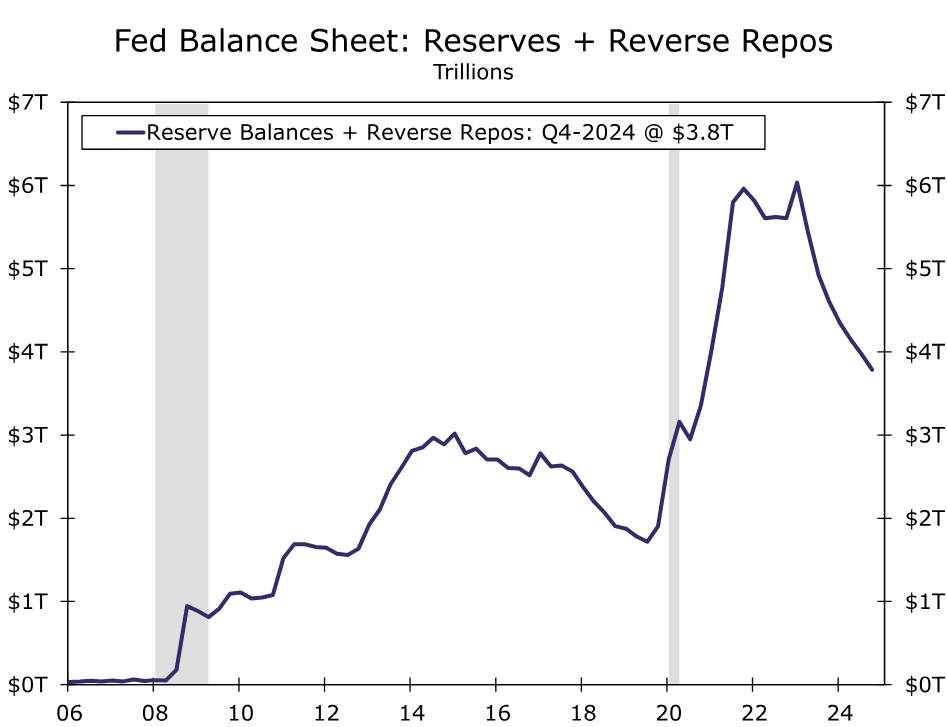
The upshot of the reduction in the Fed's security holdings has been a reduction in the abundant liquidity in the financial system. Cash parked at the Federal Reserve, whether from banks holding reserves or money market funds and other institutions utilizing reverse repurchase agreements, has declined considerably from its peak both in dollar terms and as a share of GDP (Figure 6). The Federal Reserve aims to maintain reserves that are "ample" enough such that the financial system operates smoothly but not so ample that its balance sheet is larger than is necessary.
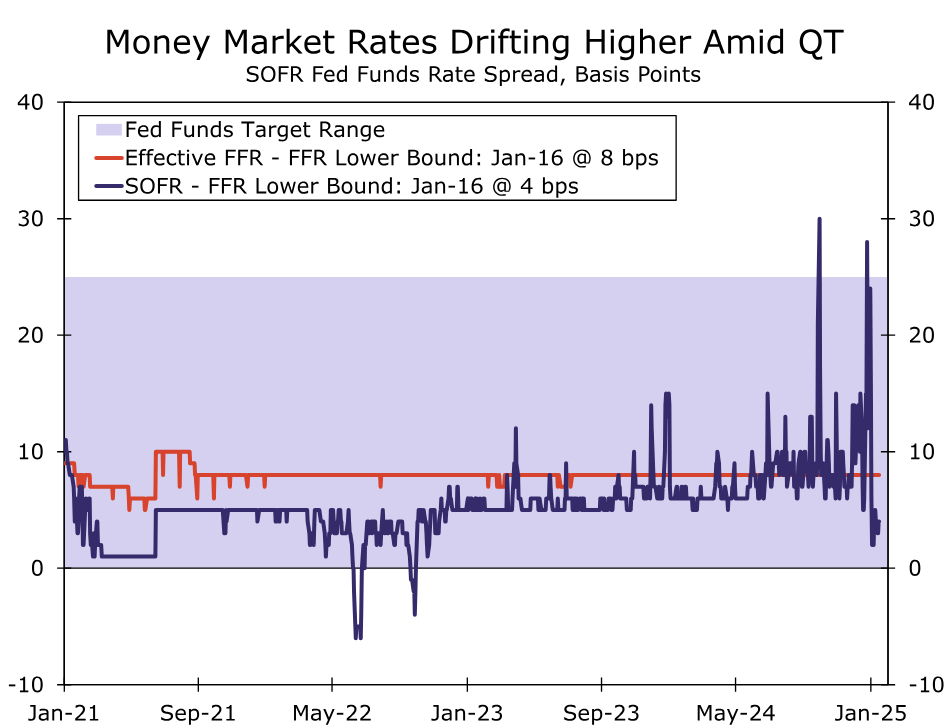
Identifying that Goldilocks zone of not-too-big and not-too-small involves a rigorous amount of analysis and monitoring. The Federal Reserve tracks a wide variety of indicators to assess the degree of scarcity for bank reserves. One key indicator is conditions in the market for Treasury repurchase agreements, also known as the Treasury repo market. Treasury repo transactions form the basis for the secured overnight financing rate (SOFR), a benchmark lending rate in the United States.
Because SOFR is an overnight financing rate like the federal funds rate, it generally fluctuates in the FOMC's target range for the federal funds rate. SOFR generally has traded near the bottom of the fed funds target range in recent years in a sign that reserves have been more than ample (Figure 7). SOFR has printed above the top end of the target range a couple of times in recent months, including year-end when balance sheet pressures in the financial system tend to be must acute. That said, the spikes generally have been short-lived and less volatile than what occurred in the last episode of QT from 2017–2019, and they have been well-shy of the more than 300 bps blowout that occurred in September 2019. Furthermore, the effective federal funds rate has remained very stable and well-within the FOMC's desired target range. Federal Reserve Bank of New York President John Williams recently stated he saw "no signs of disruption in the repo market" as a result of ongoing QT.
Given that balance sheet runoff has gone smoothly so far, we think the Committee is inclined to let balance sheet runoff continue for a bit longer than we previously believed. We now look for QT to continue at its current pace through the end of May. Starting in June, we expect the Federal Reserve to keep its balance sheet flat through at least the end of the year. Note that even if aggregate balance sheet runoff ceases, the composition can continue to evolve. We look for MBS runoff to continue past June indefinitely as the Federal Reserve strives to reduce its mortgage holdings and slowly return to holding primarily Treasury securities. In order to keep the total balance sheet unchanged amid ongoing MBS runoff, we look for the Federal Reserve to start buying Treasury securities such that they replace MBS paydowns one-for-one.