
Sample Category Title
NASDAQ (NQ): Two Scenarios That Show Perfect Setup For Traders
NASDAQ E-Mini Futures (NQ) appears to be extending the bullish sequence from October 2022. Will the sequence finish soon and lead to a big sell-off across the US indices? While the sequence persists, where should traders eye the next opportunity?
The NQ chart is very clear. After the markets recovered from Covid in March/April 2020, a massive bullish cycle followed. This rally continued until November 2021 and was identified as wave (I). From November 2021, a sell-off began to correct the Covid recovery cycle. The sell-off ended in November 2022 and was identified as wave (II). Wave (III) then started in October 2022 and has continued to rise since. The bullish cycle from October 2022 has gained over 105% from its low and lasted nearly 28 months. Further analysis shows this rally as wave I of (III). Therefore, wave (III) still has a long way to go.
When such a bullish sequence emerges, we prefer buying pullbacks in 3, 7, or 11 swings from the blue box. These blue boxes are shown on the chart for Elliottwave-Forecast members. Within the bullish sequence from October 2022, there have been multiple pullbacks. Members have profited from these. The most recent pullback occurred on August 5, 2024. As shown on the 8.4.2024 chart below, we bought at the extreme of this pullback.
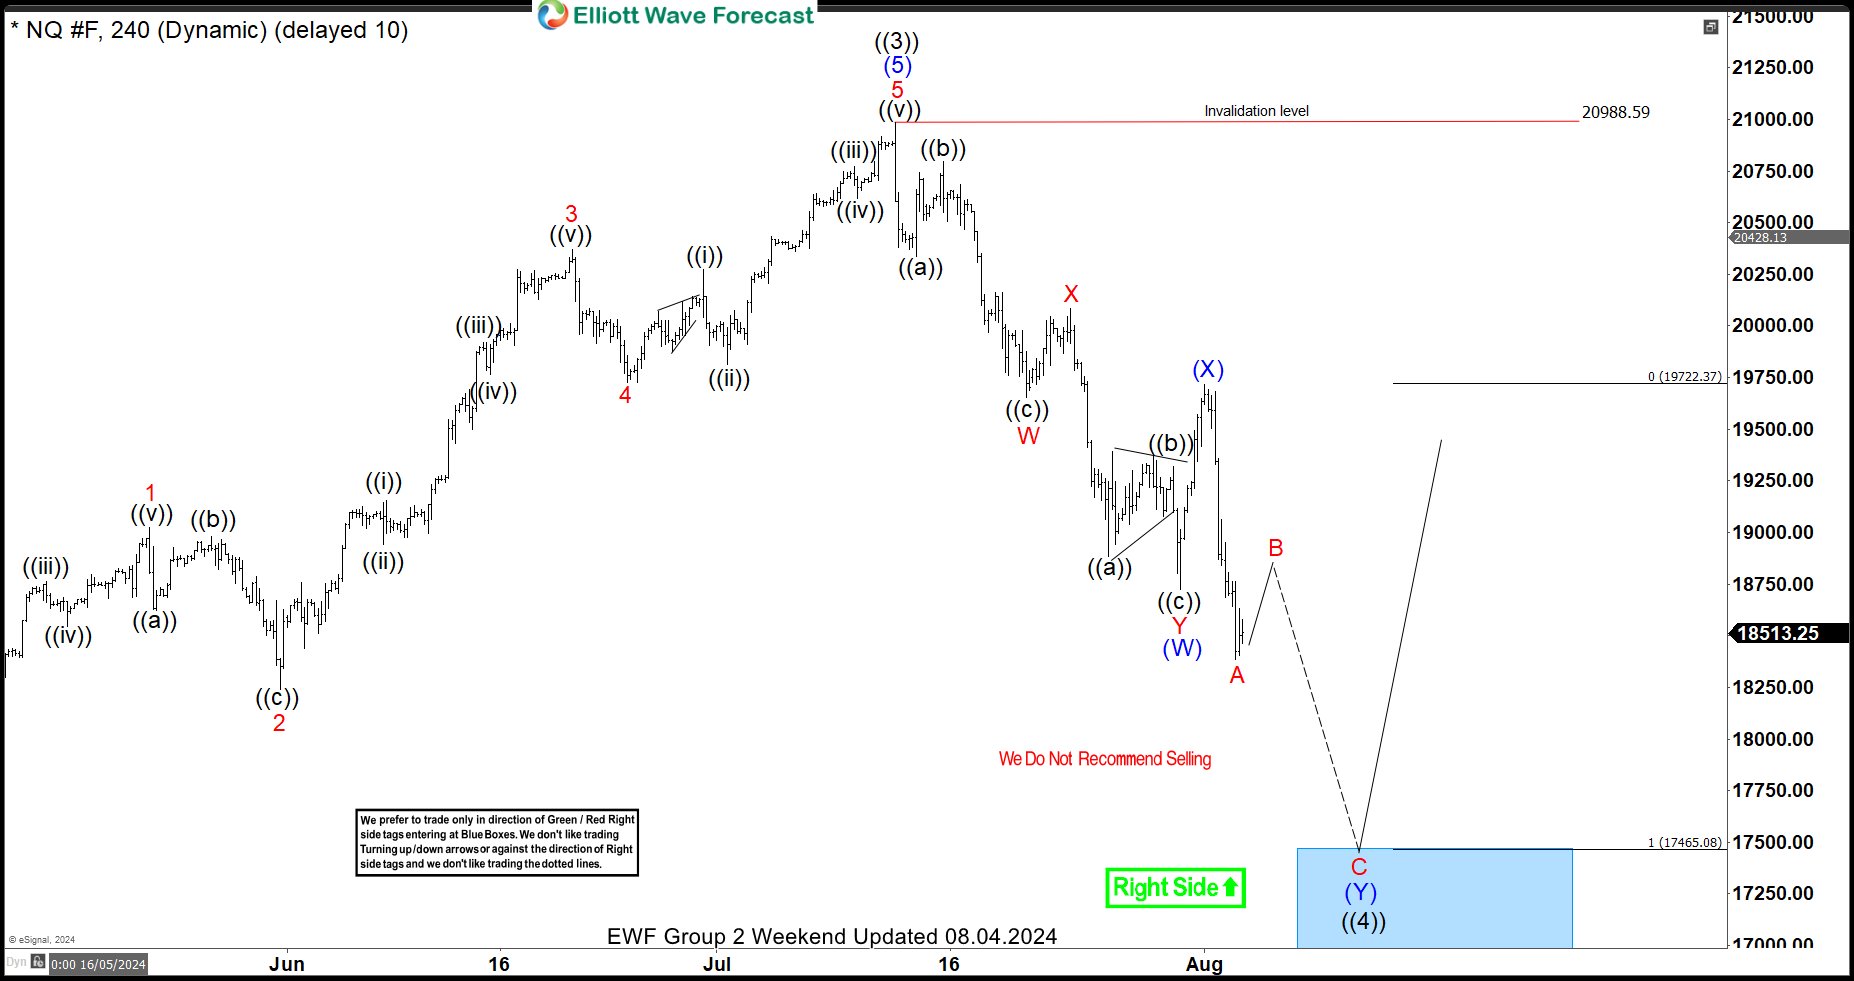
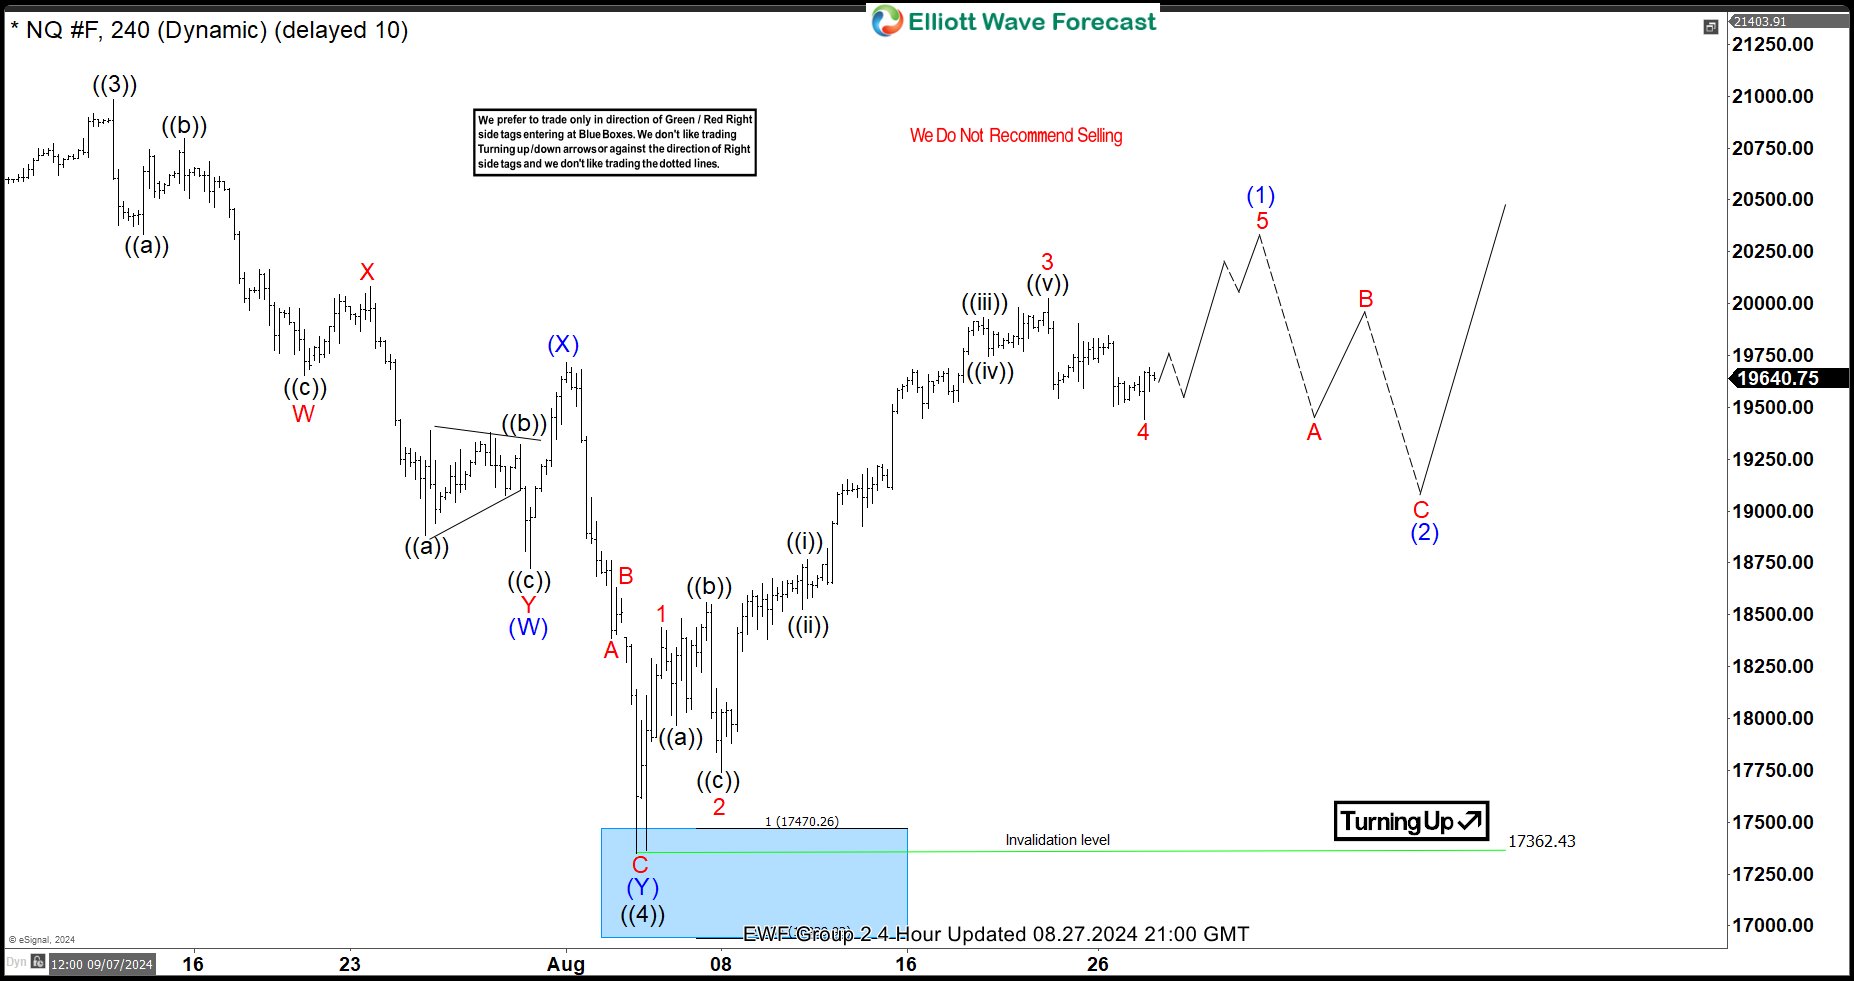
Price reached the blue box to conclude a 7-swing structure and then rallied from there. The 8.27.2024 chart below shows a later update we shared with members as we continue to provide update from this extreme area.
 From the blue box, NQ gained about 29% until the recent pullback from December 2024 started. Again, pullbacks within a bullish sequence should be a perfect opportunity for buyers to go again. What are the likely scenarios buyers should look forward to, for the next perfect blue box opportunity? This post will provide two best buying scenarios for traders.
NQ Elliott Wave Analysis – 1st Scenario. 01.21.2025 Update
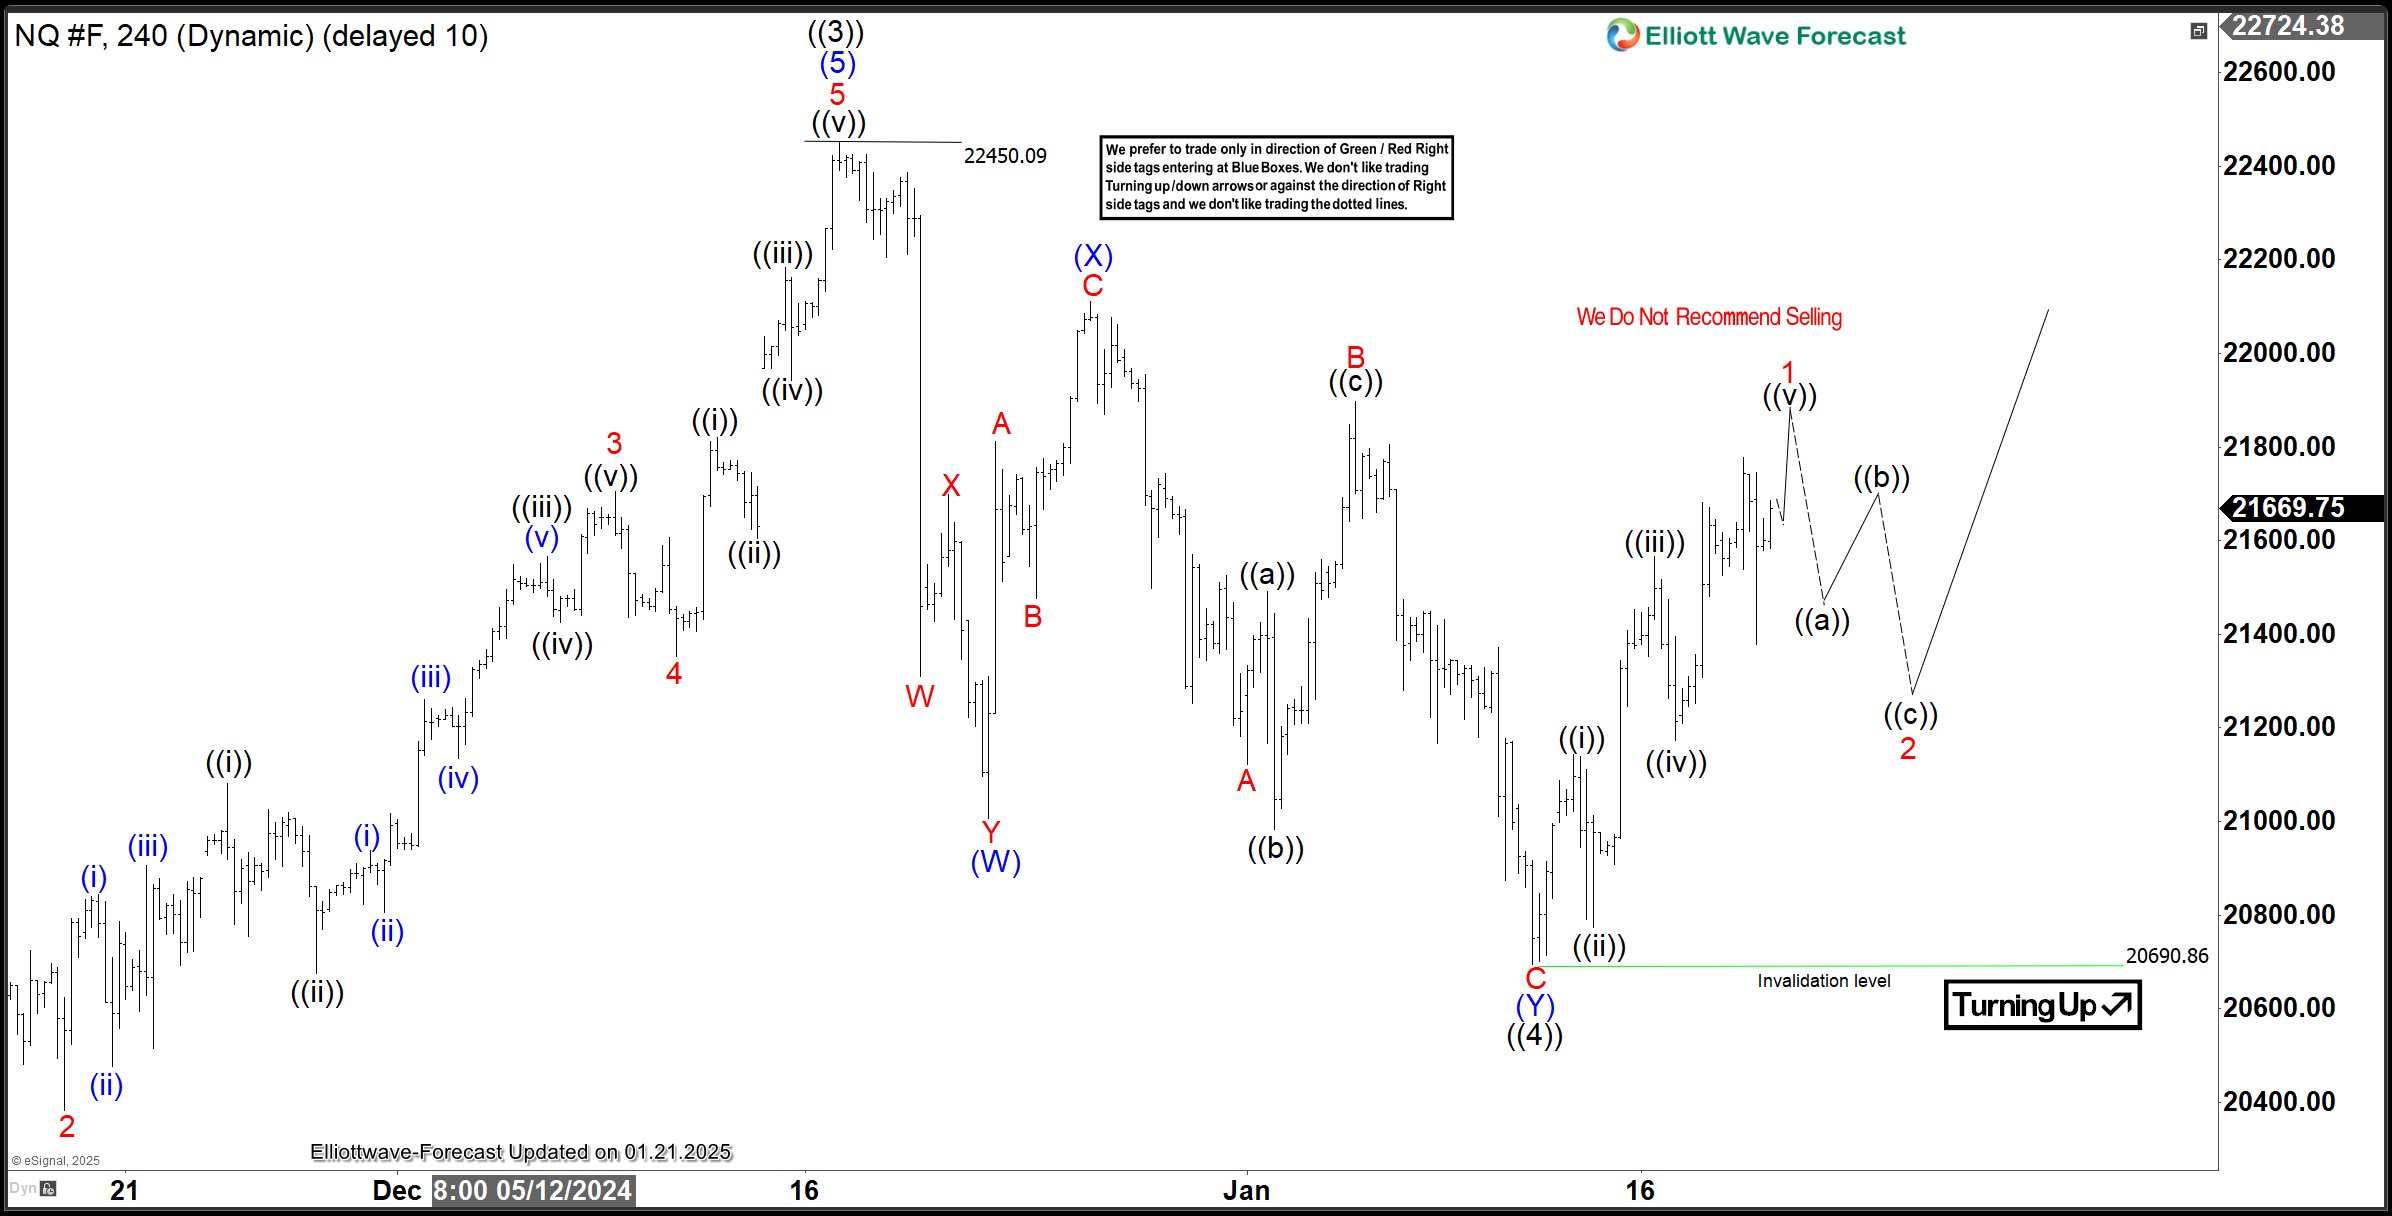
The NQ chart above shows that wave ((4)) of I ended on January 13, 2025, at 20,690. From this pullback low, wave ((5)) began to emerge. The price is now close to completing wave 1 of (1) of ((5)). A pullback for wave 2 should follow. The best entry was at the extreme of wave ((4)), but it was barely missed. The next opportunity will come after the price breaks above the December 2024 peak at 22,450 with wave 3. After this, buyers can wait for the next pullback. It could be for wave 4, wave ((ii)) of 3, or wave ((iv)) of 3 within the bullish sequence from January 13, 2025. This bullish setup depends on the price breaching the December 2024 high. But what if the price turns lower instead of breaking this high?
NQ Elliott Wave Analysis – 2nd Scenario. 01.21.2025 Update
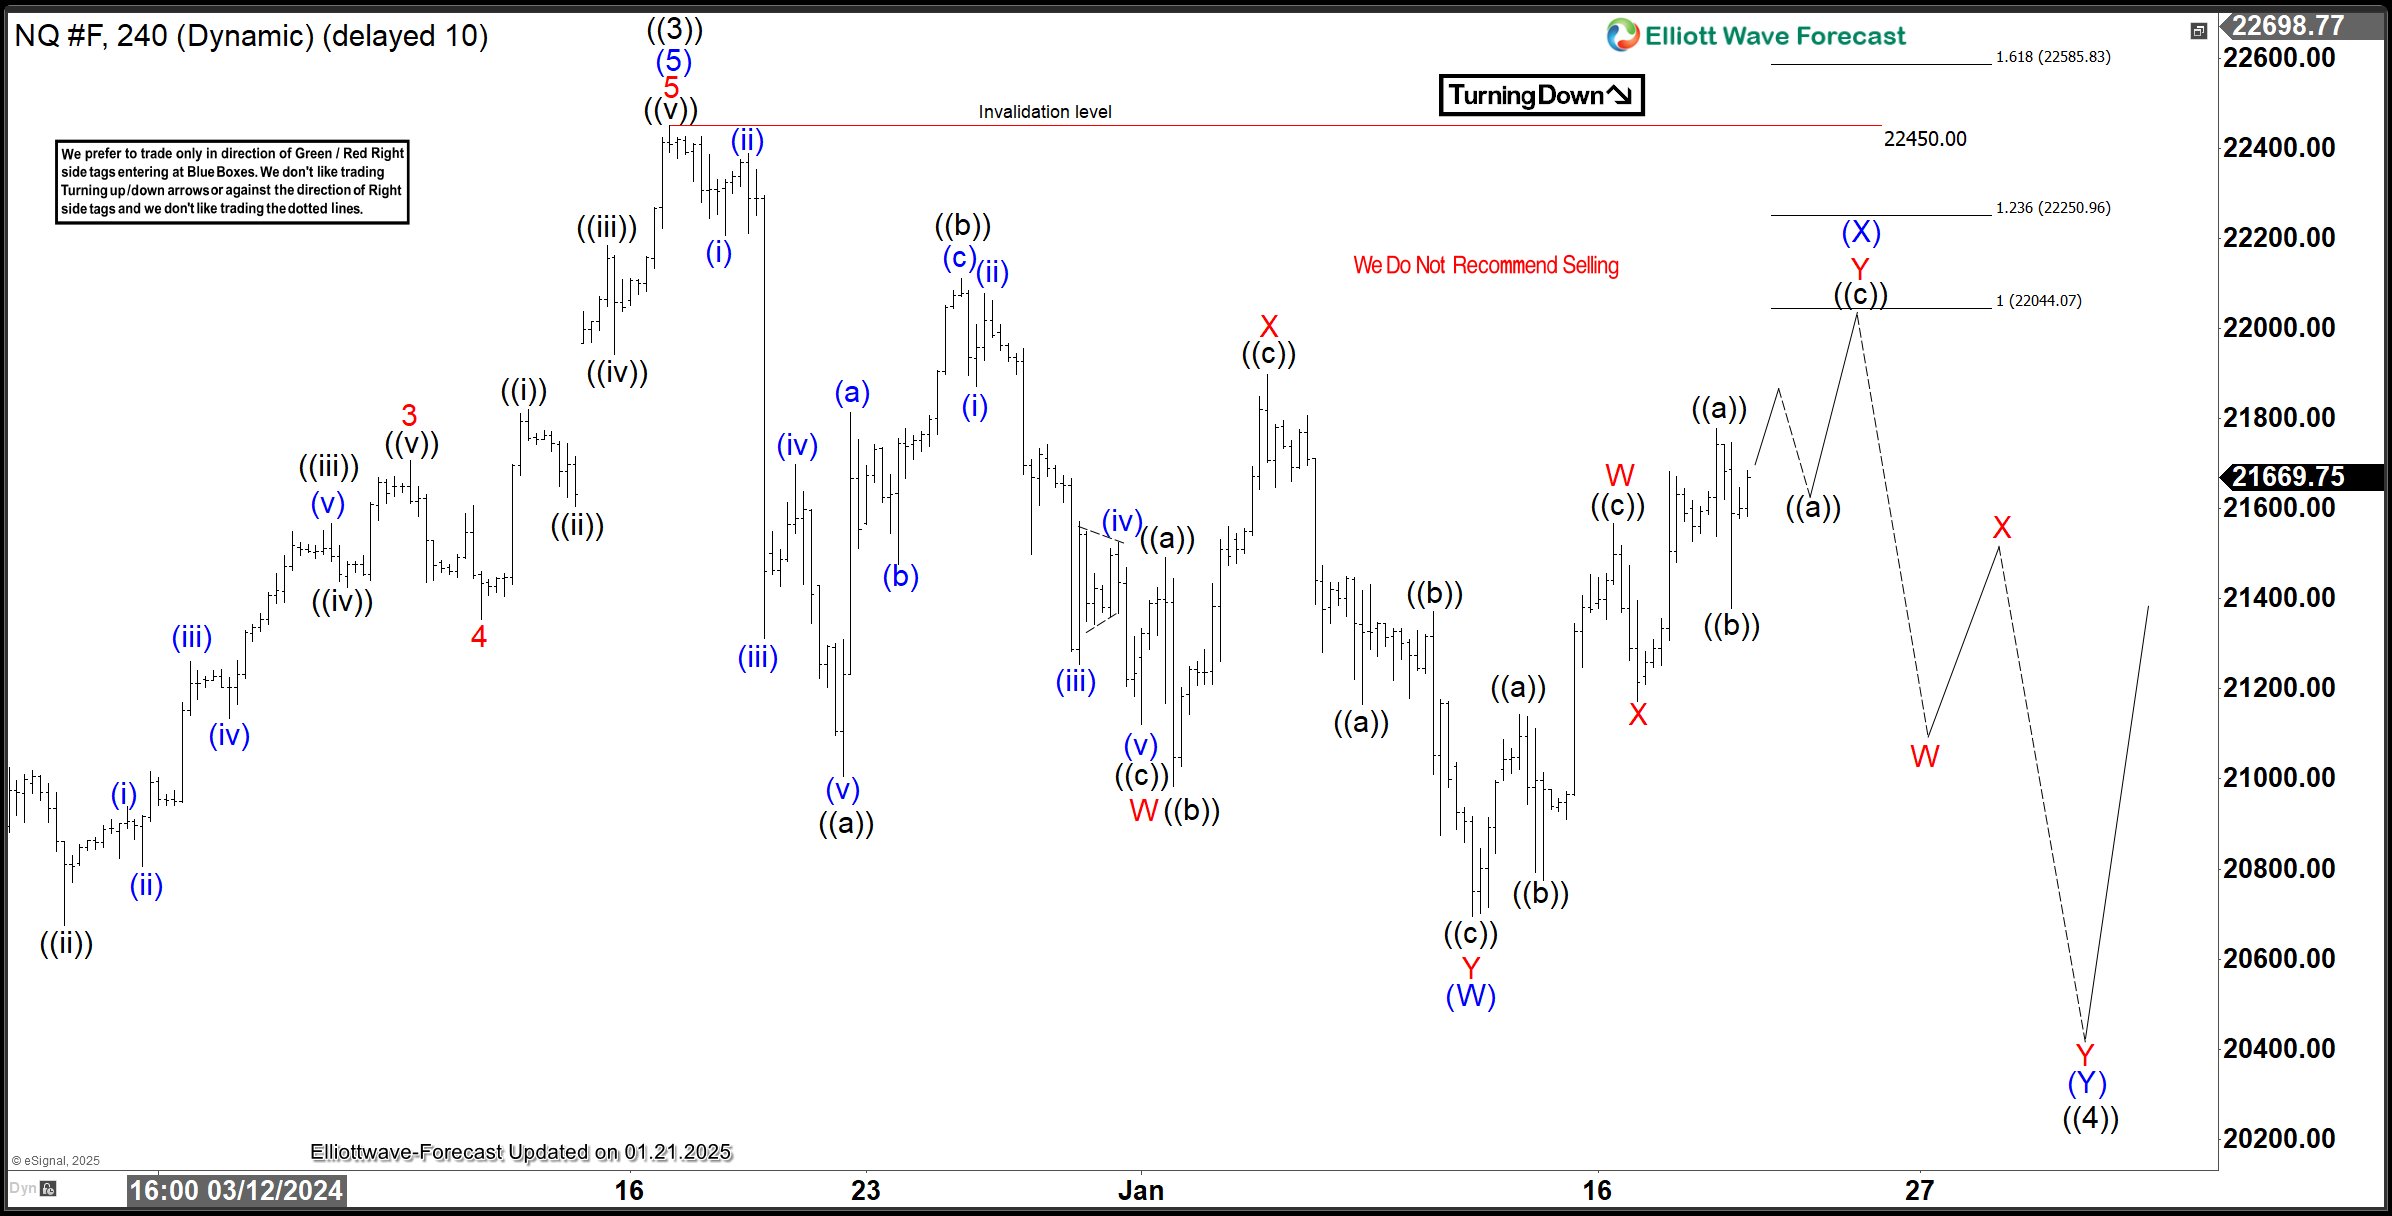
If the price doesn’t breach 22,450 to confirm the first scenario, it could fall further for a deeper wave ((4)). As the chart above shows, wave ((4)) could develop into a larger 7-swing structure. Wave (W) ended on January 13, 2025, where the current bounce for wave (X) began. Wave (X) may extend to 22,044.07–22,250.96. If the price turns lower from this zone or below it, buyers can watch for the next extreme of wave ((4)) for a perfect long entry. However, if the bounce breaches 22,450, this scenario becomes invalid, and the first scenario becomes valid. In either case, we have prepared our members to act. The strategy is simple: just buy from the blue box! You can also learn to trade from our blue box for just $0.99 for the next 14 days.
Crypto Market Took a Step Back But Unlikely to Turn Around
Market Picture
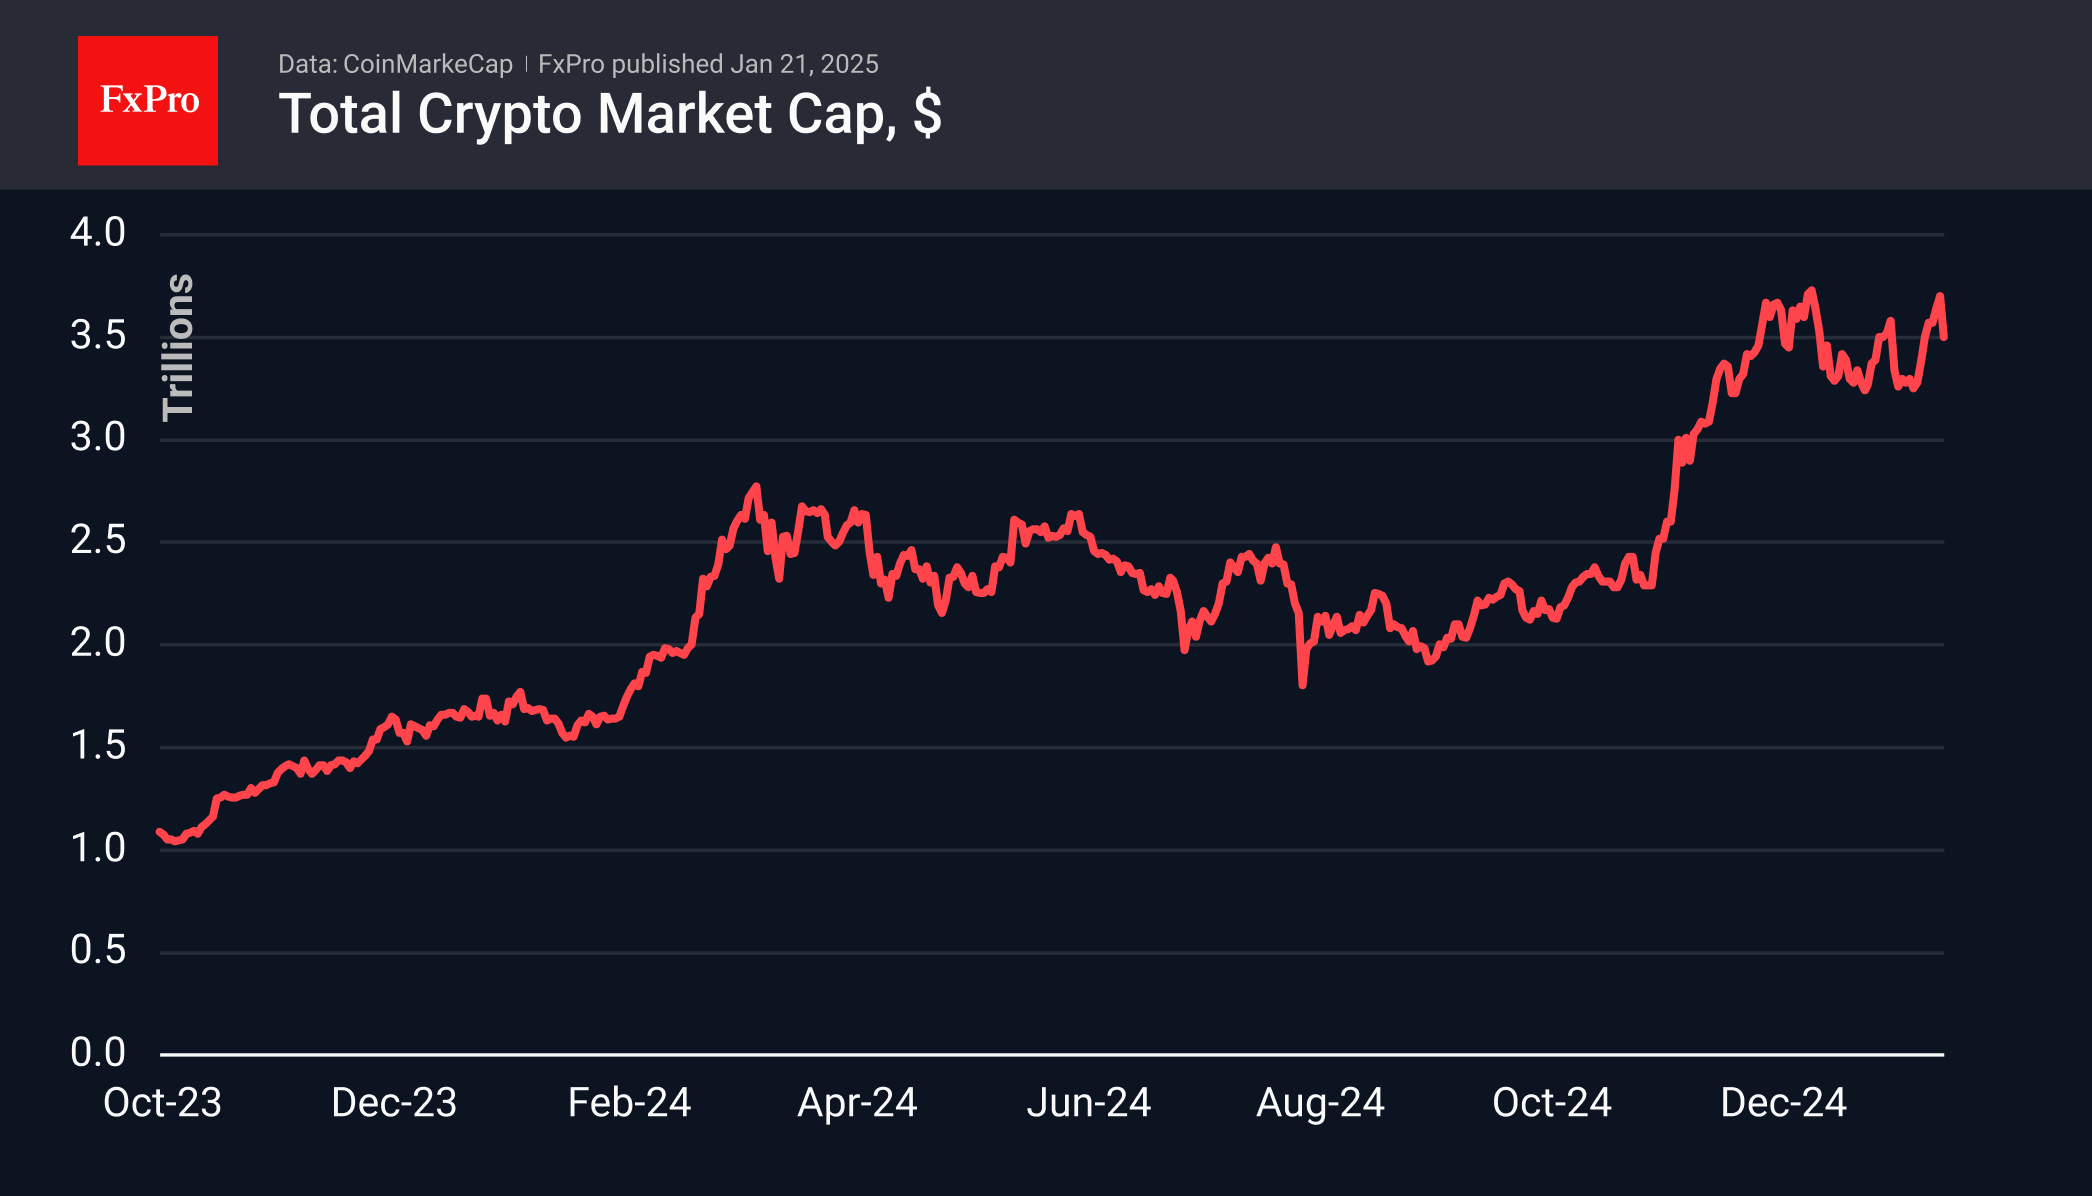
The cryptocurrency market experienced a decline, with a reduction of approximately 5.3% compared to the previous day. This downturn was attributed to high expectations surrounding Trump’s inauguration speech, which did not mention cryptocurrencies. Consequently, the total capitalisation of cryptocurrencies decreased to $3.5 trillion, reverting to the level observed at the end of the previous week. While this indicates a reduction in optimism, it does not suggest a market reversal.
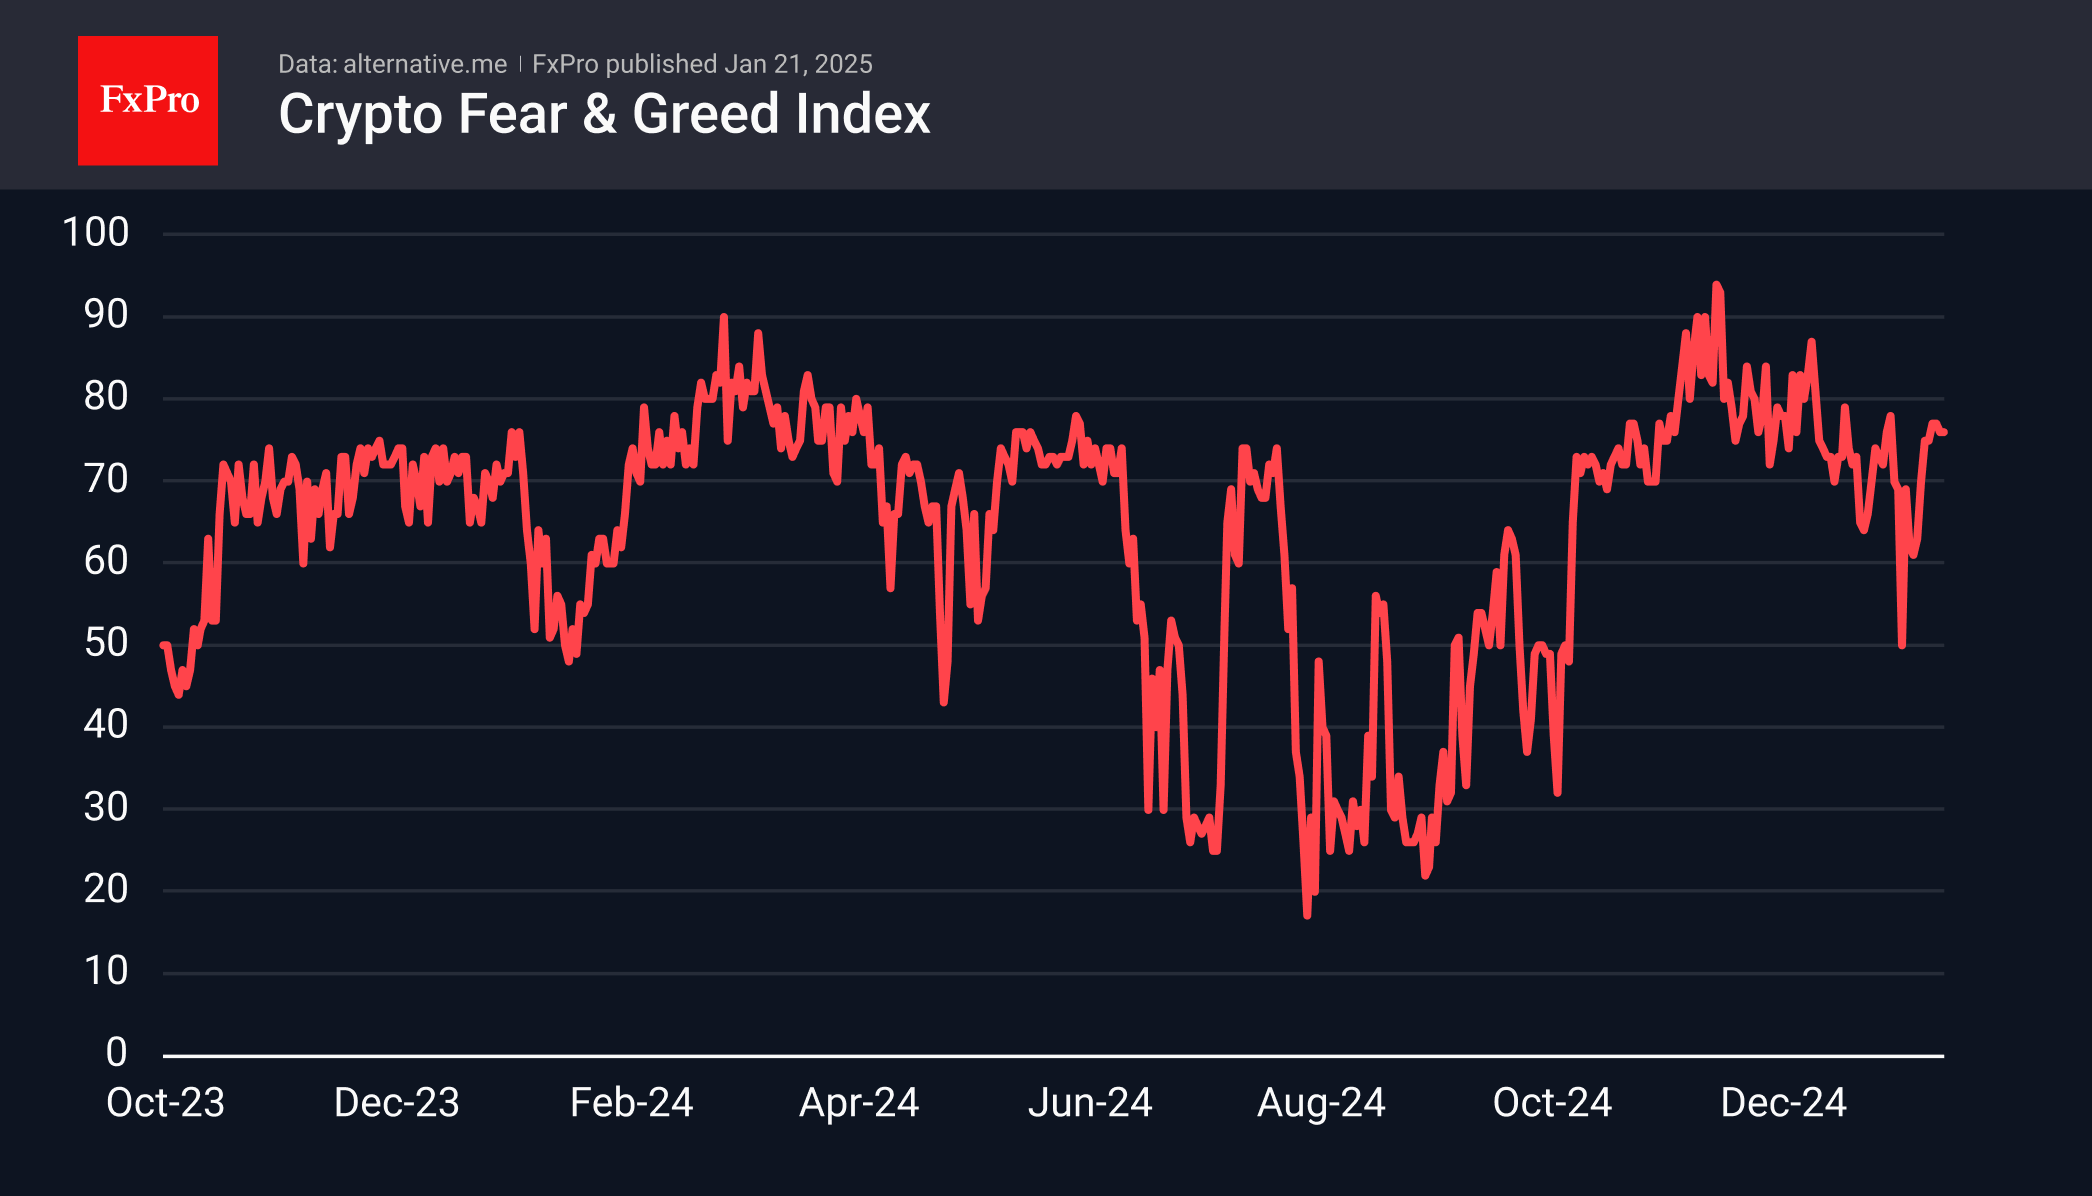
The Cryptocurrency Fear and Greed Index stands at 76, having ranged between 75 and 77 for six consecutive days. This is considered the initial stage of ‘extreme greed’. Observations indicate that during a bull market phase, values exceeding 80 increase the risk of a corrective pullback, whereas current values may coexist with further movement towards historical highs.
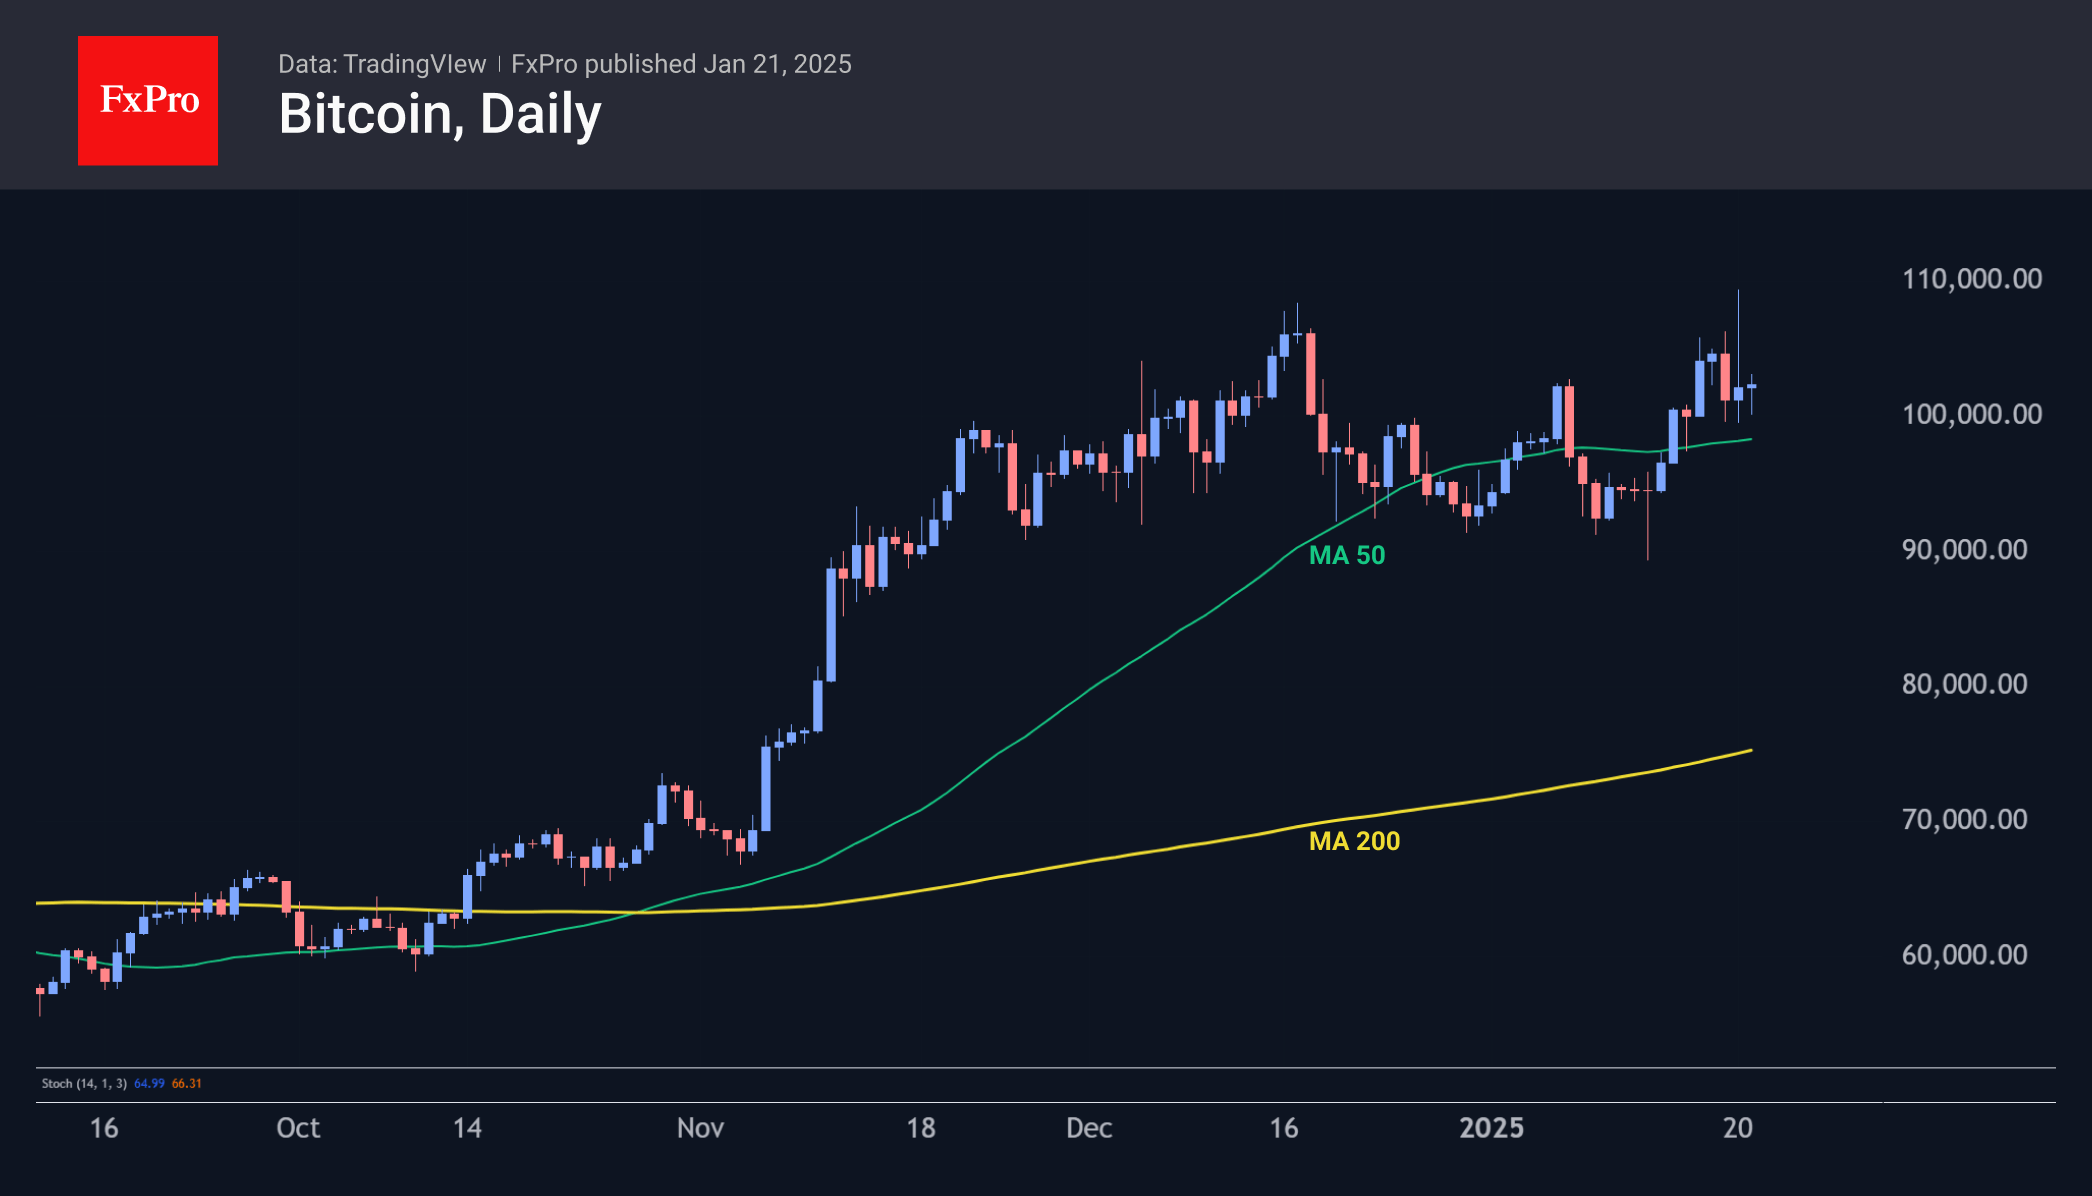
Bitcoin reached a new all-time high on Monday, approaching the $110k level. However, significant selling followed, resulting in a 9% pullback from the peak. By the start of trading in Europe, Bitcoin was trading near $102k. The resistance level observed on January 7th temporarily became support. It is anticipated that the market will progress gradually, overcoming one level after another.
Corrective pullbacks also impacted other major altcoins. Over the past 24 hours, Ethereum decreased by 4.3%, XRP fell by 5.8%, and Solana declined by 9.6%.
News Background
According to CoinShares, global investment in crypto funds increased 46 times last week to $2.195 billion, the highest in five weeks. Investments in Bitcoin rose by $1.903 billion, Ethereum by $246 million, XRP by $31 million, and Solana by $2.5 million.
The SEC reported a surge in applications to launch cryptocurrency ETFs in the US, with more than a dozen applications submitted by major management companies in recent days.
Following the change of administration in the US, MN Consultancy founder Michael van de Poppe highlighted significant growth potential in three categories of crypto assets: cryptocurrencies previously classified as securities by the SEC, including XRP, Matic, and Algorand; coins from World Liberty Financial’s portfolio, such as Chainlink and Aave; and Ethereum ecosystem projects.
On Polymarket, a prediction platform, voting on creating the Bitcoin reserve within the first 100 days of Trump’s presidency indicated a shift in sentiment. The odds of a favourable outcome decreased from 48% to 29% in less than 24 hours.
EUR/USD: Limited Recovery Suggests Larger Bears Hold Grip
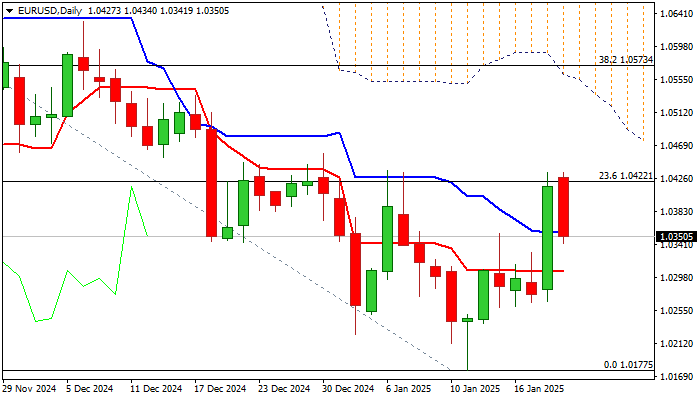
EURUSD fell on Tuesday morning, erasing about a half of Monday’s 1.3% rally, sparked by decision of President Trump to keep tariffs on hold, against initial plan to impose them from the day one.
A breather in the larger downtrend seems to be short lived so far, as correction was minor and capped by solid barrier provided by Fibo 23.6% of 1.1214/1.0177 (1.0422) where recent recovery attempts were repeatedly capped.
Overall technical picture is predominantly bearish and signal that larger bears are likely to regain full control after current consolidation phase, as falling daily cloud (spanned between 1.0555 and 1.0690) continues to weigh on price action
Formation of 100/200DMA death cross adds to negative signals, along with south-heading RSI, which slid under neutrality territory.
Near term bias is expected to remain with bears while the action stays capped under Fibo barrier (1.0422).
Fundamental situation is not bright for Euro as bloc’s economy is struggling to get into recovery track, persisting political tremors continue to undermine and arrival of Donald Trump posses the biggest challenge for the Eurozone.
Threat of tariffs on all EU exports to the US, due to US trade deficit with EU, which Trump wants to erase, is serious problem for EU which tries to find the way strengthen ties with US and avoid the worst scenario, while fighting with high energy prices and contributions to the war in Ukraine.
Extended consolidation should be likely near-term scenario, with price action to remain within current range (stronger upticks to stall under the base of falling daily cloud), before larger downtrend off 2024 peak (1.1214) resumes.
Res: 1.0422; 1.0478; 1.0534; 1.0555.
Sup: 1.0305; 1.0260; 1.0224; 1.0200.
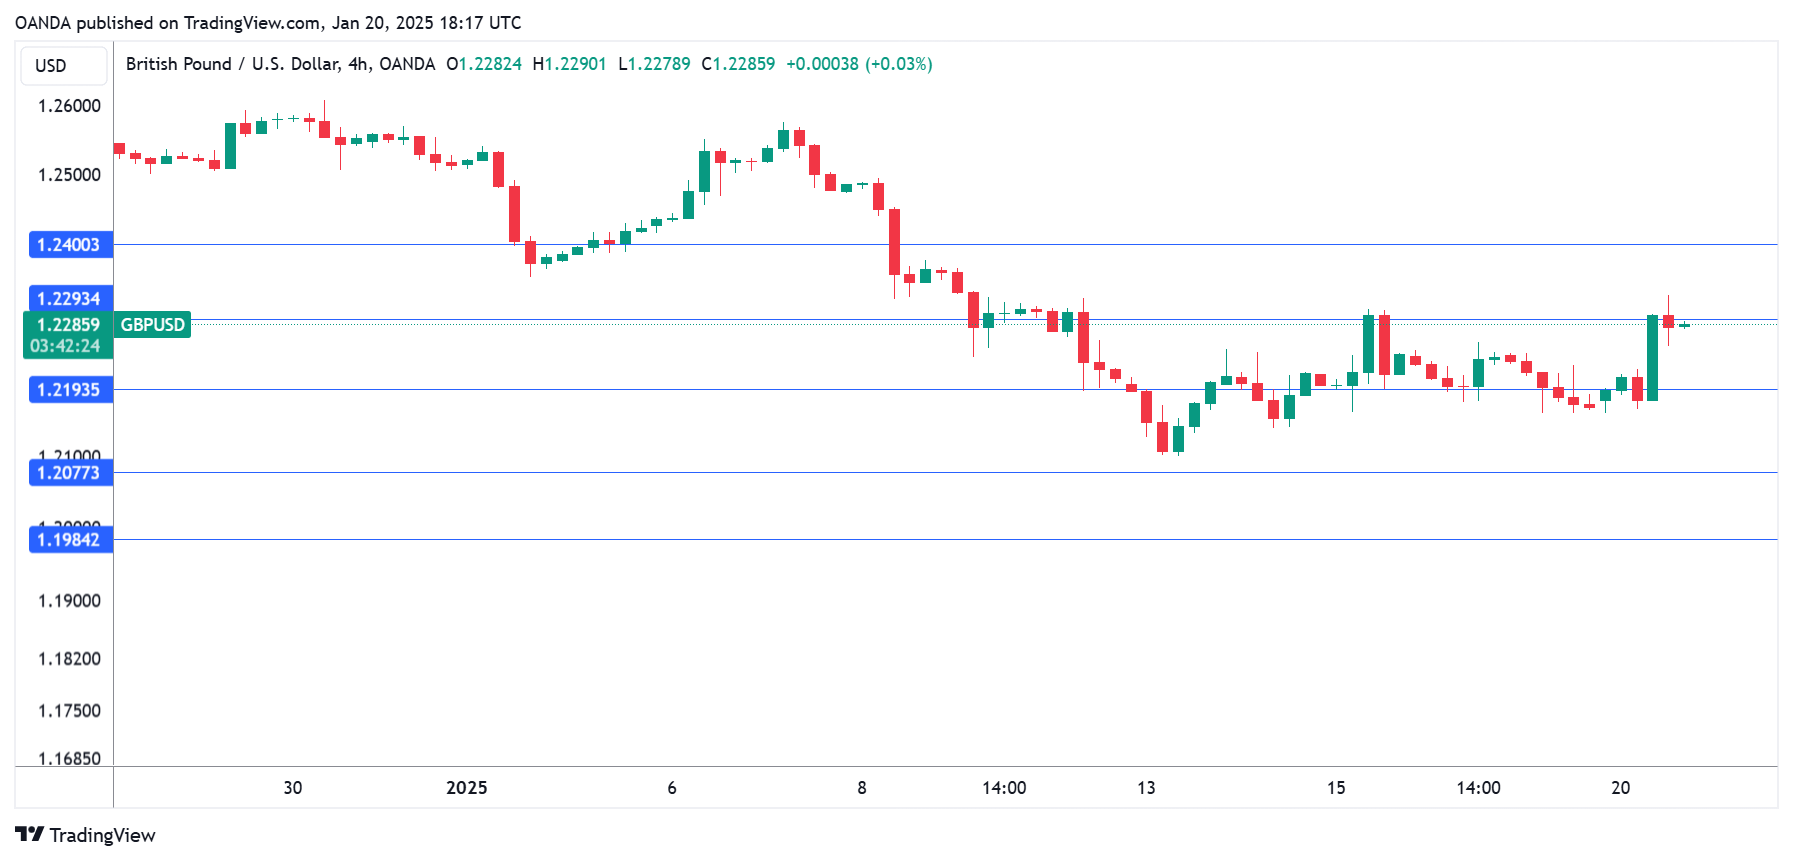
Pound Slips as UK Payrolls Slide
The British pound continues to show sharp swings this week. After a spectacular 1.3% gain on Monday, GBP/USD has reversed directions and is trading at 1.2233 in the European session, down 0.68% on the day.
UK payrolls slump, wage growth climbs
The UK payrolls report, a reliable indicator of employment growth, showed a sharp decline of 47 thousand m/m in December 2024. This was the largest decline since Nov. 2020 and follows a revised -32 thousand in November. The back-to-back declines are a result of the government’s new payroll taxes in the budget, which is causing businesses to release workers. Wage growth (excluding bonuses) remains hot and increased to 5.6% in December, in line with the market estimate and higher than the 5.2% gain in November.
While the weak employment data will be a headache for the UK government, it supports the case for the Bank of England to cut interest rates in order to kick-start the flagging economy. The BoE held rates in December and meets next on Feb. 6, with a quarter-point cut priced in at 85%. Inflation has remained sticky and the jump in wage growth is a reminder of the upside risk of inflation. The BoE may be looking at rate cuts in the coming months but it will have to do so cautiously, ever mindful of inflation.
In the US, the strong nonfarm payrolls report for December is raising the possibility that the easing cycle may be over. The Bank of America doesn’t expect any rate cuts in 2025 and says the risks for the next move are tilted towards a hike. The Fed started the easing cycle with a bang in September 2024, chopping rates by a half-point, but the strong economy means Fed policy makers may have to consider rate hikes in 2025.
GBP/USD Technical
- GBP/USD has pushed below support at 1.2278. and is putting pressure on support at 1.2211
- 1.2395 and 1.2462 are the next resistance lines
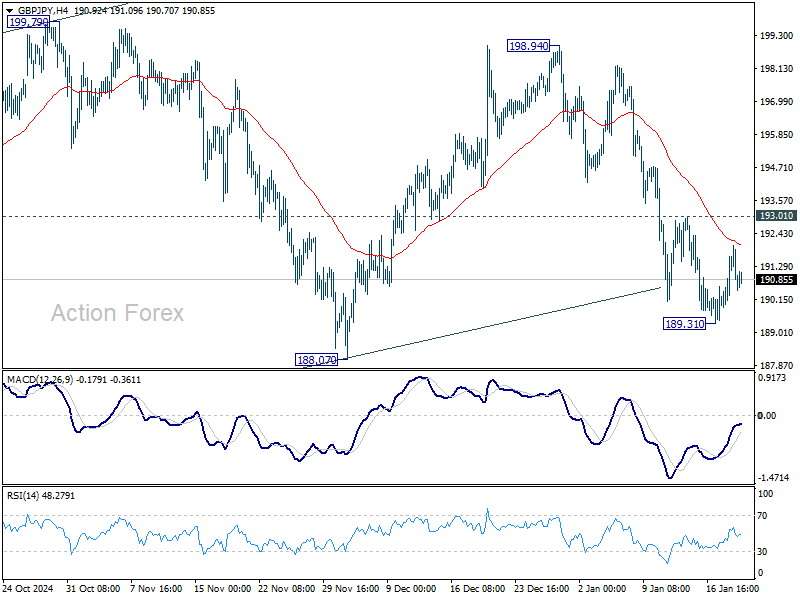
GBP/JPY Daily Outlook
Daily Pivots: (S1) 190.52; (P) 191.27; (R1) 192.65; More...
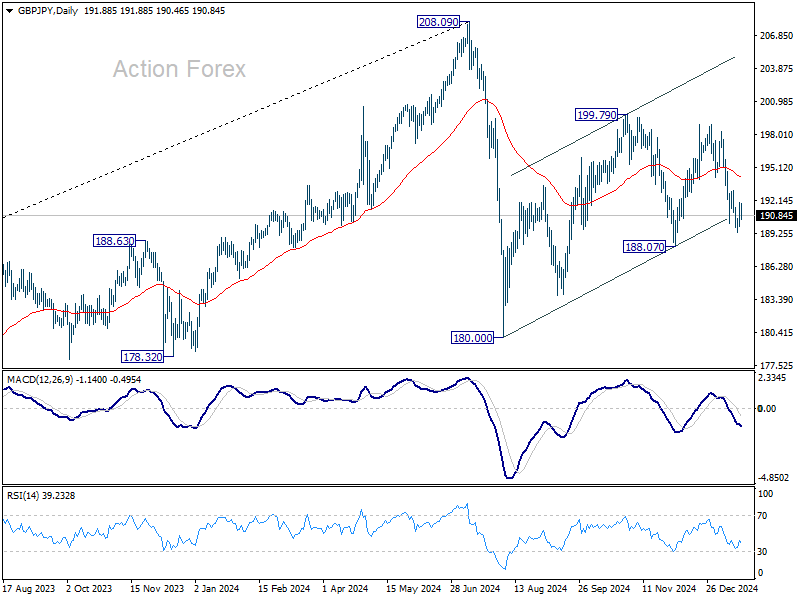
Intraday bias in GBP/JPY stays neutral for consolidations above 189.31 temporary low. Risk will stay on the downside as long as 193.01 resistance holds. On the downside, below 189.31 will target 188.07 support. Firm break there will argue that corrective pattern from 180.00 has finished too, and larger decline from 208.09 might be ready to resume.
In the bigger picture, price actions from 208.09 are seen as a correction to whole rally from 123.94 (2020 low). The range of consolidation should be set between 38.2% retracement of 123.94 to 208.09 at 175.94 and 208.09. However, decisive break of 175.94 will argue that deeper correction is underway.
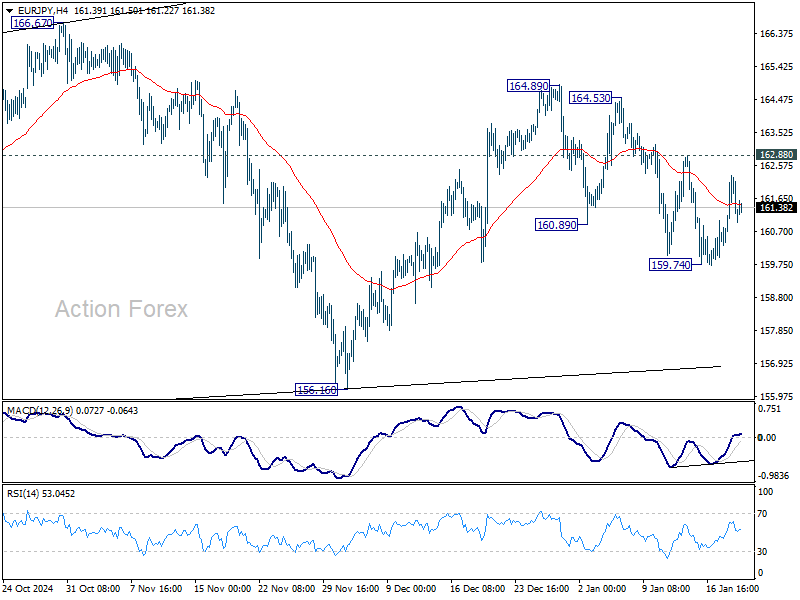
EUR/JPY Daily Outlook
Daily Pivots: (S1) 160.85; (P) 161.59; (R1) 162.85; More...
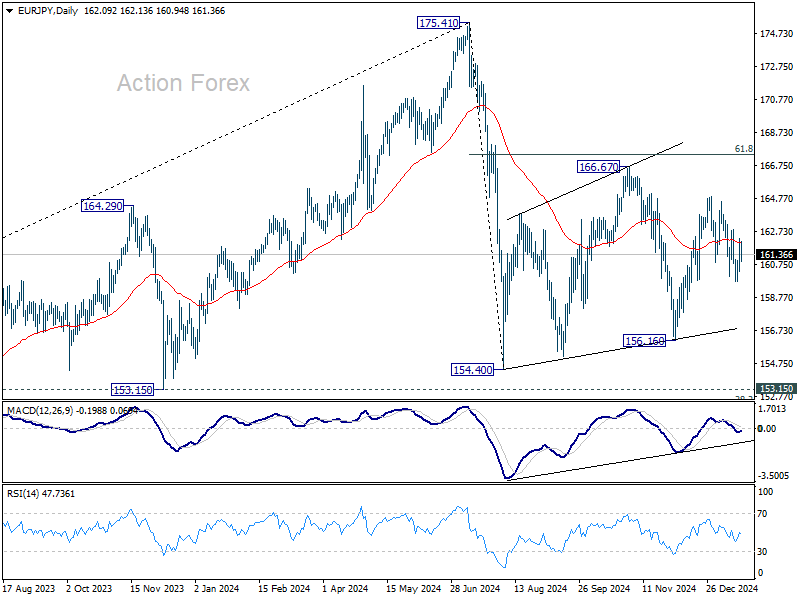
Intraday bias in EUR/JPY remains neutral at this point. Recovery from 159.74 might extend, but further decline will remain in favor as long as 162.88 resistance holds. On the downside, below 159.74 will target 156.16 support. On the upside, however, break of 162.88 will bring retest of 164.89 instead.
In the bigger picture, price actions from 175.41 are seen as correction to rally from 114.42 (2020 low). The range of consolidation should have been set between 38.2% retracement of 114.42 to 175.41 at 152.11 and 175.41 high. However, decisive break of 152.11 would argue that deeper correction is underway.
EUR/GBP Daily Outlook
Daily Pivots: (S1) 0.8433; (P) 0.8453; (R1) 0.8470; More...
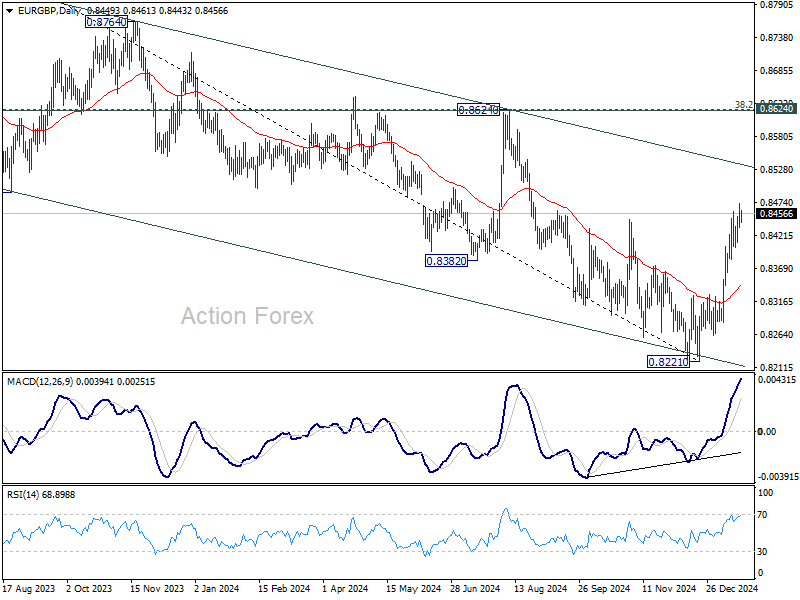
Intraday bias in EUR/GBP remains on the upside at this point. Rise fro 0.8221 is in progress for 0.8624 key cluster resistance zone. For now, outlook will remain bullish as long as 0.8403 support holds, in case of retreat.
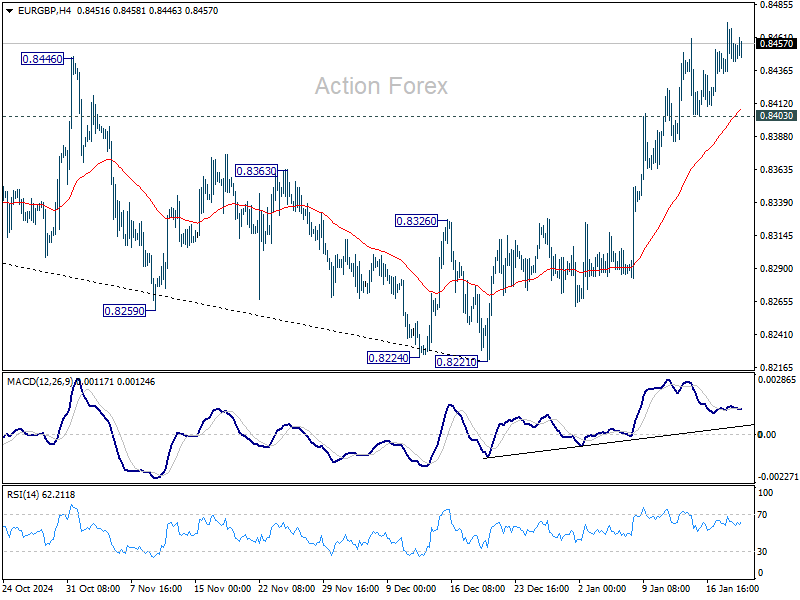
In the bigger picture, a medium term bottom was formed at 0.8221, just ahead of 0.8201 key support (2022 low). But outlook will be neutral as best as long as 0.8624 cluster resistance (38.2% retracement of 0.9267 to 0.8221 at 0.8621) holds. That is, larger down trend from 0.9267 (2022 high) might still extend lower. However, decisive break of 0.8621/4 should confirm trend reversal and turn outlook bullish.
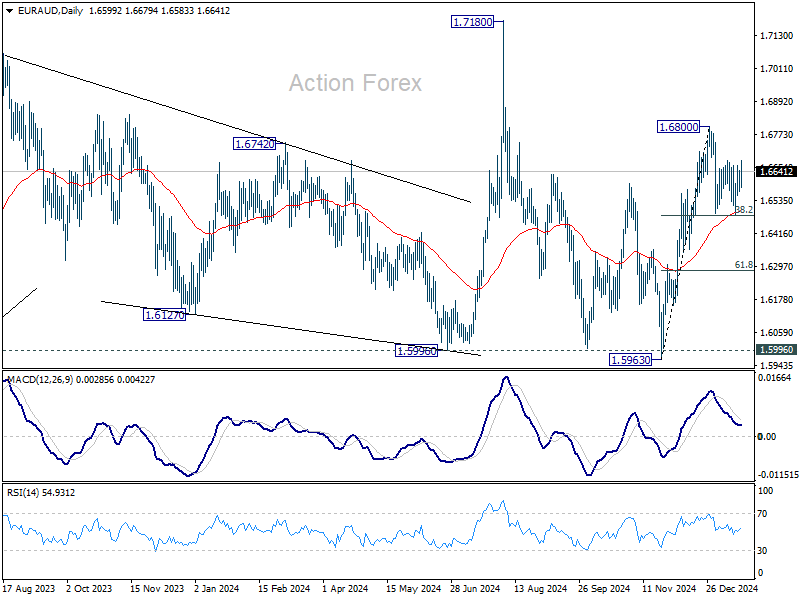
EUR/AUD Daily Outlook
Daily Pivots: (S1) 1.6566; (P) 1.6606; (R1) 1.6641; More...
No change in EUR/AUD's outlook and intraday bias stays neutral. Strong support is still expected from 38.2% retracement of 1.5963 to 1.6800 at 1.6480 to contain downside. On the upside, firm break of 1.6800 will resume the rally from 1.5963. However, sustained break of 1.6480 will bring deeper correction 61.8% retracement at 1.6283 instead.
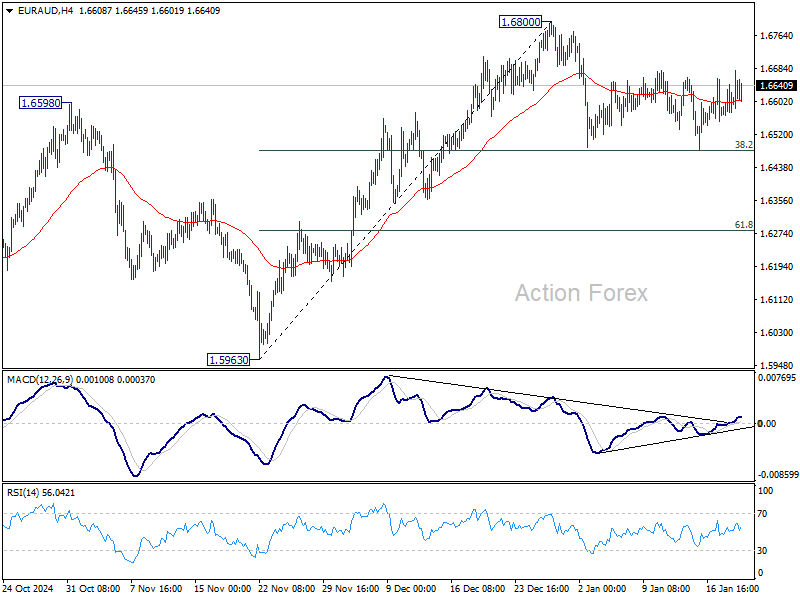
In the bigger picture, EUR/AUD is holding on to 1.5996 key support despite brief breach. Larger up trend from 1.4281 (2022 low) is still in favor to resume through 1.7180 at a later stage. Nevertheless, sustained break of 1.5995 will indicate that such up trend has completed and deeper decline would be seen.
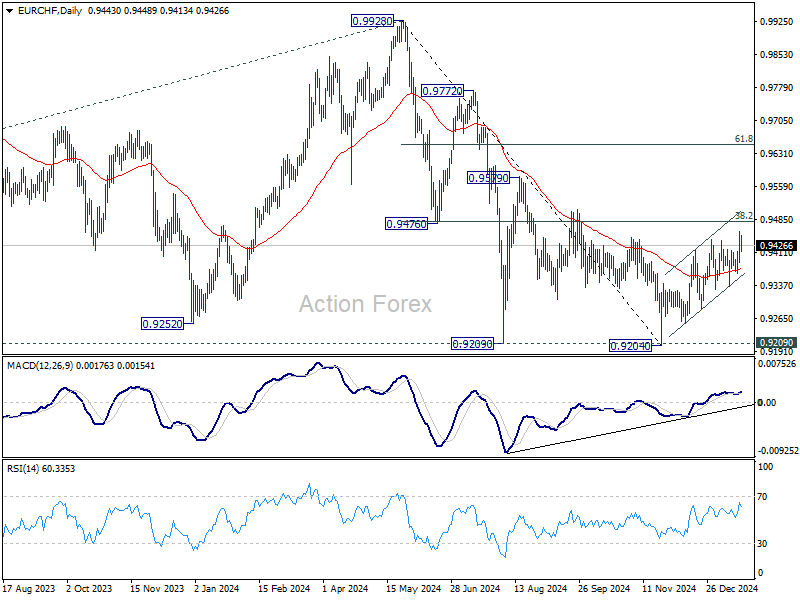
EUR/CHF Daily Outlook
Daily Pivots: (S1) 0.9405; (P) 0.9432; (R1) 0.9472; More....
Intraday bias in EUR/CHF is back on the upside with breach of 0.9440. However, strong resistance is expected from 0.9481 fibonacci level to complete the corrective rebound from 0.9204. On the downside, below 0.9365 minor support will turn bias to the downside for 0.9336 support first. Firm break of 0.9336 will argue that the correction has completed.
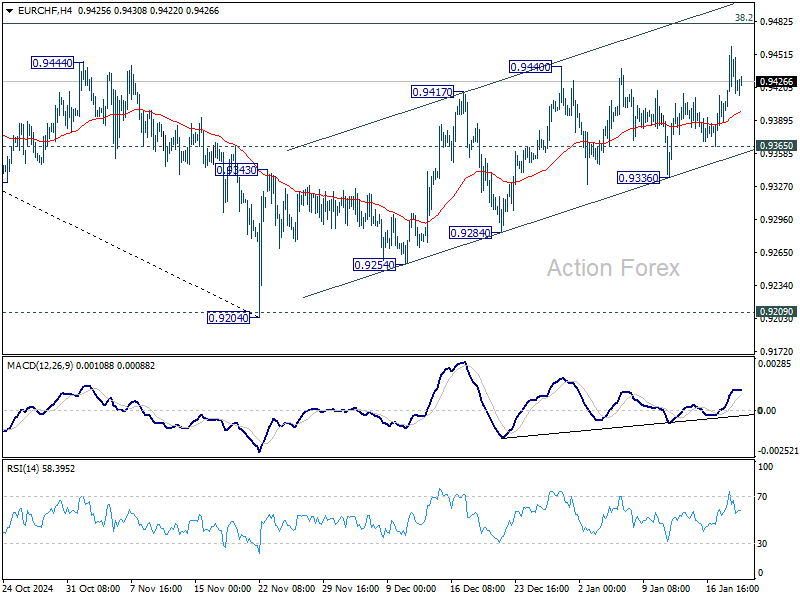
In the bigger picture, while corrective rebound from 0.9204 might extend higher, strong resistance could be seen from 38.2% retracement of 0.9928 to 0.9204 at 0.9481 to limit upside. Down trend from 0.9928 (2024 high) is still in favor to resume through 0.9204/9 support zone at a later stage. However, strong break of 0.9481 will raise the chance of medium term bottoming, and bring further rally back to 61.8% retracement at 0.9651.
USD/CAD Daily Outlook
Daily Pivots: (S1) 1.4219; (P) 1.4353; (R1) 1.4444; More...
Intraday bias in USD/CAD is turned neutral first after the volatile moves in the last 24 hours. Further rise is expected as long as 1.4260 support holds. Break of 1.4516 will resume larger up trend to 1.4667/89 key resistance zone. Nevertheless, firm break of 1.4260 will turn bias to the downside for deeper pullback to 55 D EMA (now at 1.4203) and below.

In the bigger picture, up trend from 1.2005 (2021) is in progress for retesting 1.4667/89 key resistance zone (2020/2015 highs). Decisive break there will confirm long term up trend resumption. Next target is 100% projection of 1.2401 to 1.3976 from 1.3418 at 1.4993. Medium term outlook will remain bullish as long as 1.3976 resistance turned holds (2022 high), even in case of deep pullback.
