Sample Category Title
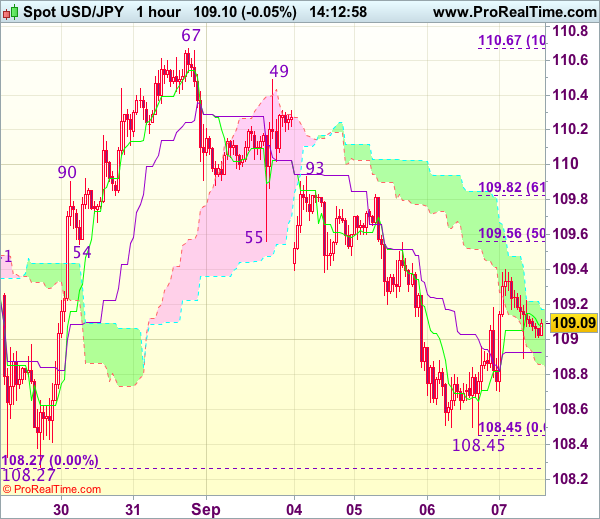
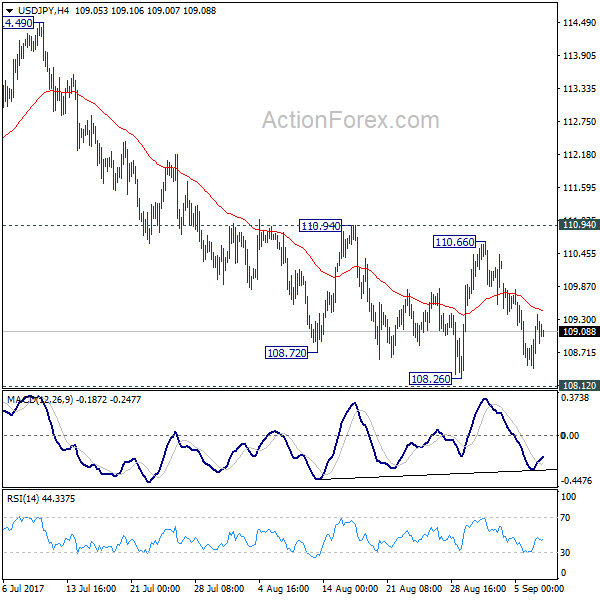
Trade Idea : USD/JPY – Sell at 109.55
USD/JPY - 109.10
Most recent candlesticks pattern : N/A
Trend : Sideways
Tenkan-Sen level : 109.08
Kijun-Sen level : 108.93
Ichimoku cloud top : 109.17
Ichimoku cloud bottom : 108.86
Original strategy :
Sell at 109.55, Target: 108.55, Stop: 109.90
Position : -
Target : -
Stop : -
New strategy :
Sell at 109.55, Target: 108.55, Stop: 109.90
Position : -
Target : -
Stop : -
Dollar’s rebound after falling to 108.45 yesterday suggests consolidation above this level would be seen and corrective bounce to 109.40 is likely, however, reckon upside would be limited to 109.55-60 (50% Fibonacci retracement of 110.67-108.45) and bring another decline, below said support at 108.45 would extend weakness towards last week’s low at 108.27 but break there is needed to retain bearishness and extend the fall from 114.50 to another previous chart support at 108.13, having said that, the greenback needs to penetrate this chart support to confirm early selloff from 118.66 has resumed for subsequent weakness to 107.70-75 which is likely to hold from here.
In view of this, we are looking to sell dollar on further subsequent recovery as 109.55-60 should limit upside and bring another decline later. Above 109.82-83 (61.8% Fibonacci retracement of 110.67-108.45 and previous resistance) would abort and signal low is formed instead, bring a stronger rebound to 110.00-05 but price should falter well below resistance at 110.49.
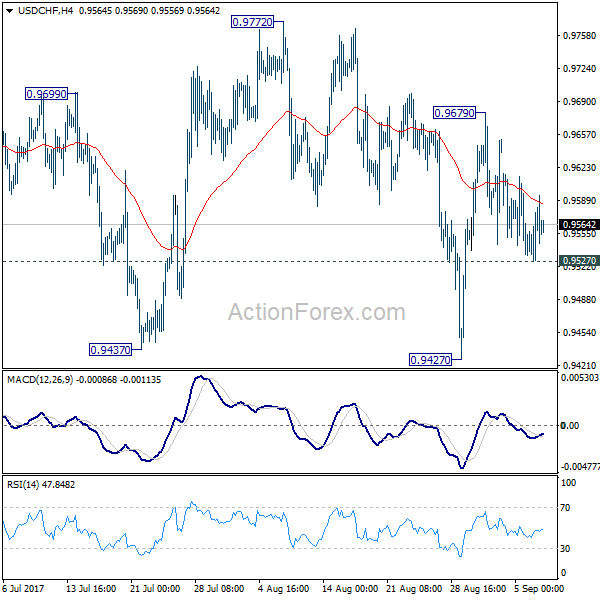
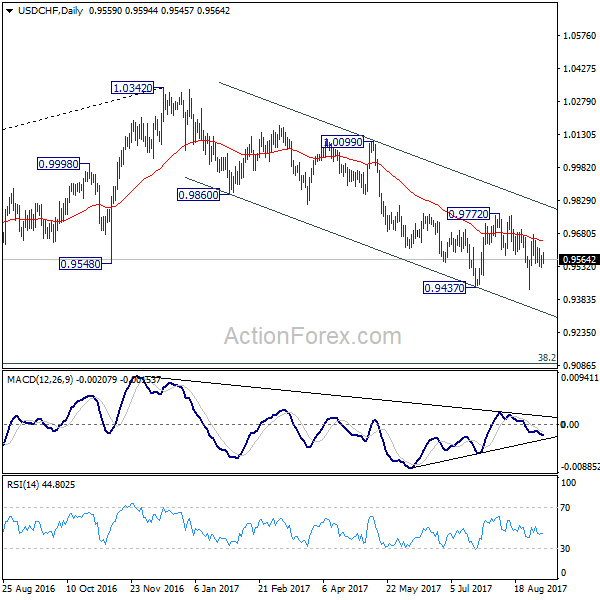
USD/CHF Daily Outlook
Daily Pivots: (S1) 0.9535; (P) 0.9559; (R1) 0.9590; More....
Intraday bias in USD/CHF remains neutral for the moment. On the downside, firm break of 0.9527 minor support will turn bias to the downside for retesting 0.9427 first. Break of 0.9427 will resume whole decline from 1.3042. Meanwhile, considering it's close to to 0.9443 key support, consolidation from 0.9427 might extend further. But still, break of 0.9772 resistance is needed to confirm near term reversal. Otherwise, outlook stays bearish for another decline.
In the bigger picture, current development suggests that 0.9443 key support (2016 low) could be taken out firmly as down trend form 1.0342 extends. There are various interpretation of the price actions. But in any case, medium term outlook will stay bearish as long as 0.9772 resistance holds. Current down trend could extend to 38.2% retracement of 0.7065 (2011 low) to 1.0342 (2016 high) at 0.9090. However, break of 0.9772 will indicate that USD/CHF has successfully defended 0.9443 again and turn outlook bullish for 1.0099 resistance.
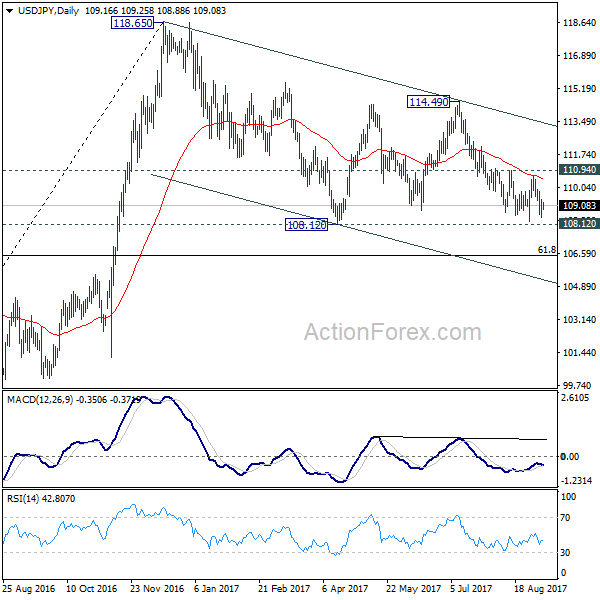
USD/JPY Daily Outlook
Daily Pivots: (S1) 108.65; (P) 109.02; (R1) 109.60; More...
USD/JPY recovered ahead of 108.12/26 support zone and intraday bias is turned neutral again. On the downside, decisive break of 108.12 will resume the whole corrective decline from 118.65. Next target will be 61.8% retracement of 98.97 to 118.65 at 106.48. In any case, outlook will remain cautiously bearish as long as 110.94 resistance holds.
In the bigger picture, the corrective structure of the fall from 118.65 suggests that rise from 98.97 is not completed yet. Break of 118.65 will target a test on 125.85 high. At this point, it's uncertain whether rise from 98.97 is resuming the long term up trend from 75.56, or it's a leg in the consolidation from 125.85. Hence, we'll be cautious on topping as it approaches 125.85. If fall from 118.65 extends lower, downside should be contained by 61.8% retracement of 98.97 to 118.65 at 106.48 and bring rebound.
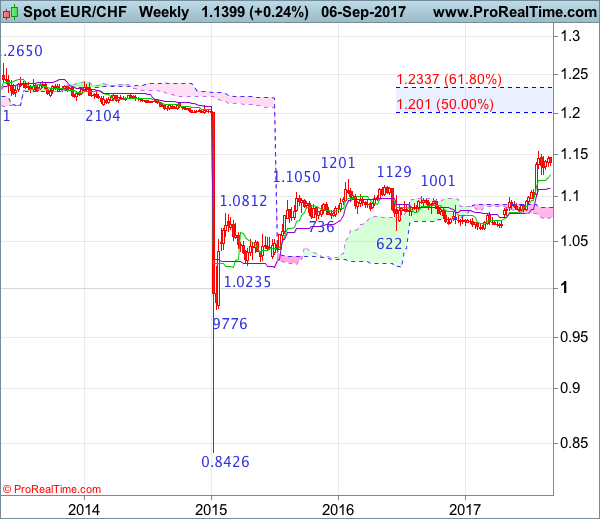
EUR/CHF Candlesticks and Ichimoku Analysis
Weekly
• Last Candlesticks pattern: Long white candlestick
• Time of formation: 24 Jul 2017
• Trend bias: Up
Daily
• Last Candlesticks pattern: Morning doji
• Time of formation: 25 Jul 2017
• Trend bias: Up
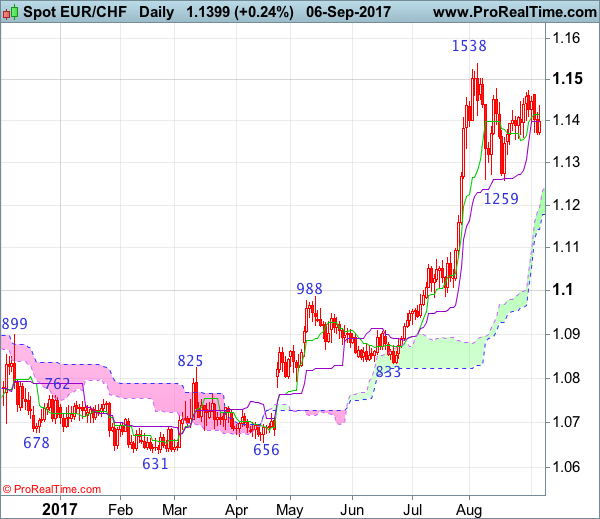
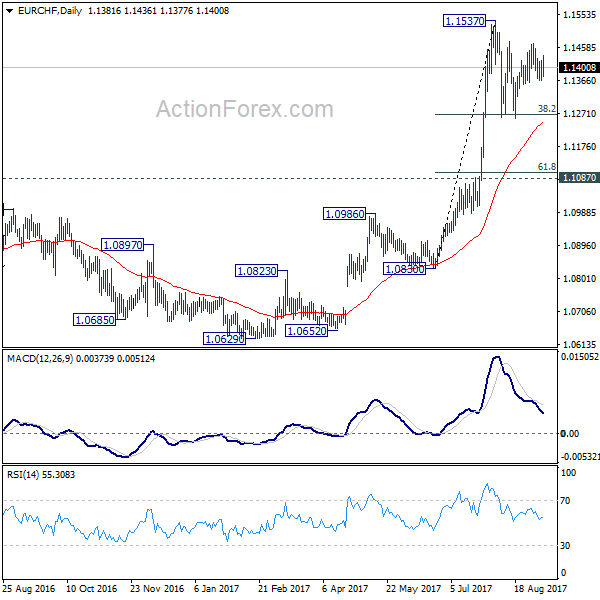
EUR/CHF – 1.1408
Although the single currency has retreated after rising to 1.1473 last week and further consolidation is in store, as long as indicated support at 1.1355 holds, bullishness remains for another rebound, above resistance at 1.1473-79 would add credence to our view that pullback from 1.1538 has ended at 1.1259 and bring further gain to 1.1500, then retest of 1.1538. Having said that, only a break of this recent high would confirm recent upmove has resumed and extend headway to 1.1600-10 but further sharp move beyond 1.1700 should not be repeated and price should falter below 1.1770-80, bring retreat later.
On the downside, as long as said support at 1.1355-56 holds, bullishness remains for another rise later. Below said support would defer and risk test of 1.1320-25, break there would suggest the rebound from 1.1259 has ended instead, bring retest of this level, below there would extend the corrective fall from 1.1538 top for retracement of recent upmove to 1.1185 (50% Fibonacci retracement of 1.0833-1.1538), however, sharp fall below 1.1100-05 (61.8% Fibonacci retracement) should not be repeated and 1.1050 would hold, bring rebound later.
Recommendation: Hold long entered at 1.1355 for 1.1555 with stop below 1.1350.
On the weekly chart, despite last week’s rebound to 1.1473, as the single currency has retreated after failing to penetrate indicated resistance at 1.1479, suggesting further sideways trading would take place, however, still reckon downside would be limited to support at 1.1355-59 and bring another rebound, a firm break above said resistance at 1.1473-79 would signal the pullback from 1.1538 has ended at 1.1259 and bring retest of this level. Only a break of this recent high would revive bullishness and extend the major rise from 0.8426 low for headway to 1.1590-00, then towards 1.1700-10 but overbought condition should prevent sharp move beyond 1.1800 and reckon 1.1900-10 would hold from here, risk from there has increased for a retreat to take place later.
On the downside, expect pullback to be limited to 1.1355-59 and bring another rise later. Below 1.1320-25 would risk test of 1.1259-61 (said support and current level of the Tenkan-Sen), a weekly close below there would shift near term risk to the downside and suggest a temporary top is formed instead, bring retracement of recent rise to 1.1100-05 (61.8% Fibonacci retracement of 1.0833-1.1538), then test of the Kijun-Sen (now at 1.1087) but reckon support at 1.0987 would remain intact.
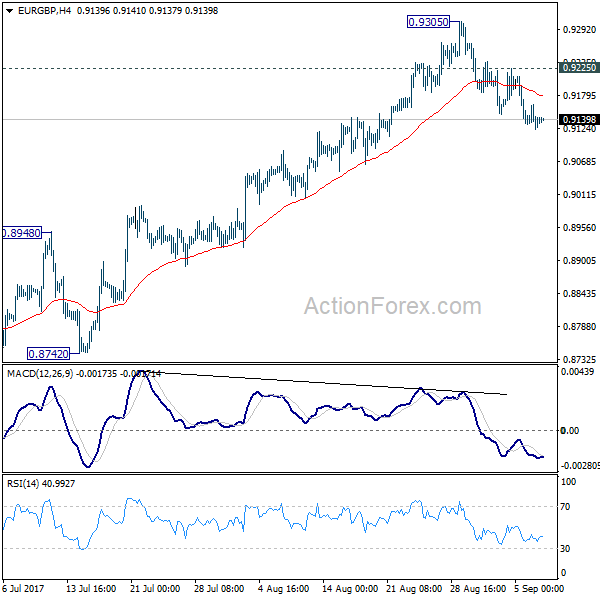
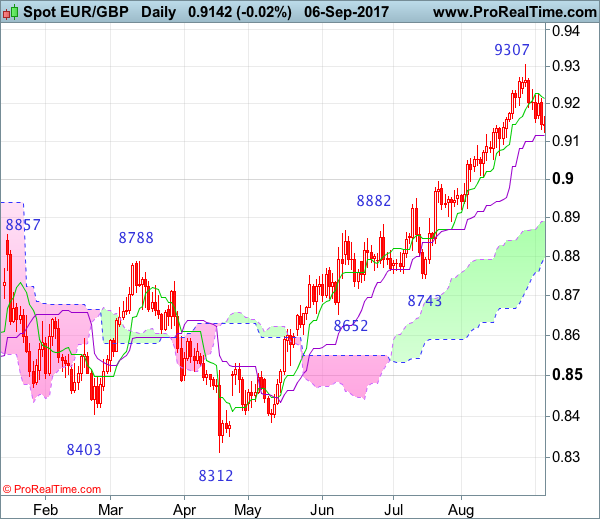
EUR/GBP Candlesticks and Ichimoku Analysis
Weekly
• Last Candlesticks pattern: N/A
• ime of formation: N/A
• Trend bias: Near term up
Daily
• Last Candlesticks pattern: Doji
• Time of formation: 21 Jul 2017
• Trend bias: Up
EURGBP – 0.9141
Euro’s retreat after rising to 0.9307 last week has retained our view that further consolidation below this level would be seen and test of the Kijun-Sen (now at 0.9115) is likely, break there would bring retracement to 0.9060-65, however, reckon support at 0.9008 would hold and bring another rise later, above 0.9225-30 would suggest the pullback from 0.9307 has ended, bring further gain to 0.9280 but break of said resistance at 0.9307 is needed to confirm medium term upmove has resumed and extend headway to 0.9350-55. Having said that, near term overbought condition should prevent sharp move beyond 0.9380-85 (100% projection of 0.8312-0.8950 measuring from 0.8743) and reckon 0.9400-10 would hold from here, risk from there is seen for a strong retreat to take place later.
On the downside, whilst initial pullback to the Kijun-Sen (now at 0.9115) is likely, reckon downside would be limited to 0.9060-65 and bring another rise later. A drop below said support at 0.9008 would defer and suggest a temporary top has been formed at 0.9307, bring retracement of recent upmove to previous resistance at 0.8950 and later towards the upper Kumo (now at 0.8906), having said that, reckon downside would be limited to 0.8830-35 and the lower Kumo (now at 0.8799) would contain downside, bring another rise later.
Recommendation: Buy again at 0.9050 for 0.9250 with stop below 0.8980.
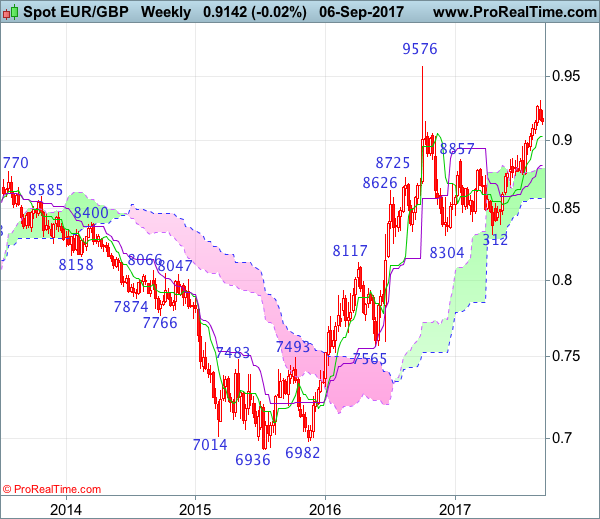
On the weekly chart, as the single currency has retreated after rising to 0.9307 last week (black candlestick with long upper shadow did form last week), retaining our view that consolidation below said resistance would take place and initial downside risk remains for correction to 0.9095-00, then 0.9050-60, however, reckon the Tenkan-Sen (now at 0.9025) would limit downside and bring another rise later. Above 0.9225-30 would bring retest of said resistance at 0.9307 but break there is needed to confirm recent erratic rise from 0.8304 has resumed and extend gain to 0.9350-60, then 0.9380-85 (100% projection of 0.8312-0.8950 measuring from 0.8743). Looking ahead, break there is needed to retain bullishness and signal the entire correction from 0.9576 top has ended at 0.8304 and encourage for further subsequent gain to 0.9450.
On the downside, although pullback to 0.9095-00 and 0.9050-60 cannot be ruled out, reckon the Tenkan-Sen (now at 0.9025) would limit downside and bring another rise later. A drop below support at 0.8891 would defer and suggest ta temporary top has possibly been formed, bring retracement of recent upmove to 0.885-60, then test of the Kijun-Sen (now at 0.8810) but reckon support at 0.8743 would hold. Only a weekly close below this support would retain bearishness for subsequent decline to 0.8650-55 but the lower Kumo (now at 0.8571) should remain intact, bring another rally later.
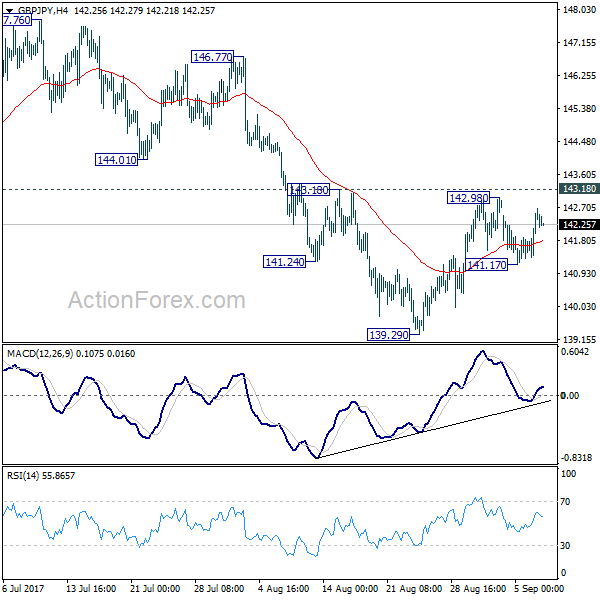
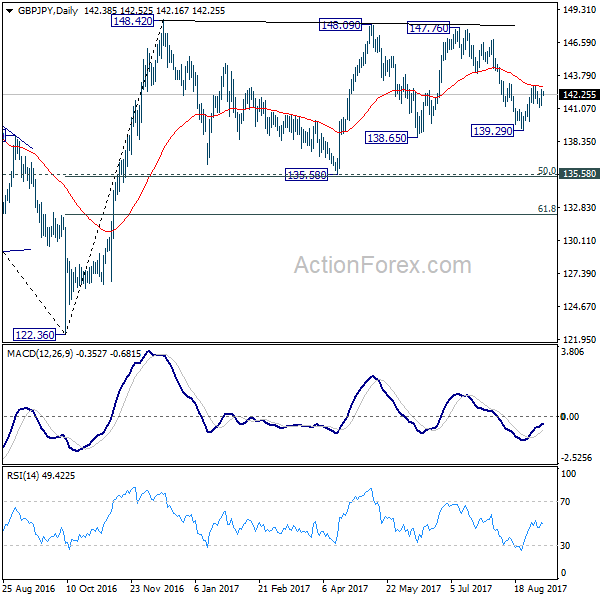
GBP/JPY Daily Outlook
Daily Pivots: (S1) 141.65; (P) 142.16; (R1) 142.98; More
GBP/JPY recovers after drawing support from 4 hour 55 EMA. Intraday bias is turned neutral first. On the downside, below 141.17 will target 139.29 support first. Break will extend the fall from 147.76 and target 135.58 key support level. At this point, price actions from 148.42 are seen as a sideway consolidation pattern. Hence, we'll expect strong support from 135.58 to contain downside and bring rebound. Meanwhile, break of 143.18 will indicate short term reversal and turn bias back to the upside.
In the bigger picture, the sideway pattern from 148.42 is still unfolding. In case of deeper fall, we'd expect strong support from 135.58 and 50% retracement of 122.36 to 148.42 at 135.39 to contain downside. Medium term rise from 122.36 is expected to resume later. And break of 38.2% retracement of 196.85 to 122.36 at 150.43 will carry long term bullish implications. However, firm break of 135.58/39 will dampen the bullish view and turn focus back to 122.36 low.
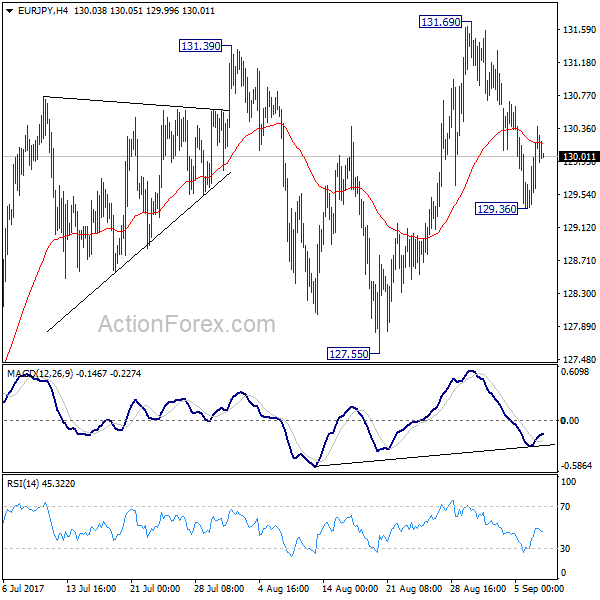
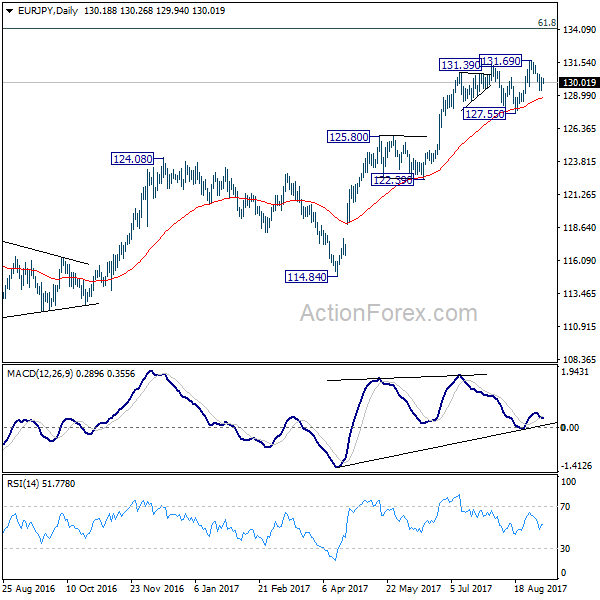
EUR/JPY Daily Outlook
Daily Pivots: (S1) 129.56; (P) 129.97; (R1) 130.59; More...
EUR/JPY recovers after hitting 129.36 and with 4 hour MACD crossed above signal line, intraday bias is turned neutral first. On the upside, break of 131.69 high is needed to confirm rally resumption. Otherwise, we'd expect more corrective price action in near term, with risk of deeper fall. Below 129.36 will target 127.55 support first. Firm break there will indicate near term reversal and deeper fall would be seen back to 122.39/125.80 support zone.
In the bigger picture, the down trend from 149.76 (2014 high) is completed at 109.03 (2016 low). Current rally from 109.03 should be at the same degree as the fall from 149.76 to 109.03. Further rise is expected to 61.8% retracement of 149.76 to 109.03 at 134.20. Sustained break there will pave the way to key long term resistance zone at 141.04/149.76. Medium term outlook will remain bullish as long as 124.08 resistance turned support holds. However, firm break of 124.08 will argue that rise from 109.03 is completed and turn outlook bearish.
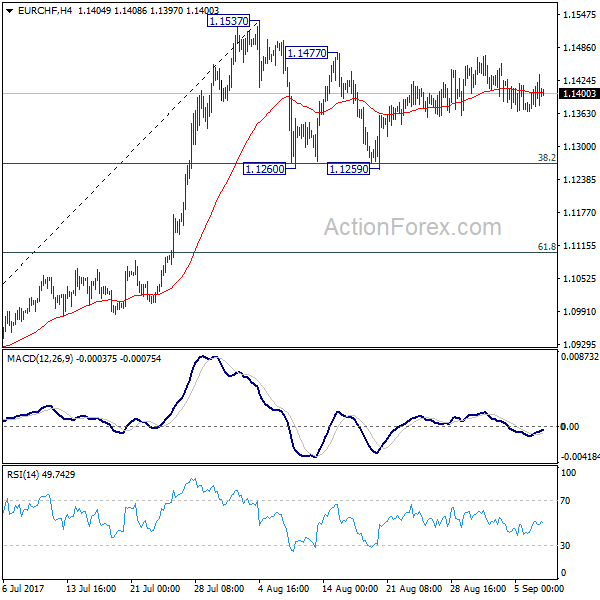
EUR/CHF Daily Outlook
Daily Pivots: (S1) 1.1371; (P) 1.1396; (R1) 1.1426; More...
Intraday bias in EUR/CHF stays neutral as consolidation from 1.1537 extends. On the upside, break of 1.1537 resistance will confirm resumption of larger rally from 1.0629. In that case, EUR/CHF should target 1.2 key resistance level next. On the downside, firm break of 38.2% retracement of 1.0830 to 1.1537 at 1.1267 will extend the correction to 61.8% retracement at 1.1100 before completion.
In the bigger picture, long term rise from SNB spike low back in 2015 is still in progress. EUR/CHF should now be heading back to prior SNB imposed floor at 1.2000. For now, this will be the favored case as long as 1.1087 resistance turned support holds.
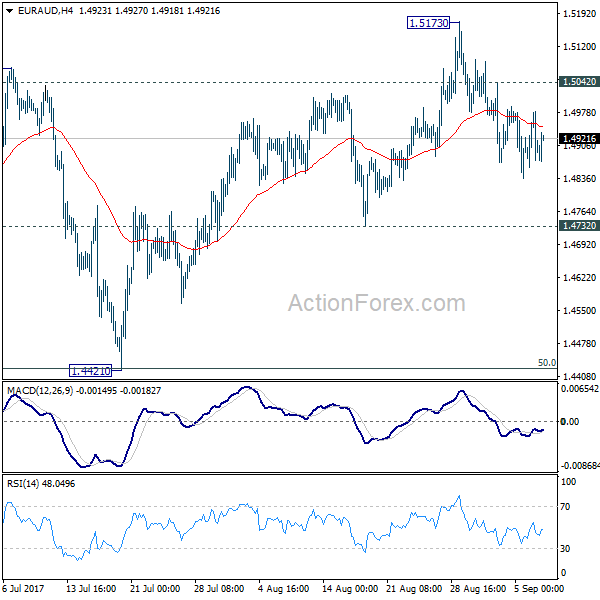
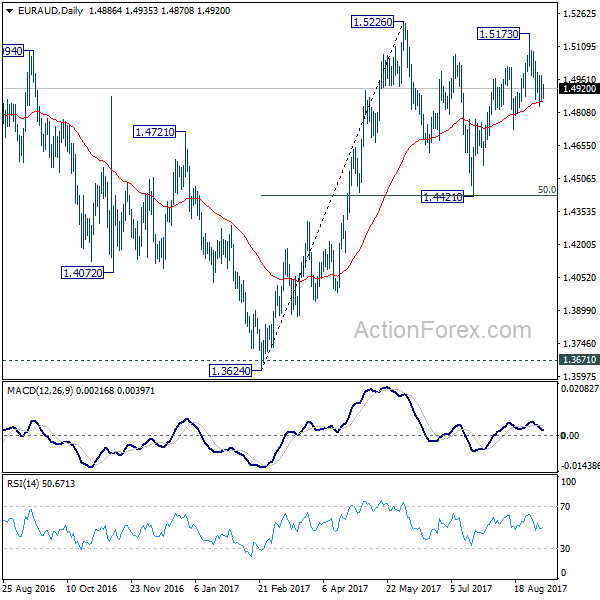
EUR/AUD Daily Outlook
Daily Pivots: (S1) 1.4840; (P) 1.4910; (R1) 1.4962; More....
No change in EUR/AUD's outlook. Deeper decline is expected as long as 1.5042 minor resistance holds. Break of 1.4732 support will confirm that fall from 1.5173 is the third leg of consolidation pattern from 1.5226. In that case, further fall should be seen to 1.4421 again. But we'd expect strong support from there to contain downside and bring rebound. On the upside, above 1.5042 minor resistance will turn bias back to the upside for 1.5173 resistance instead.
In the bigger picture, we're holding on to the view that corrective decline from 1.6587 medium term has completed at 1.3624. Rise from 1.3624 is expected to extend to retest 1.6587. The corrective structure of the price actions from 1.5226 is affirming this view. Above 1.5226 will target a test on 1.6587 key resistance. However, break of 1.4421 will dampen our view and would drag EUR/AUD lower to retest key support zone around 1.3624.
EUR/GBP Daily Outlook
Daily Pivots: (S1) 0.9118; (P) 0.9141; (R1) 0.9159; More
Intraday bias in EUR/GBP remains on the downside for the moment. Current fall from 0.9305 short term top would target 55 day EMA (now at 0.9013). Sustained trading below there will likely start the third leg of the consolidation from 0.9304 and target 0.8303 key support again. On the upside, above 0.9236 minor resistance will turn bias back to the upside for 0.9225 minor resistance instead.
In the bigger picture, price actions from 0.9304 are viewed as a medium term corrective pattern. It's uncertain whether it is finished yet. But in case of another fall, we'd expect strong support from 0.8116 cluster support (50% retracement of 0.6935 to 0.9304 at 0.8120) to contain downside and bring rebound. Whole up trend from 0.6935 is expected to resume after consolidation from 0.9304 completes. Firm break of 0.9799 high will target 61.8% projection of 0.5680 to 0.9799 from 0.6935 at 1.1054.