Sample Category Title
Pound Rises to 4-Week High as Korean Crisis Weighs on Greenback
The British pound has posted slight gains in the Wednesday session, following strong gains on Tuesday. In North American trade, GBP/USD is trading at 1.3072, up 0.31% on the day. Earlier in the day, the pound touched a high of 1.3080, its highest level since August 4. On the release front, there are no events in the UK. Over in the US, ISM Non-Manufacturing PMI improved to 55.3, but fell short of the forecast of 55.8 points. On Thursday, the US releases employment claims.
One of the biggest losers in the Brexit saga will be the City of London, which stands to lose its status as the primary financial hub in Europe. There are plenty of players casting an eye on the spoils after Britain leaves the European Union. Frankfurt and Dublin are the two main contenders, with Paris and Amsterdam are also hoping to lure large financial companies. On Wednesday, Deutsche Bank chief executive John Cryan argued that Frankfurt is ideally suited to take over from London as the financial hub for European banks, saying it has the structures in place to take over from London. Analysts estimate that London could lose up to 30,000 jobs in the financial services sector, with clients moving up to 1.8 trillion euros in assets from the UK to the continent. Germany could gain 30% of these jobs, which would mark a huge post-Brexit boon for the country.
On Wednesday, Deutsche Bank chief executive John Cryan weighed in on the matter, calling on the ECB to alter course and stop providing "cheap money" to the markets. Cryan warned that the ECB's monetary stance threatened to cause bubbles in the capital markets, including property, stocks and bonds. Cryan added that the stronger euro should not serve as an excuse for the ECB to continue its QE program. Turning to Brexit, Cryan argued that Frankfurt is ideally suited to take over from London as the financial hub for European banks. There is fierce jockeying in Europe as to who will take over from London, with Paris, Dublin and Amsterdam all hoping to pick up the spoils after Britain leaves the European Union and large financial companies bid adieu to London.
The ongoing crisis over North Korea and its neighbors continues to weigh on the US dollar. Gold and major currencies have benefited from the crisis, as nervous investors look for alternatives to the greenback. The week started with North Korea announcing that it had exploded a hydrogen bomb which could be fitted to an intercontinental ballistic missile. US President Trump responded by announcing that he would increase weapon sales to Japan and South Korea and on Wednesday, South Korea's President Moon Jae-in warned that the situation risked becoming "uncontrollable". If tensions between North Korea and the US worsen, the US dollar could continue to lose ground.
Loonie Shines as BOC Raises Rates; Oil Prices Hit Fresh Highs ahead of API
Although the North Korean story is still in progress, spreading fears to the international community and forcing investors to give up high-yield assets and buy less risky ones, the focus during the European trading hours turned back to the economic calendar. Trade and non-manufacturing PMI data were out of the US, while Canada released trade figures prior the BOC's surprising decision to raise rates. The loonie climbed to a fresh 2-year high versus the greenback, while oil peaked at new tops ahead of the API report expected later today.
During the European session, the dollar continued weakening as rumors were spreading that North Korea was planning to fire an intercontinental ballistic missile probably on September 9 when the regime will celebrate its founding day. Moreover, a top North Korean diplomat warned late on Tuesday that his country will deliver more "gift packages" to the US if it continues threatening the country.
In terms of US data, the Bureau of Economic analysis released trade figures for the month of July. The trade deficit rose moderately by $0.20bn to $43.70bn, coming in better than expectations of $44.60bn.
In other data out of the US, the Institute of Supply Management published the August PMI readings for the non-manufacturing industry. The index increased by 1.4 points to 55.3 but stood below the forecasted 55.4. In contrast, the Markit equivalent dropped by 0.9 points to 56.0 in August, missing expectations of 56.8, while the composite version which summarizes the trends of the manufacturing and non-manufacturing activities decreased by 0.7 points to 55.3. This followed the release of the Markit manufacturing PMI index which ticked up by 0.3 points to 52.8 on Friday.
Dollar/yen partially reversed yesterday's losses, climbing by 0.21% to a session high of 109.04. Dollar/swissie was up by 0.16% to $0.9564, while the safe-haven gold slipped by 0.06% to $1,337.70 an ounce.
The euro was building an upleg against the greenback, edging up to $1.1937. Note that ECB policymakers are meeting tomorrow, with markets anticipating the central bank to stick to its current monetary policy strategy, potentially giving new hints on the timing it will start reducing its asset holdings.
Sterling extended its gains versus the greenback reaching a one-month high of $1.3053 a day before the parliament brings the government's EU repeal bill on the table. With uncertainties around Brexit talks remaining on the background, the UK's Finance minister Philip Hammond warned policymakers on Monday to avoid any delay on legislation after the opposition party was said to be preparing several changes to the bill.
The aussie stretched its downtrend after disappointing GDP growth data, being 0.31% down on the day at $0.7971, while the kiwi was down by 0.35% at $0.7209.
The Canadian dollar surged by more than 1% today after the Bank of Canada shocked markets by raising interest rates. The Bank of Canada announced it is increasing its overnight rate by a quarter of a percentage points to 1%. The decision was unexpected as a majority of analysts were anticipating the next move to come in October. But following much stronger-than-expected GDP growth in the second quarter, the BoC opted to act at its September meeting. However, regarding the outlook for further rate hikes, the Bank said future decisions would be data dependent and expressed some concerns about geopolitical risks, a stronger loonie and high household debt. Nevertheless, the loonie jumped to a fresh 2-year high after the decision, with dollar/loonie hitting a low of 1.2134 before settling around 1.2235.
Before the BOC announces its decision to raise rates, trade data failed to provide support to the currency. Canadian exports dropped by C$2.29bn to C$44.14bn in July mainly due to a stronger exchange rate according to Statistics Canada (loonie gained 3.6 US cents in July), whilst imports declined by C$3.02bn to C$47.18. The trade deficit narrowed by C$0.72bn to C$3.04bn, surprising analysts who projected it to shrink by C$0.06bn to C$3.10bn.
Looking at oil prices, those were one of the best performers during the European session. WTI crude surged by 1.19% to a near one-month high of $49.21 per barrel, while Brent jumped by 1.35% to a more than three-month high of $54.12. The increase in prices emerged as a significant proportion of the total US refining capacity was still shut after the catastrophic storm Harvey knocked out of business major refineries in Texas last week. Moreover, hurricane Irma which is currently located in the Caribbean and is expected to enter Florida, might cause additional fuel shortage. According to Reuters, 250k barrels of daily refining capacity are located in the Dominican Republic and Cuba. Though, the American Petroleum Institute report published later today and the Energy Information Administration report released tomorrow will give an indication of the damage caused by Harvey. It should be mention that the API report is expected to show that crude oil stock reduced by 5.78mn barrels last week.
New Zealand Dollar Rally Under Threat from Rising Political Risks
The New Zealand dollar had surged by around 10% between May's 2017 low point and July's two-year high, making it one of the better performing currencies of the year against the US dollar. However, central bank unease about the strength of the currency, downgrades to the government's growth forecasts and an unexpectedly tight election race have derailed the rally.
Even as the New Zealand economy enjoys strong growth and a huge government surplus, the kiwi has stumbled upon some unexpected risks, forcing the currency into a sharp downside correction.
The kiwi first came under heavy pressure on August 10 after the Reserve Bank of New Zealand stepped up its concerns about the strong exchange rate. Its downslide intensified on August 23 after the government revised down its forecasts for economic growth for 2017 and 2018. The revision was mainly due to reduced expectations for the construction sector as a result of capacity constraints, with the overall outlook remaining bright. But the lower projections allow less room for future tax giveaways, and thus diminished chances of further fiscal stimulus.
More recently, a surprise boost in support for the Labour party has unnerved markets as the country heads off to a general election on September 23. Labour's 37-year old leader, Jacinda Ardern, has only been in the job for just over a month but has managed to close the party's gap with the ruling National party, led by Prime Minister Bill English. The National party was comfortably expected to win the elections before "Jacindamania" swept the country. Labour were trailing the National party by 10 points prior to Ms. Ardern's appointment as party leader on July 31.
The prospect of a surprise win for Labour has investors worried as the party plans to cancel the tax cuts announced by the National party to fund increases in health and education spending. They also want to introduce new taxes such as on tourism and water, cut immigration, and reform the country's central bank, the Reserve Bank of New Zealand.
Labour is proposing to change the RBNZ's mandate from focusing on just inflation to a dual one to include employment, similar to the Federal Reserve in the United States. Such a reform is seen as being negative for the New Zealand dollar as it would probably lead to lowered expectations on future interest rate hikes. A dual objective of inflation and employment could force the RBNZ to keep rates lower for longer to accommodate growth in the labour market.
The elections have already disrupted operations at the RBNZ as it has delayed the appointment of a new governor. The current governor, Graeme Wheeler, is due to step down on September 26 and will be replaced temporarily by Deputy Governor Grant Spencer, who will act as a caretaker for six months. The next meeting on September 28 will be his first as Governor. Spencer is known to be more hawkish than Wheeler, however, it's unlikely there will be a significant shift in RBNZ policy until a permanent Governor has been appointed.
In the meantime, the kiwi is struggling to find its bearings, having retraced about half of its May to July gains, as uncertainty over both the future government and central bank policy hang over the currency's outlook. External factors have also weighed on the kiwi, as the bout of risk aversion associated with the geopolitical tensions in the Korean peninsula has dampened sentiment for riskier assets. Strengthening demand for commodities has not been much of a boost for the kiwi either as prices for New Zealand's main export, dairy, has been largely flat this year.
An election win for Labour could propel the kiwi to further declines in the near term, though strong economic fundamentals should prevent a sharp depreciation. Moreover, the odds of a change to the RBNZ's mandate are very strong if Labour were to form a coalition with the likely election kingmakers, the New Zealand First party, who also support reforming the central bank. Such a move could push up the yield on long-term government bonds as markets would view the RBNZ to be more tolerant of inflation.
On the other hand, an expected win for the National party could potentially act as a trigger to reignite the kiwi's rally, and with the US dollar looking increasingly bearish, a break of July's two-year peak of $0.7558 could prove an easy challenge. However, traders will be wary of driving the kiwi higher too fast and by too much as it could prompt an intervention by the RBNZ, which remains an open option for the bank.
Soft Print for Australian GDP Masks Underlying Improvement
Second quarter GDP growth came in a bit below expectations, but the headline miss is largely a function of an inventory drawdown. Final domestic demand actually posted its second best quarter in five years.
Inventories Mostly to Blame
According to data released earlier today, the Australian economy picked up speed in the second quarter but, the 0.8 percent growth achieved during the quarter (not annualized) was a tick shy of the 0.9 percent that had been expected. Still, at an annualized rate, the 3.3 percent growth marks a more than doubling of the 1.3 percent growth reported in the first quarter, and is also faster than the 2.5 percent average quarterly growth rate achieved in 2015 and 2016.
The soft print hides what we consider to be a marked improvement in growth fundamentals. Consumer spending, for example, quickened modestly versus the prior period which is consistent with three consecutive monthly gains in retail sales during the quarter. A more demonstrable example of the improvement is in gross fixed capital formation which increased 1.5 percent (not annualized) the second-fastest quarterly pop since 2012.
The primary culprit for the miss in second quarter GDP growth in Australia was a drawdown in inventories. Coming on the heels of a modest inventory build in the first quarter, the result was a big drag on headline GDP which masks the improvement in domestic demand. Indeed, our calculation of final domestic demand (which sums government, consumer and business spending, but excludes trade and inventories) shows an annualized growth rate of 3.8 percent. That is the second-best outturn for final domestic demand in the past five years.
Consistent with what we have seen in other trade-reliant economies, some firming in global growth was supportive of trade during the quarter as well. Exports increased 2.7 percent for the quarter and imports increased as well, but the 1.2 percent growth there was not nearly as much as exports which resulted in a boost to the headline from trade.
RBA Still Stuck in a Bind
The Reserve Bank of Australia (RBA) also met today and as widely expected kept the official cash rate at 1.5 percent where it has been for a little over a year now. As we wrote in a recent piece with our colleagues in the currency strategy group, Catch-22, the RBA is stuck in the unsavory position of rising consumer debt amidst a run-up in home prices, at least in some markets. What has arguably changed in the roughly four months since we published that report is that there are signs of firming in the Aussie economy. Acknowledging this dynamic, the official statement from the RBA noted "[t]he recent data have been consistent with the Bank's expectation that growth in the Australian economy will gradually pick up over the coming year." With inflation still low and wobbly fundamentals in housing, we still see the RBA on hold well into 2018.
US: Non-Manufacturing Sectors Accelerate in August
The Institute for Supply Management's (ISM) non-manufacturing index rebounded in August, rising 1.4 points to 55.3, after deteriorating by 3.5 points in the month prior. The headline print came in slightly below market consensus for an increase to 55.6.
Gains were broad-based with most sub-indicators increasing on the month. Among the most notable were improvements in employment (+2.6 to 56.2 - following two consecutive monthly declines), business activity (+1.6 to 57.5) and new orders (+2.0 to 57.1). The backlog of orders and new export orders also improved 1.5 and 2 points to 53.5 and 55 respectively.
The prices paid sub-index (+2.2 to 57.9) rose for the third consecutive month. The recent improvements have undone the massive 8.4-point deterioration that occurred in May, bringing the sub-index slightly above April's level.
Among the remaining indicators, imports (-1 to 50.5) recorded a slight deterioration. Meanwhile, inventories (-3 to 53.5) and inventory sentiment (-6 to 61) recorded more notable pullbacks, but both remain near their 12-month average.
Nearly all of the non-manufacturing industries surveyed reported growth in August, with Agriculture, Forestry, Fishing & Hunting, and Transportation & Warehousing being the only exceptions. At the same time, comments from survey contacts remained largely positive.
Key Implications
Just like its manufacturing equivalent, the ISM non-manufacturing index rebounded in August, suggesting that the weakness experienced in the month prior was transitory. The recent acceleration brought the headline index well into expansionary territory. Moreover, gains among the subcomponents were relatively broad-based, with rebounds in business activity, new orders and employment being particularly encouraging. Other survey details only corroborated the positive theme, with most industries reporting growth on the month and survey responses largely sanguine.
The continued improvement in the prices paid sub-index widened the gap from year-ago levels for the second consecutive month. With a similar trend evident in its manufacturing equivalent, both ISM surveys point to rising price pressures. While we are yet to see these pressures reflected in CPI and the PCE price index, the trend should still provide some comfort to the Fed as it meets to discuss monetary policy in two weeks' time.
While the ISM receives the majority of survey responses late in the month, today's results do not appear to be impacted from Hurricane Harvey (which made landfall on August 25th). Nonetheless, we expect these to come through in next month's survey with both non-manufacturing as well as manufacturing activity being affected. As such, some volatility should be expected in the months ahead.
Yen Pauses After Gains, US Services Report Misses Mark
USD/JPY has steadied in the Wednesday session, after posting losses on Tuesday. In North American trade, the pair is trading at 108.82, up 0.01% on the day. Earlier in the day, the yen dropped to a low of 108.45, close to its lowest level since April. On the release front, the ISM Non-Manufacturing PMI improved to 55.3, but fell short of the forecast of 55.8 points. In Japan, the sole event on the schedule is the 30-year bond auction. On Thursday, the US releases employment claims, and Japan will publish Final GDP.
The yen has gained ground courtesy of the ongoing North Korean crisis, as the safe-haven asset has been in demand following missile launches by North Korea, which has raised tensions in the area. The yen improved sharply on Tuesday, following North Korea's announcement that it had exploded a hydrogen bomb which could be fitted to an intercontinental ballistic missile. US President Trump responded by announcing that he would increase weapon sales to Japan and South Korea and on Wednesday, South Korea's President Moon Jae-in warned that the situation risked becoming "uncontrollable". As tensions between Washington and Pyongyang have increased, the drop in risk appetite is driving investors to the safe-haven yen. If the situation continues to deteriorate, traders can expect the Japanese currency to continue to gain ground.
Despite years of radical monetary policy, the Bank of Japan has been unable to subdue deflation, which continues to grip the economy. BoJ Governor Haruhiko Kuroda has insisted that he will not alter monetary policy until inflation hits the bank's level of 2%, but critics are becoming increasingly impatient with the inflexibility in the BoJ's stance. On Monday, former BoJ board member Takahide Kiuchi said the BoJ must make changes to its radical stimulus. Kiuchi called on the central bank to be more flexible with its inflation target, and also warned that the bank needed to taper its annual asset purchases to 45 JPY trillion, otherwise the current purchases of JPY 60 trillion would hit the ceiling in mid-2018. Critics of the BoJ's stimulus experiment have long warned that the BoJ is running out of ammunition in its monetary policy arsenal, and have said that the BoJ must bite the bullet sooner or later and wind down its stimulus program.
US employment numbers were anything but impressive last week, as nonfarm payrolls tumbled to 156 thousand and wage growth slowed to just 0.1%. The soft numbers weren't lost on the Federal Reserve, as FOMC member Leal Brainard weighed in interest rate policy on Tuesday. Brainard noted that inflation remained "well short" of the Fed's target of 2%, and urged the Fed to act cautiously and resist raising interest rates until inflation moves higher. Brainard did acknowledge the rebound in the US economy, saying that the economy was on "solid footing". A December rate hike remains very much in doubt, with odds of an increase at just 30%. With the likelihood of a rate hike pegged at less than 2% at next week's policy meeting, the markets will be focusing on the Fed's balance sheet, which stands at $4.2 trillion. Earlier in the year, the Fed outlined plans to reduce the balance sheet, and analysts expect further details at the September meeting.
Bank of Canada Hikes Again after a Summer of Impressive Data
Highlights:
- The overnight rate was raised to 1.00% from 0.75% in light of stronger-than-expected data since the last meeting in July.
- The bank doesn't appear to be overly concerned about the Canadian dollar's recent strength, pinning currency appreciation on USD weakness and relative strength in the Canadian economy.
- Inflation has evolved as expected with some increase in headline and core rates as economic slack is absorbed and transitory factors fade.
- The statement noted some remaining signs of labour market slack, as well as relatively slow wage growth at this point in the cycle. The latter has been observed in other advanced economies.
- The bank once again noted future rate decisions will be data dependent and close attention will be paid to the economy's sensitivity to higher rates given elevated household debt.
Our Take:
The Bank of Canada surprised market consensus by raising rates for the second time in as many meetings, though today's move wasn't a total shock given strong economic data over the intermeeting period. We hadn't heard from the bank since July's meeting but their forward guidance that future policy changes would be data dependent, combined with last week's robust GDP report, raised the prospect of an immediate follow-up to July's increase. Impressive growth and additional evidence that the expansion is becoming more broadly-based—including the long awaited rotation toward stronger business investment and exports—warranted some further removal of the "considerable monetary policy stimulus in place." At present, inflation and wage growth are not signaling an immediate need to return to a more neutral stance though that didn't keep the bank from tightening policy at consecutive meetings. However, they continued to note future moves will be data dependent with an eye on inflation and how households react to higher interest rates given elevated debt levels. The bank is likely trying to keep markets from extrapolating the pace of rate hikes seen over the last two meetings.
We had expected the bank would hold off on another rate increase until October when its growth forecasts are refreshed. We think those projections will show the economy near capacity in Q3, though today's indication that policymakers will have an eye on the economy's potential growth gives them some flexibility on that front. On balance, limited economic slack, solid growth momentum, and "considerable" stimulus remaining in the system support the case for another rate hike before the end of the year. Our updated forecast for the overnight rate will be released in Friday's Financial Markets Monthly.
EUR/USD Mid-Day Outlook
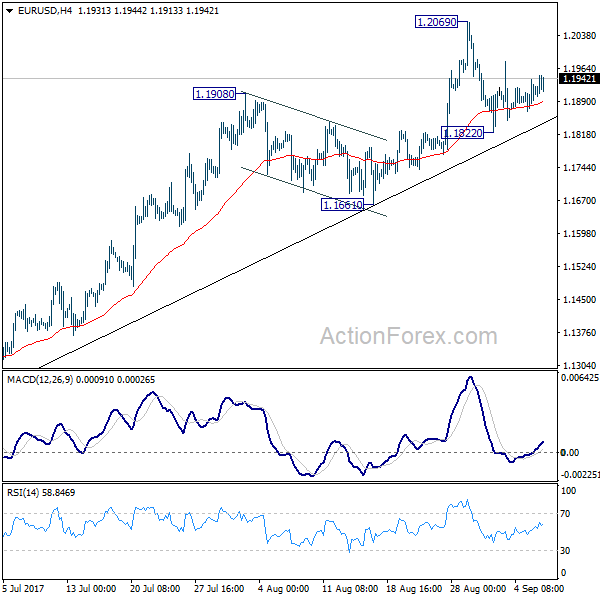
Daily Pivots: (S1) 1.1873; (P) 1.1906 (R1) 1.1946; More...
Intraday bias in EUR/USD remains neutral as it's still bounded in consolidation below 1.2069. Below 1.1822 will bring deeper fall. But after all, there is no clear sign of trend reversal yet. Outlook will remain bullish as long as 1.1661 holds. Break of 1.2069 will extend larger rise from 1.0339 to next key fibonacci level at 1.2516. Nonetheless, break of 1.1661 will bring much lengthier consolidation first.
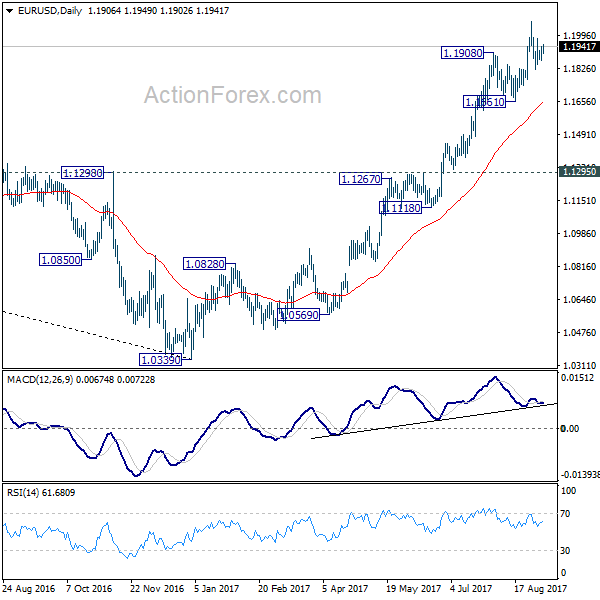
In the bigger picture, an important bottom was formed at 1.0339 on bullish convergence condition in weekly MACD. Sustained trading above 55 month EMA (now at 1.1774) will pave the way to key fibonacci level at 38.2% retracement of 1.6039 (2008 high) to 1.0339 (2017 low) at 1.2516. While rise from 1.0339 is strong, there is no confirmation that it's developing into a long term up trend yet. Hence, we'll be cautious on strong resistance from 1.2516 to limit upside. For now, medium term outlook will remain bullish as long as 1.1295 support holds, in case of pull back.
GBP/USD Mid-Day Outlook
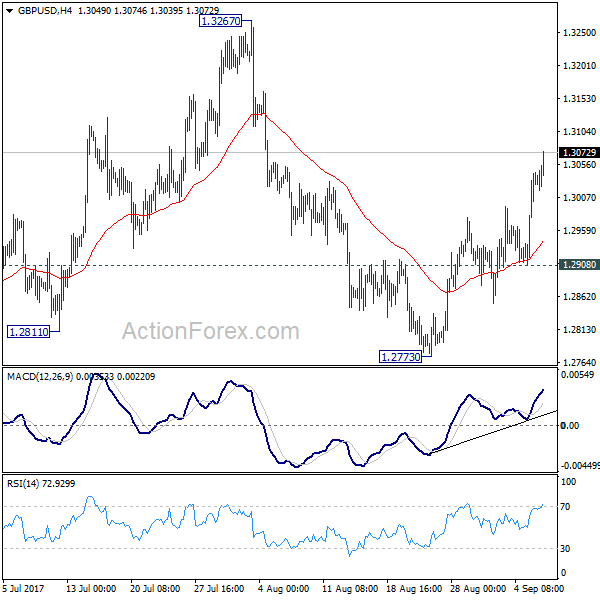
Daily Pivots: (S1) 1.2945; (P) 1.2993; (R1) 1.3079; More...
Intraday bias in GBP/USD remains on the upside for 1.3267. Break will target 1.3444 key resistance level next. Price actions from 1.1946 are still seen as a corrective pattern. Hence, we'd expect strong resistance from 1.3444 to limit upside to bring larger down trend reversal eventually. On the downside, below 1.2908 minor support will turn bias back to the downside for 1.2773.
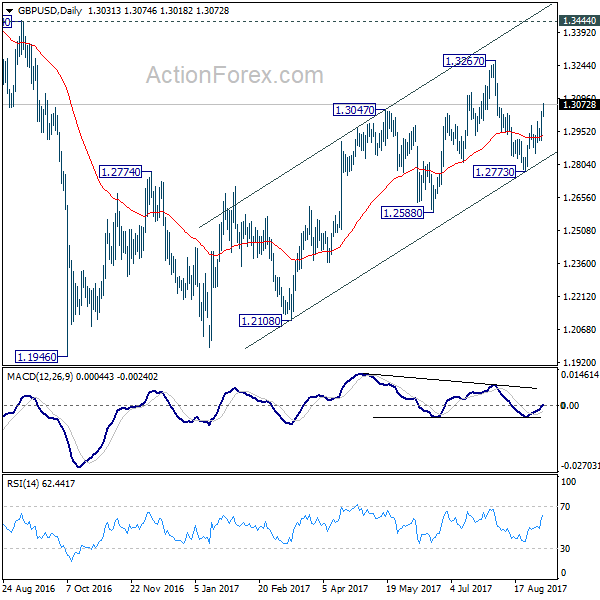
In the bigger picture, overall, price actions from 1.1946 medium term low are seen as a corrective pattern. While further rise cannot be ruled out, larger outlook remains bearish as long as 1.3444 key resistance holds. Down trend from 1.7190 (2014 high) is expected to resume later after the correction completes. And break of 1.2588 will indicate that such down trend is resuming.
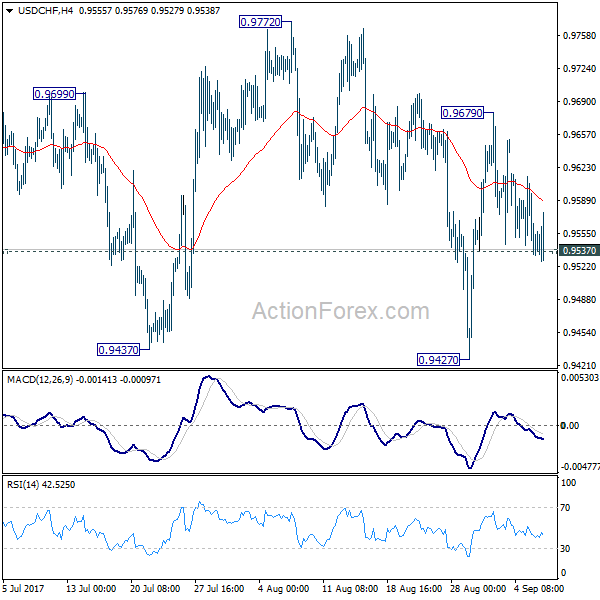
USD/CHF Mid-Day Outlook
Daily Pivots: (S1) 0.9520; (P) 0.9566; (R1) 0.9599; More....
Focus remains on 0.9537 minor support. Firm break will turn bias to the downside for retesting 0.9427 first. Break of 0.9427 will resume whole decline from 1.3042. Meanwhile, considering it's close to to 0.9443 key support, consolidation from 0.9427 might extend further. But still, break of 0.9772 resistance is needed to confirm near term reversal. Otherwise, outlook stays bearish for another decline.
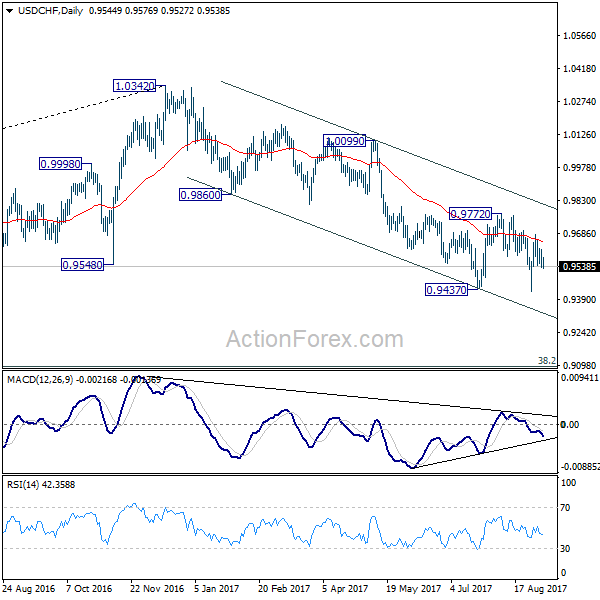
In the bigger picture, current development suggests that 0.9443 key support (2016 low) could be taken out firmly as down trend form 1.0342 extends. There are various interpretation of the price actions. But in any case, medium term outlook will stay bearish as long as 0.9772 resistance holds. Current down trend could extend to 38.2% retracement of 0.7065 (2011 low) to 1.0342 (2016 high) at 0.9090. However, break of 0.9772 will indicate that USD/CHF has successfully defended 0.9443 again and turn outlook bullish for 1.0099 resistance.