
Sample Category Title
Trade Idea Update: USD/CHF – Buy at 0.9500
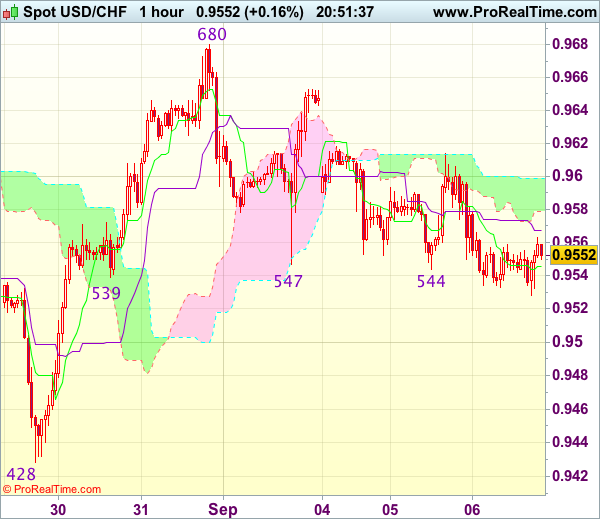
USD/CHF - 0.9554
Original strategy :
Buy at 0.9500, Target: 0.9600, Stop: 0.9465
Position : -
Target : -
Stop : -
New strategy :
Buy at 0.9500, Target: 0.9600, Stop: 0.9465
Position : -
Target : -
Stop : -
As the greenback has remained under near term pressure and consolidation with initial downside bias remains, hence weakness to 0.9520-25 cannot be ruled out, however, if our view that low has been formed at 0.9428 last week is correct, downside would be limited to 0.9500 and bring another rebound later. Above 0.9615-20 would suggest low is possibly formed, bring test of 0.9653-55 resistance, break there would bring another rise to 0.9680 but break there is needed to add credence to this view and extend gain to resistance at 0.9698-99.
In view of this, we are inclined to buy dollar on further subsequent decline. Below 0.9490-00 would risk weakness to 0.9470 but still reckon downside would be limited to 0.9450 and said support at 0.9428 should remain intact, bring another rebound later.
Trade Idea Update: GBP/USD – Buy at 1.2970
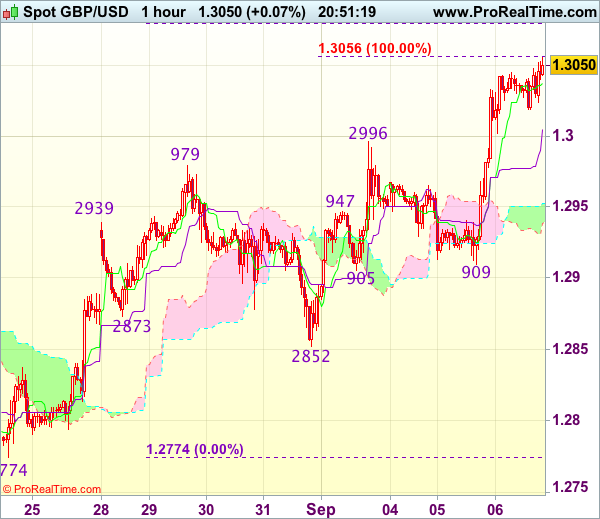
GBP/USD - 1.3047
Original strategy :
Buy at 1.2970, Target: 1.3070, Stop: 1.2935
Position : -
Target : -
Stop : -
New strategy :
Buy at 1.2970, Target: 1.3070, Stop: 1.2935
Position : -
Target : -
Stop : -
Yesterday’s rally above previous resistance at 1.3032 confirms recent rise from 1.2774 has resumed and mild upside bias remains for this move to extend further gain to 1.3055-60 (100% projection of 1.2774-1.2979 measuring from 1.2852), then towards 1.3080 (61.8% Fibonacci retracement of 1.3269-1.2774) but near term overbought condition would prevent sharp move beyond 1.3100, risk from there is seen for a retreat to take place later.
In view of this, would not chase this rise here and would be prudent to buy cable on pullback as 1.2970 should limit downside and bring another rise. Below the upper Kumo (now at 1.2951) would defer and risk weakness to the lower Kumo (now at 1.2935) but only break of support at 1.2905-09 would signal top is formed.
Trade Idea Update: EUR/USD – Sell at 1.1980
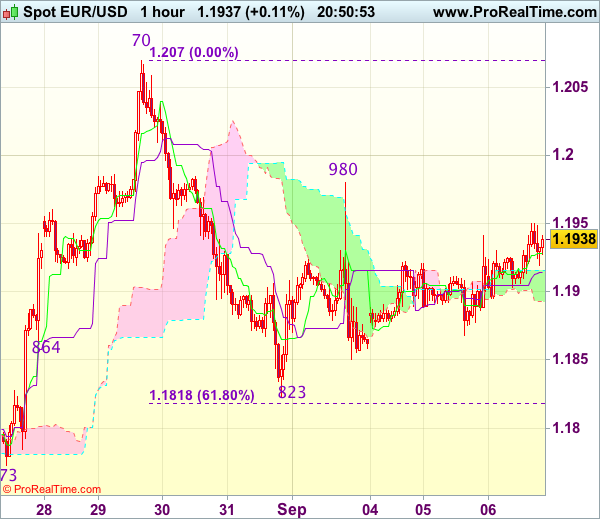
EUR/USD - 1.1932
Original strategy :
Sell at 1.1980, Target: 1.1880, Stop: 1.2015
Position : -
Target : -
Stop : -
New strategy :
Sell at 1.1980, Target: 1.1880, Stop: 1.2015
Position : -
Target : -
Stop : -
Yesterday’s cable-led rebound suggests consolidation with initial upside bias would be seen and gain to 1.1950-55 cannot be ruled out, however, reckon upside would be limited to resistance at 1.1980 and bring another decline later. Below 1.1885-90 would bring weakness to 1.1850, break there would signal the rebound from 1.1823 has ended, then test of this level would follow, break there would add credence to our view that top has been formed at 1.2070 earlier and extend the fall from there to 1.1815-18 (61.8% Fibonacci retracement of 1.1662-1.2070), then 1.1790-00 but downside should be limited to previous support at 1.1773.
In view of this, we are looking to sell euro again on recovery as 1.1980 resistance should limit upside. Only a firm break above said resistance at 1.1980 would abort and signal the fall from 1.2070 has ended at 1.1823, bring further gain to 1.2000 and possibly towards 1.2025-30.
Trade Idea Update: USD/JPY – Sell at 109.40
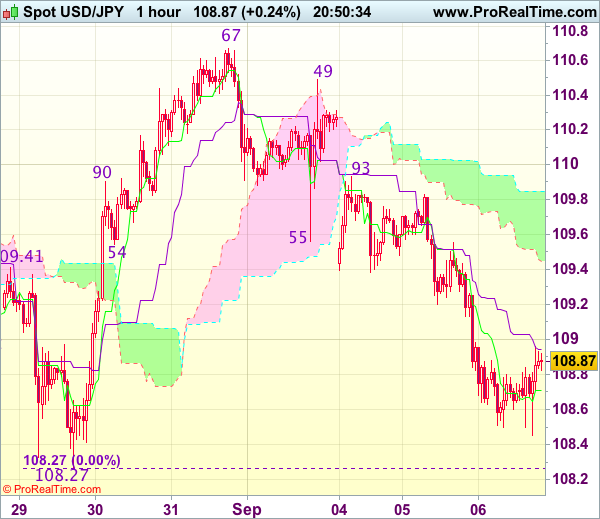
USD/JPY - 108.86
Original strategy :
Sell at 109.40, Target: 108.40, Stop: 109.75
Position : -
Target : -
Stop : -
New strategy :
Sell at 109.40, Target: 108.40, Stop: 109.75
Position : -
Target : -
Stop : -
As dollar has remained under pressure after yesterday’s selloff, adding credence to our view that the fall from 110.67 is still in progress and may extend weakness towards previous support at 108.27, however, break there is needed to retain bearishness and extend the fall from 114.50 to another previous chart support at 108.13, having said that, the greenback needs to penetrate this chart support to confirm early selloff from 118.66 has resumed for subsequent weakness to 107.70-75 which is likely to hold from here.
In view of this, we are looking to sell dollar on recovery as 109.40-50 should limit upside and bring another decline later. Above 109.80-83 would abort and signal an intra-day low is formed instead, bring a stronger rebound to 110.00-05 but price should falter well below resistance at 110.49.
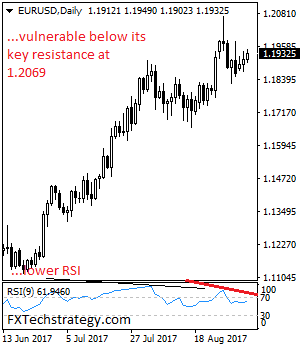
EURUSD Remains Vulnerable To The Downside Below Key Resistance
EURUSD: With the pair continuing to retain its downside pressure on correction, more weakness is likely despite present price hesitation. Resistance comes in at 1.1950 level with a cut through here opening the door for more upside towards the 1.2000 level. Further up, resistance lies at the 1.2050 level where a break will expose the 1.2100 level. Conversely, support lies at the 1.1900 level where a violation will aim at the 1.1850 level. A break of here will aim at the 1.1800 level. All in all, EURUSD faces further downside pressure on correction.
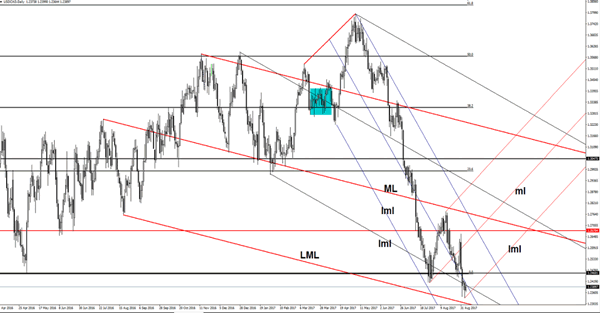
USD/CAD Is The Corrective Phase Completed?
The USD/CAD posted some gains in the first part of the day, but what will come is more important. The economic calendar is filled with high impact data, which will have a huge impact on the price action. Price continues to be under immense selling pressure because is located under some important resistance levels (support turned into resistance).
USD/CAD increased even if the dollar index has decreased further, we'll be important to see how will react after the Canadian and the US data will be sent to the public. The USDX is trading near an important support zone, but remains under pressure.
The BOC is expected to leave the rate unchanged today, at 0.75%, could announce a rate hike in the upcoming month. The Canadian Trade Balance could increase from -3.6B to -3.2B, while the Labor Productivity could increase by 0.9%. The greenback needs a helping hand from the US economy, but remains to see if will receive one.
Price is on a declining path and maintains a bearish perspective. Has dropped again below the median line (ml) of the minor descending pitchfork and under the lower median line (lml) of the black descending pitchfork. Only a false breakdown below these levels will signal a reversal in the upcoming weeks.
USD/CAD failed once again to reach and retest the lower median line (LML) of the major descending pitchfork, signaling an oversold. However, is premature to say that the corrective phase is completed, because the fundamental factors could demolish any bullish perspective.
Technically, a retest of the lower median line (lml) of the minor ascending pitchfork will confirm a further increase in the upcoming period.
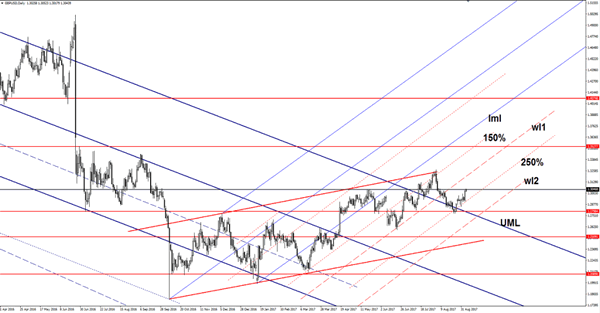
GBP/USD Reached Another Upside Target
GBP/USD resumed the upside movement and has managed to reach the 1.3046 static resistance. I've said in the previous reports that the rate should reach this level after the retest of the 250% Fibonacci line. A breakout will signal a further increase towards the warning line (wl1).
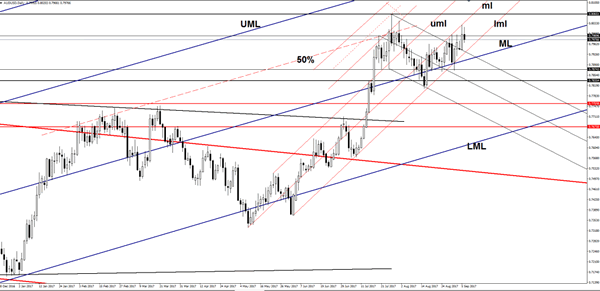
AUD/USD Is This Really Overbought?
AUD/USD increased today, but failed to reach the 0.8027 yesterday's high and the median line (ml) of the minor ascending pitchfork, signaling an exhaustion. Price rallied in the yesterday's trading session and retested the median line (ml), but unfortunately has failed to close near it. The pair is trading in the red right now and seems determined to reach and retest the lower median line (lml) again.
ECB: Copy of December 2016’s Playbook?
- ECB ready to extend APP and reduce monthly amount of purchases
- Strong growth, but tame inflation warrants such scenario
- Curve steepening; Draghi able to prevent more unwarranted euro strength?
ECB President Draghi informed markets at the July press conference that the central bank would have significant discussions on its policy stance in autumn. He refused to clarify whether this timeframe referred to the September or October (26) policy meeting. So, markets are unsure as to whether this week's ECB press conference will produce any significant news in terms of the ECB policy outlook.
The most likely market moving development would probably be in relation to the ECB's Asset Purchase Programme. The current forward guidance reads that "net asset purchases, at the current monthly pace of €60 billion, are intended to run until the end of December 2017, or beyond, if necessary, and in any case until the Governing Council sees a sustained adjustment in the path of inflation consistent with its inflation aim.". Markets will be keen to see whether and to what extent this guidance might be altered on Thursday.
APP: Extend and recalibrate?
As we approach the current specified target date of end December, we expect the ECB to adapt its guidance to clear uncertainty in markets and avoid unwarranted speculation/nervousness in the months running up to the year-end. Draghi and Co could use the playbook they've put together in December 2016. Nine months ago, the central bank was in a more or less similar situation as the APP guidance noted that purchases were intended to run until the end of March 2017, or beyond, if necessary. The ECB then decided to lengthen asset purchases, but also to "recalibrate" the monthly amount (from €80bn/month to €60bn/month) in order to adapt to the changing/improving economic reality. A similar approach could well be followed tomorrow or at the latest on the October meeting.
Expectations for some modification of the current pace of asset purchases increased immediately after a speech by ECB President Draghi in Sintra (June 27) in which he noted that "As the economy continues to recover, a constant policy stance will become more accommodative, and the central bank can accompany the recovery by adjusting the parameters of its policy instruments - not in order to tighten the policy stance, but to keep it broadly unchanged". However, Mr Draghi also referred to financial conditions in that speech, suggesting the alternative view that he could use the argument of a stronger euro as making policy less accommodative.
Whether Mr Draghi is forthcoming tomorrow or not, we expect the ECB to extend purchases until the end of June 2018 or beyond if necessary with a reduction of asset purchases from €60bn/month to €30bn/month taking effect from the start of 2018. Regardless of the preferred monetary stance, lowering the monthly amount of bond purchases is also becoming necessary for technical reasons as the ECB is in danger of running into issue(r) limits for several EMU countries.
This phased process of policy normalization can then be stepped up next year with the ECB signaling at the end of Q1 2018 that APP won't be extended beyond June 2018 and preparing markets for a first rate hike in Q4 2018.
Strong growth, but tame inflation
The mix of strong EMU growth momentum and tame inflation readings both warrants and allows the ECB room for manoeuvre to implement a gradual and well signalled path for ending APP, but not suddenly hitting the brakes. EMU Q2 GDP growth remained above trend (0.6% Q/Q) while the EMU composite PMI now records 55+ readings for seven months running. New GDP forecasts from the ECB should reflect those developments, especially in 2017/2018. Strong activity data are accompanied by an improving labour market, even if some slack remains.
There's less optimism from the inflation front. Headline CPI rose to 1.5% Y/Y in August, and although it has trended higher over the past year core inflation remains lacklustre at 1.2% Y/Y. The euro's appreciation since the ECB's June projections (+/- 4% on a trade-weighted basis) suggests that next year's inflation forecast could be cut further, despite the positive effect from stronger GDP expectations. ECB President Draghi will therefore reiterate that "a very substantial degree of monetary accommodation is still needed for underlying inflation pressures to gradually build up and support headline inflation developments in the medium term."
Curve steepening and correction euro?
We return to the December 2016 policy meeting in order to assess the potential market impact from the scenario outlined above. The market reaction was dovish: the German yield curve steepened (lower ST yields, higher LT yields), the euro lost ground and equities profited after Draghi explained the future of APP.
A new steepening of the German yield curve is likely, but this may be a little less than was the case in December. First of all, because the ECB in December changed some technical parameters of APP. One of them was the inclusion of bonds with a 1-2 yr maturity. Second, (rate) markets are now positioned more dovishly than they were on the eve of the December 2016 policy meeting. The Euribor 3m strip curve trades 10 to 20 bps lower on tenors between 2018 and 2022. Both factors suggest that the downward potential of short term German yields is much lower than the 6 bps drop we witnessed in December last.
That said, in order to cause German short term yields to significantly increase, the ECB would probably have to change its forward guidance ("we expect rates to remain at their present levels for an extended period of time, and well past the horizon of our net asset purchases") which we only expect to happen in Q1 2018.
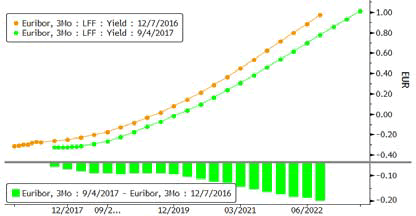
Euriobor 3m strip curve: Markets more dovish positioned than ahead of December 2016 ECB meeting
The German 10-yr yield currently trades around similar levels to 9 months ago. A further reduction in bond purchases could push longer term yields again higher, especially against the background of strengthening growth.
The December 2016 meeting started the euro's dive to the current cycle low (EUR/USD 1.0350 area) around the turn of the year. The recent nature of the climb to current levels (EUR/USD 1.19) suggests that euro bulls could take some chips off the table in the outlined scenario, resulting in a more neutral FX market positioning and consolidation. The downside of EUR/USD seems nevertheless limited given already relatively dovish rate expectations. Dollar positive news is necessary to trigger a more sustained correction lower.
Extending the APP-programme would also fit in the central bank's recent warnings/concerns on euro strength. ECB July Minutes remarked that "concerns were expressed about the risk of the exchange rate overshooting in the future". Draghi will probably again put the onus on the single currency's strength to avoid an unwarranted rise. However, he will also need to be careful not to give the impression that the ECB wants to manage the exchange rate.
EURUSD Cracks Weekly Pivot
The EURUSD pair has continued to gain bullish trading momentum during Wednesday's European session, with price-action now moving comfortably above the euro's weekly pivot point, located at the 1.1918 level.
So far, the single currency has found strong intraday resistance from the 1.1950 level, ahead of the release of U.S ISM non-manufacturing and PMI services data.
The EURUSD remains strongly bullish while trading above the 1.1918 level, with buyers now aiming to take price above the 1.1979 level.
Key intraday technical resistance is located at 1.1960, 1.1979 and 1.2000. Above the 1.2000 level, traders will focus on a series of daily time-frame price closes above the key 1.2030 level.
To the downside, intraday technical EURUSD support is located at 1.1918, and the daily pivot point, at 1.1910.
Below 1.1900, the 200-hour moving average is located at 1.1897, with the monthly pivot offering further support, at 1.1884.