
Sample Category Title
BoC: Robust Data Drives Poloz to Tighten
Markets had put the odds of a rate hike this morning at about 50/50, but in the event, the Bank of Canada increased its key overnight lending rate 25bp, to 1.00%. Unsurprisingly, the short statement accompanying the decision struck a decidedly hawkish tone.
Recent economic data have been stronger than the Bank of Canada expected, and growth is seen as becoming "self-sustaining". Strength in all major expenditure categories, except housing, has left the level of output above the Bank's previous expectations. Global growth is seen as becoming more synchronized, although uncertainties persist.
That statement did acknowledge that excess capacity remains in labour markets, and that wage and price pressures are more subdued than historical relationships would suggest.
The Bank of Canada ultimately decided that the removal of some of the "considerable" monetary stimulus was warranted, but added that future rate moves are not predetermined, and will depend on how incoming data and financial market developments are likely to affect the path for inflation. Moreover, the Bank also acknowledged the level of the loonie, and the sensitivity of the economy to rising rates in the context of elevated indebtedness.
Key Implications
Today's decision could have easily gone either way, but the robust run of economic growth left the Bank of Canada moving to remove some of the stimulus right away, rather than waiting for the communication opportunities that would have been afforded at their next decision, six weeks from now.
Indeed, Canada's economy has been coming in hot of late, with emergency level interest rates no longer warranted. While an argument could be made that holding off a few weeks for the opportunity to more fulsomely explain how the outlook for the economy has evolved, this clearly did not hold sway in Ottawa today.
Interestingly, the short statement included an explicit reference to the recent appreciation of Canadian dollar (which rose further in the wake of the announcement, resulting in a roughly 3% rise against the U.S. dollar over the past month, or a nearly 14% climb from the April low). This somewhat unusual inclusion suggests that currency moves will be monitored closely as part of the data dependency expressed again today.
Indeed, the evolution of the outlook will be crucial for the future path of the policy interest rate. With slowing but still above-potential growth likely, this implies that absent a significant shock, today's rate increase will be part of a larger and longer march towards interest rate normalization.
BoC Hikes Rates, Flatfoots the Market
BoC flat footed the market and hiked +25 bps to +1% on stronger growth data.
Canadian Q2 data warranted the removal of "considerable" stimulus from the economy.
This marked the second consecutive meeting that the BoC has increased its main interest rate, after being on hold for seven years.
The market had expected Governor Poloz to leave its policy rate unchanged, while signalling gradual rises over the coming quarters. Recent indicators, such as Q2 GDP rose by a whopping + 4.5% annualized rate in the April-to-June period, support "the bank's view that growth in Canada is becoming more broadly-based and self-sustaining ."
The loonie quickly printed a new two-year high (C$1,2140) outright following the surprise rate hike.
The chance of a rate hike today was viewed as a coin toss. The BoC noted that geopolitical risks and uncertainties around international trade have led to a weaker U.S dollar, while helping to appreciate the Canadian dollar.
U.S. Trade Deficit Broadly Unchanged in July
The U.S. international trade deficit remained broadly unchanged in July, widening slightly to $43.7 bn (market consensus $44.6bn). June's data was revised very little, with the trade deficit slightly smaller than previously reported ($43.5 bn versus $43.6 bn previously).
After two months of gains, exports fell back 0.3% on a month-on-month (m/m) basis in July. Declines in automotive (-4.4%) and consumer goods (-4.1%) worked to offset gains in food and beverage (+3.0%) and capital goods (+2.1%). Services exports fell 0.2% in July, the first monthly decline of 2017.
Imports declined for the third consecutive month in July, falling 0.2% m/m. Declines in automotive (-2.7%) and industrial supplies (-1.7%) worked to offset gains in food and beverage imports (+1.7%) and capital goods (+2.4%). Service imports were unchanged.
Adjusting for price changes, export volumes fell 0.6%, partially reversing gains in the past two months. The volume of imports was unchanged in July.
Trade deficits with its major trading partners shifted in composition in July, as the widening in the trade deficit in dollar terms with Canada was more than offset by a narrowing of the trade deficit with Mexico. On a year-to-date basis, U.S. maintains the largest trade deficits with China (-$204 bn), Europe (-$96.3 bn), and Mexico ($-41.2 bn).
Key Implications
Today's trade report erases some of the optimism on exports that the past two trade reports implied for the third quarter. Nevertheless, given a continuation of subdued growth in import volumes, net trade is on track to contribute positively to economic activity for the third consecutive quarter. Strong global demand is likely helping to boost foreign demand for U.S. goods, and a weaker U.S. dollar in trade-weighted terms should provide some support in upcoming months.
Hurricane Harvey will likely contribute to volatility in trade statistics in upcoming months, particularly concerning petroleum imports and refinery exports. However, any trade-related impacts are likely to be contained to the third quarter.
NAFTA renegotiations are just one of a few uncertainties that cloud the outlook for trade. Recent media reports suggest that NAFTA renegotiation is proceeding at a slower than anticipated pace, leaving it highly uncertain that the U.S. administration can conclude negotiations before year-end. Moreover, threats of a complete withdrawal from NAFTA, even if only temporary, only works to layer further uncertainty upon a world dealing with elevated geopolitical tensions. Policy and economic uncertainty has been linked to a lower propensity of businesses to invest in new machinery and equipment. As such, it implies that a prolonged period of uncertainty may in fact be deterring firms from making the necessary investments to improve their productivity.
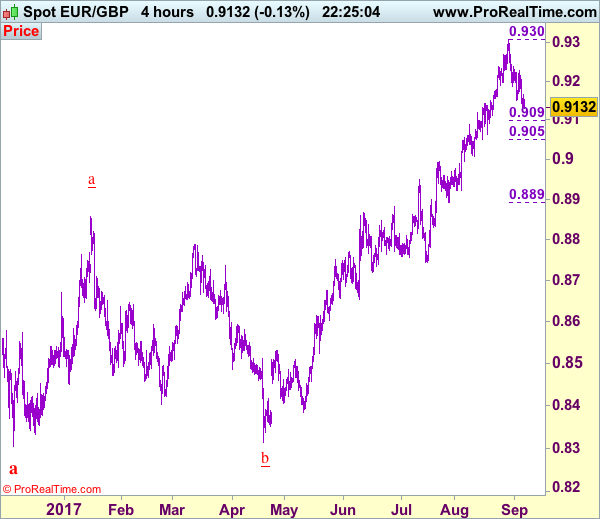
Trade Idea: EUR/GBP – Sell at 0.9210
EUR/GBP - 0.9136
Original strategy :
Sell at 0.9265, Target: 0.9115, Stop: 0.9305
Position : -
Target : -
Stop : -
New strategy :
Sell at 0.9265, Target: 0.9115, Stop: 0.9305
Position : -
Target : -
Stop : -
As euro’s retreat from 0.9307 (last week’s high) has kept price under pressure, adding credence to our view that temporary top has possibly been formed there and consolidation with mild downside bias is seen for correction of recent upmove to 0.9095-00 (50% Fibonacci retracement of 0.8892-0.9307, however, near term oversold condition should prevent sharp fall below 0.9050 (61.8% Fibonacci retracement) and price should stay well above support at 0.9008.
In view of this, we are inclined to sell euro on recovery as 0.9210-20 should limit upside. Above 0.9240-50 would suggest low is formed instead, bring a stronger rebound to 0.9270 but only above said resistance at 0.9307 would revive bullishness and extend recent upmove to 0.9325-30 and possibly towards 0.9350, however, loss of upward momentum should limit upside and price should falter below 0.9390-00.
Our preferred count is that, after forming a major top at 0.9805 (wave V), (A)-(B)-(C) correction is unfolding with (A) leg ended at 0.8400 (A: 0.8637, B: 0.9491 and 5-waver C ended at 0.8400. Wave (B) has ended at 0.9413 and impulsive wave (C) has either ended at 0.8067 or may extend one more fall to 0.8000 before prospect of another rally. Current breach of indicated resistance at 0.9043 confirms our view that the (C) leg has ended and bring stronger rebound towards 0.9150/54, then towards 0.9240/50.
Canada’s Trade Deficit Narrowed But Still Wide in July
Highlights:
- Canada's nominal merchandise trade deficit improved to $3.0 billion in July.
- Much of both a 4.9% export drop and 6.0% import drop reflected lower prices although both also declined in volume terms.Non-energy export volumes were down from a year-ago for the first time since February. Import volumes were still up 5.0% from last July with the year-over-year gain led by the equipment components.
Our Take:
The July deficit improved slightly more than markets expected ahead of the report but the $3.0 billion shortfall is still historically large. Part of a 1.6% drop in July export volumes reflected transitory factors with traditional July factory shutdowns in the auto sector lasting longer than usual this year. Nonetheless, the drop leaves early risk that export growth in Q3 will retrace at least part of a 10% (annualized) Q2 gain with non-energy export volumes falling below year-ago levels for the first time since February. The import picture was more encouraging. Overall import volumes fell 2.5% in July but with most of the drop from a large 33% decline in the often-volatile aircraft component. Overall import volumes were still up 5.0% from a year ago. That increase subtracts from the net trade balance but is a positive indicator for domestic demand. Import growth has been encouragingly led by Industrial and electrical equipment imports which both rose further in July and were up 13% from a year ago. That provides further evidence that business investment growth in the first half of the year extended into Q3.
Weakness in exports - were it to persist - could be a concern for the Bank of Canada but the data is volatile and the import data remains consistent with a stronger domestic economic backdrop, particularly for business investment. We continue to think the economy looks strong enough to absorb further rate hikes, although we expect the next 25 basis point increase will come in October rather than in the Bank of Canada's rate announcement later this morning.
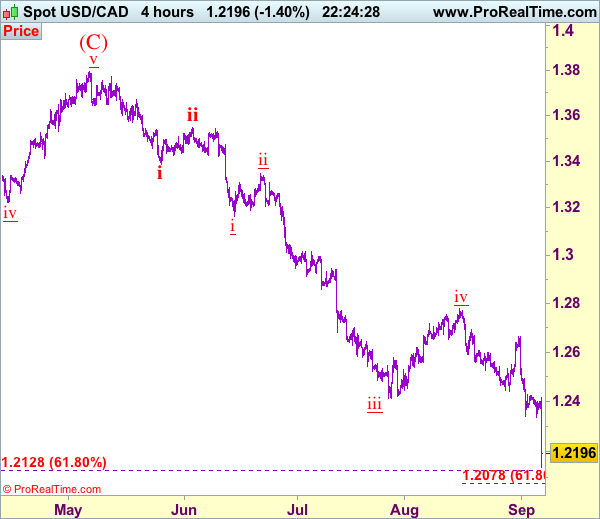
Trade Idea: USD/CAD – Sell at 1.2285
USD/CAD - 1.2206
Trend: Down
Original strategy :
Sell at 1.2490, Target: 1.2340, Stop: 1.2550
Position: -
Target: -
Stop: -
New strategy :
Sell at 1.2285, Target: 1.2100, Stop: 1.2345
Position: -
Target: -
Stop:-
Current selloff adds credence to our bearish view that recent decline is still in progress and downside bias remains for this wave v of larger degree wave iii to extend weakness to 1.2125-30, then 1.2100, however, near term oversold condition should prevent sharp fall below 1.2075-80 (61.8% projection of 1.3547-1.2414 measuring from 1.2778) and price should stay above psychological support at 1.2000, bring rebound later. We are keeping our count that wave v as well as wave (C) ended at 1.3794 and impulsive wave (i ii, i ii) is now unfolding with minor wave iii ended at 1.2414, followed by wave iv correction ended at 1.2778, wave v has reached our initial downside target at 1.2200 and may extend to 1.2100.
In view o this, would not chase this fall here and would be prudent to sell on recovery as 1.2290-00 should limit upside. Above 1.2335-40 would defer and risk a stronger rebound to 1.2390-00 but only break of resistance at 1.2429 would signal low is formed, bring retracement of recent decline to 1.2490-00.
To recap, wave B from 1.3066 is unfolding as an a-b-c and is sub-divided as a: 1.2192, b: 1.2716 and wave c is a 5-waver with i: 1.1983, ii: 1.2506, extended wave iii with minor iii at 1.0206, wave iv ended at 1.0781 and wave v as well as wave iii has ended at 0.9931, hence the subsequent choppy trading is the wave iv which is unfolding as (a)-(b)-(c) with (a) leg of iv ended at 1.0854, followed by (b) leg at 1.0108 and (c) leg as well as the wave iv ended at 1.0674. The wave v is sub-divided by minor wave (i): 0.9980, (ii): 1.0374, (iii): 0.9446, (iv): 0.9913 and (v) as well as v has possibly ended at 0.9407, therefore, consolidation with upside bias is seen for major correction, indicated target at 1.3700 and 1.4000 had been met and further gain to 1.4700 would be seen later.
Canadian Dollar Soars on Surprised BoC Rate Hike
Canadian Dollar soars sharply in early US session after BoC shocked the markets by raising overnight rate by 25bps to 1.00%. Correspondingly, the Bank rate is lifted to 1.25% and deposit rate to 0.75%. While there were speculations of a rate hike, markets generally believed that BoC will hold their hands till October, as it has just raised interest rate back in July. Nonetheless, after the rate hike, BoC remains open to further tightening It noted that "future monetary policy decisions are not predetermined and will be guided by incoming economic data and financial market developments as they inform the outlook for inflation." Meanwhile, it doesn't sound concerned with strength of the Canadian Dollar as it is "reflecting the relative strength of Canada's economy."
BoC noted that "recent economic data have been stronger than expected, supporting the Bank's view that growth in Canada is becoming more broadly-based and self-sustaining." While BoC still anticipate moderation of growth in second half, "the level of GDP is now higher than the Bank had expected." Inflation remains below 2% target but recent pick up is "consistent with the dissipating negative impact of temporary price shocks and the absorption of economic slack." Overall, given the stronger-than-expected economic performance, Governing Council judges that today's removal of some of the considerable monetary policy stimulus in place is warranted.
Germany piles up pressure for ECB stimulus exit
Just ahead of the highly anticipated ECB policy decision and press conference. Germany is piling up pressure for the central bank to start exiting its massive stimulus. German Finance Minister Wolfgang Schäuble said that "unusual monetary policy implies it is not usual or normal - we should get back to a normal monetary policy." And he also pointed out that "we have come back to a normal situation much quicker than people thought."
Deutsche Bank chief executive John Cryan called on the central bank to end the ultra low interest rate policy. He urged in a conference that "the era of cheap money in Europe should come to an end – despite the strong euro." He pointed out that "the real economy is doing well, the market is expecting I think an increase in interest rates or a reduction in the negative nature of interest rates… Let's start doing that."At the same time, ECB's policies has battered bank's profitability for some time. And Cryan said that "it can't be forever that deposit taking is a loss making… for banks."
UK post immigration plan attracts criticism
In UK, the leaked document regarding the government's post-Brexit immigration plan attracted much criticism from businesses. The chief executive of the British Hospitality Association, Ufi Ibrahim, warned that "if these proposals are implemented it could be catastrophic for the UK hospitality industry." Director general of Food and Drink Federation said that "if this does represent the government's thinking it shows a deep lack of understanding of the vital contribution that EU migrant workers make – at all skill levels – across the food chain." Manufacturers' organization EEE's director of employment and skills said "we would have grave concerns that at lower skill levels accessing EU workers will be on a completely different basis." CBI managing director for people and infrastructure Neil Carberry urged that "an open approach to our closest trading partners is vital for business, as it attracts investment to the UK."
A draft document on UK's plan for post-Brexit immigration system was leaked to the Guardian and published. The proposals in the document are to be endorsed by ministers and subject to negotiation with EU. But it's also triggered much controversies as some believed that it targets low skilled EU migrants. Some MPs reacted furiously to the document as criticized it as a "mean and cynical approach". Chair of the home affairs select committee Yvette Copper said the document "seems to contradicts the home secretary's decision just over a month ago". Meanwhile, German MEP Elmar Brok, who's one of European Parliament's Brexit officials, warned that the proposal will " increase the lack of credibility and deepen mistrust". It would make it even harder to reach agreement on divorce by October.
Form currency head Watanabe urges BoJ not to be caught by 2% target
In Japan, former currency head at the Finance Ministry, Hiroshi Watanabe, said that there is no reason for BoJ to wait for inflation to hit target before exiting stimulus. And he criticized that BoJ is "caught on its own trap by insisting inflation has to exceed 2 percent on a consistent basis." He pointed out that the 2% target "isn't legally binding", and it's not something BoJ should "strictly adhere to". He said that "just as an endless intravenous drip becomes ineffective, monetary policy should be changed to reduce stimulus once the economy is no longer facing any headwinds." And that would create a "buffer for future needs". Watanabe emphasized that "there is absolutely no reason to deter such a decision by saying we have to wait for inflation to reach 2 percent."
On the data front
US ISM services rose to 55.3 in August, up from 53.9 but missed expectation of 55.5. Trade deficit widened slightly to USD -3.7b in July. Canada trade deficit narrowed to CAD -3.0b in July. Labor productivity dropped -0.1% qoq in Q2. Eurozone retail PMI dropped to 50.8 in August. German factory orders dropped -0.7% mom in July. Japan labor cash earnings dropped -0.3% yoy in July. Australia GDP grew 0.8% qoq in Q2, in line with expectation.
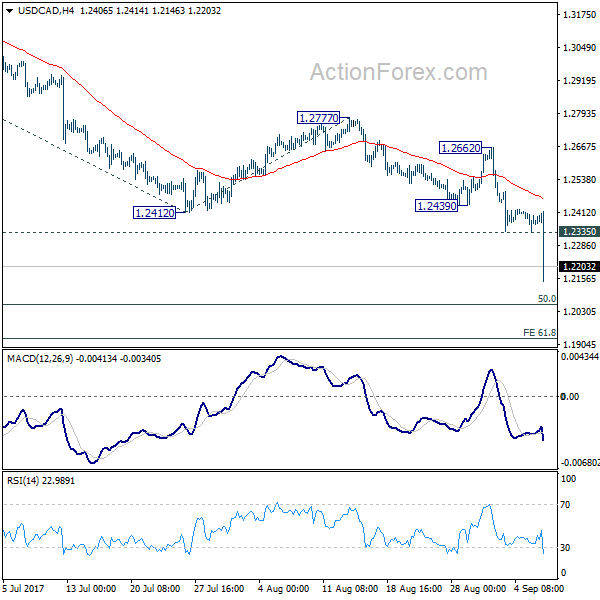
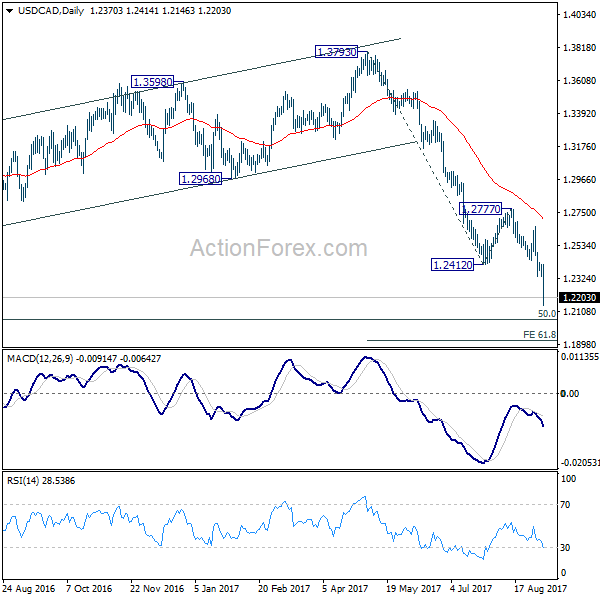
USD/CAD Mid-Day Outlook
Daily Pivots: (S1) 1.2333; (P) 1.2375; (R1) 1.2415; More....
USD/CAD dives to as low as 1.2146 after BoC rate hike, as recent decline extends. Intraday bias stays on the downside. Fall from 1.3793 should target target next long term fibonacci level at 1.2048. Downside momentum as seen in daily MACD is picking up again. Firm break of 1.2048 will carry larger bearish implication and target 61.8% projection of 1.3793 to 1.2412 from 1.2777 at 1.1924 next. On the upside, above 1.2335 minor resistance will turn intraday bias neutral first. But out look will remain bearish as long as 1.2662 resistance holds.
In the bigger picture, price actions from 1.4689 medium term top are seen as a correction pattern. Such corrective fall is expected to extend to 50% retracement of 0.9406 to 1.4869 at 1.2048. At this point, we'd look for strong support from there to contain downside and bring rebound. Break of 1.2777 resistance will indicate reversal and turn outlook bullish for 1.3793 key resistance. However, sustained break of 1.2048 will dampen this view and carry larger bearish implications and bring deeper decline to 61.8% retracement at 1.1424 and below.
Economic Indicators Update
| GMT | Ccy | Events | Actual | Forecast | Previous | Revised |
|---|---|---|---|---|---|---|
| 00:00 | JPY | Labor Cash Earnings Y/Y Jul | -0.30% | 0.50% | -0.40% | |
| 01:30 | AUD | GDP Q/Q Q2 | 0.80% | 0.80% | 0.30% | |
| 06:00 | EUR | German Factory Orders M/M Jul | -0.70% | 0.20% | 1.00% | 0.90% |
| 08:10 | EUR | Eurozone Retail PMI Aug | 50.8 | 51 | ||
| 12:30 | CAD | Labor Productivity Q/Q Q2 | -0.10% | 0.90% | 1.40% | 1.30% |
| 12:30 | CAD | International Merchandise Trade (CAD) Jul | -3.0B | -3.8B | -3.6B | -3.8B |
| 12:30 | USD | Trade Balance Jul | -43.7B | -44.6B | -43.6B | -43.5B |
| 13:45 | USD | US Services PMI Aug F | 56 | 56.9 | 56.9 | |
| 14:00 | CAD | BoC Rate Decision | 1.00% | 0.75% | 0.75% | |
| 14:00 | USD | ISM Services/Non-Manufacturing Composite Aug | 55.3 | 55.5 | 53.9 | |
| 18:00 | USD | Federal Reserve Beige Book |
(BOC) Bank of Canada Increases Overnight Rate Target to 1 Per cent
The Bank of Canada is raising its target for the overnight rate to 1 per cent. The Bank Rate is correspondingly 1 1/4 per cent and the deposit rate is 3/4 per cent.
Recent economic data have been stronger than expected, supporting the Bank's view that growth in Canada is becoming more broadly-based and self-sustaining. Consumer spending remains robust, underpinned by continued solid employment and income growth. There has also been more widespread strength in business investment and in exports. Meanwhile, the housing sector appears to be cooling in some markets in response to recent changes in tax and housing finance policies. The Bank continues to expect a moderation in the pace of economic growth in the second half of 2017, for the reasons described in the July Monetary Policy Report (MPR), but the level of GDP is now higher than the Bank had expected.
The global economic expansion is becoming more synchronous, as anticipated in July, with stronger-than-expected indicators of growth, including higher industrial commodity prices. However, significant geopolitical risks and uncertainties around international trade and fiscal policies remain, leading to a weaker US dollar against many major currencies. In this context, the Canadian dollar has appreciated, also reflecting the relative strength of Canada's economy.
While inflation remains below the 2 per cent target, it has evolved largely as expected in July. There has been a slight increase in both total CPI and the Bank's core measures of inflation, consistent with the dissipating negative impact of temporary price shocks and the absorption of economic slack. Nonetheless, there remains some excess capacity in Canada's labour market, and wage and price pressures are still more subdued than historical relationships would suggest, as observed in some other advanced economies.
Given the stronger-than-expected economic performance, Governing Council judges that today's removal of some of the considerable monetary policy stimulus in place is warranted. Future monetary policy decisions are not predetermined and will be guided by incoming economic data and financial market developments as they inform the outlook for inflation. Particular focus will be given to the evolution of the economy's potential, and to labour market conditions. Furthermore, given elevated household indebtedness, close attention will be paid to the sensitivity of the economy to higher interest rates.
Information note
The next scheduled date for announcing the overnight rate target is October 25, 2017. The next full update of the Bank's outlook for the economy and inflation, including risks to the projection, will be published in the MPR at the same time.
Canada’s Trade Deficit Narrowed in July
Canada's trade deficit narrowed to $3.0B in July (from $3.8B in June), as the 6% drop in imports outpaced the 4.9% decline in exports. In real terms, imports were down 2.3%, while exports slid by 1.1%.
The decline in exports was widespread, led by aircraft (-18%) and motor vehicles and parts (-10%). Metal ores and non-metallic minerals (+12%) was the only commodity group to record a rise during the month.
The drop in imports was also broad based, with aircraft (-35%), metal ores and non-metallic minerals (-19%) and energy products (-15%) all recording double digit declines during the month.
Canada's trade surplus with the U.S. widened to $2.9B in July (from $1.8B), as imports (-6.7%) fell more than exports (-3.2%). Canada's trade deficit with the rest of the world rose to $5.9B (preciously $5.6B) as exports were down 10% and imports slid 4.7%.
Key Implications
Export volumes have fallen for two consecutive months now, which provides a weak handoff for the third quarter. Overall, Q3 growth is tracking about 2.4% now. This is a marked deceleration from the robust 4.5% seen in Q2, but is still a solid pace of growth.
Going forward, while the recent strength in the Canadian dollar, which has pushed just above 80 US cents, has somewhat reduced competitiveness of Canadian exporters, demand for Canadian-made goods should gain some support from healthy U.S. economic growth. Of course NAFTA negotiations pose some risk to the future trade relationship between Canada and the U.S., however, it appears as though a deal is still a long way off.
All told, the Canadian economy is still going strong and we expect the Bank of Canada to continue its rate hiking cycle. While a move is possible this morning, we expect the Bank will hold off until October.
CAC Ticks Higher as Investors on Sidelines Ahead of ECB Decision
The CAC index continues to have a quiet week. Currently, the index is at 5,094.30, up 0.15% on the day. On the release front, German Factory Orders dropped 0.7%, well off the forecast of a 0.2% gain. Eurozone Retail PMI edged lower to 50.8 points. On Thursday, the ECB holds a policy meeting and will release a rate statement, followed by a press conference with ECB President Mario Draghi. As well, France publishes Trade Balance and the eurozone releases Revised GDP.
The streaking euro remains close to the symbolic 1.20 level, and has gained 13% against the dollar in 2017, with two main reasons for the appreciation. First, economic growth has rebounded this year, led by robust growth in Germany. Second, there is increasing speculation that the ECB will taper its asset purchase program (QE), which is scheduled to terminate in December. The ECB is yet to decide what to do next, and analysts do not the details of the new program to be announced until October or possibly December. ECB policymakers must weigh competing interests – Germany would like nothing more than the ECB to simply exit the program, which was brought in as an emergency measure to begin with. However, France and other eurozone members, which are not enjoying German-style growth, favor a gradual tapering of the program, perhaps lowering monthly asset purchases from EUR 60 billion to EUR 45 billion. The stronger euro is equivalent to a raise in interest rates and has resulted in monetary tightening, so the ECB may favor a slow exit. Aside from the headache of a stronger euro, ECB policymakers must wrestle with the dilemma of a stronger economy that remains gripped by very low inflation. Will the ECB address these concerns at the Thursday meeting? Any hints about a change in monetary policy could have a sharp impact on European stock markets.
Britain's departure from the European Union promises to have a significant impact on the Eurozone financial sector, and stock markets will also be affected. One issue under discussion relates to clearing houses based in Britain, specifically over euro-denominated trades. The European Commission is working on a draft law that would see joint supervision between the EU and Britain over such transactions, but France wants the European Securities and Markets Authority (ESMA) to have greater authority, such as a veto, over these transactions. This is one more example of the immense difficulty in untangling the British financial sector from the continent, and there will likely be intense wrangling between the two sides at the Brexit negotiations. as Britain tries to minimize the damage to London, which is set to lose its status as the premier financial hub in Europe.