Sample Category Title
Market Morning Briefing: We Maintain Our Target Of 0.81 On The Aussie
STOCKS
Dow and shanghai looks bullish for the near term. The other indices are trading near crucial reisstnace and support levels ad may taje a few more sessions to decide further course of direction.
Dow (21807.64, +0.25%) is holding above the immediate support as visible on the 3-day charts. While the index remains above 21600, we could see some stable sideways consolidation in the next few sessions.
Dax (12214.54, +0.75%) shot up ahead of the ECB meeting today. But as mentioned earlier, unless a sustained rise above 12200 is seen, we would have to consider a re-test of lower levels of 12000-11900 in the near term. A sustained upmove above 12200 could take it higher towards 12400.
Nikkei (19430.19, +0.37%) continues to trade above long term support near 19000, coming up from levels near June’16. A fall towards 19000 may take a few more sessions before we see a bounce back from there towards 19800 in the longer run.
Shanghai (3371.18, -0.42%) is eventually headed upwards targeting 3400 and higher in the near term. Price looks bullish just now.
We warn caution on Nifty (9916.20, -0.36%). Currently expecting a downside of 9700-9675 to hold in the medium term, the index may bounce back from there to keep the uptrend on. A break below 9750-9675 could initiate a sharp fall for the coming weeks. The Index could take a couple of sessions more to decide on that. Till then wait and watch.
COMMODITIES
Gold (1338) is hovering around its near term support of 1335 with no directional bias. As it is slowly getting overbought, a quick fall towards 1303 could be seen upon a breach of 1335 levels. Similarly Silver (17.98) is also trading within the narrow range of 16.90-18.25. The price is well supported by copper but a fall below 16.90 could open up much lower levels of 16.50 as well. Today we have ECB press conference at 6.00 pm IST which might add some more clarity into the price action of bullion.
Copper (3.15) is trading within the trading range of 3.12-3.26. The only concern in the short term overbought condition which could be resulted short term profit taking anywhere between 3.12-3.26 levels. But we will remain bullish on copper while it is trading above 2.88 levels in the medium term time frame.
We have U.S crude oil inventory data today at 8.30 pm with an expectation of a surplus of 4.1MB. We need to be cautious as a major surplus might cause drastic fall in the whole energy pack. Brent (54.08) is trading within the bullish channel of 50-55.60 since June 17 and we will remain bullish while it is trading above 50 regions on a weekly closing basis. But if you look at WTI (49.08), it is still within the bearish channel of 45-50 since march and a surplus in inventory could drag the price towards its support.
FOREX
Although the overall uptrend in the Euro (1.1924) remains intact, the upmove seems to be slowing down. If the ECB is again ambivalent on when the "taper" is likely to start, the market might offload some of the Euro Long positions it holds. The 1.1870-50 Support is crucial.
We also note that the German-US 10Yr Spread (-1.76%) trades lower, instead of rising towards -1.70%.
Our target of 92.00 on Dollar Index (92.19) was met yesterday. Although the overall downtrend remains in force while below 92.50, we are sensitive to chances of a reversal, given that there is Support also in the 92.00-91.40 region.
Dollar-Yen (109.11) saw a high near 109.40 in the US session yesterday. This decreases the chances of a breake below 108.25-15 and opens up chances of a fresh rise towards 110.
Cited Support at 129.00 has held well on the Euro-Yen (130.09) yesterday, producing a bounce from 129.35. Further upside from here towards 131 is possible, but will need a positive stimulus from the ECB (if it announces a date for the "taper") in order to rise further from here.
The Pound (1.3045) seems to be maintaining its recent strength after seeing a high of 1.3082 yesterday. A Week Close above 1.31 can lead to a further rise towards 1.33.
We maintain our target of 0.81 on the Aussie (0.7988) while the Support at 0.7950 holds.
The Chinese Yuan (USDCNY 6.5246) trades quiet now. Dollar-Rupee (62.10) came off from a high near 64.26 yesterday. It may well test 64.05-00 today.
INTEREST RATES
The benchmark US 10Yr yield (2.09%) is trading within the range of 1.97-2.12 . It could possibly touch 1.97 regions but that will be a highly oversold territory , thus we are not expecting further downside beyond 1.97 regions.
EUR/USD is hovering around above 1.1900 regions as the The German-US 2 Yr Spread (-2.10%) and the German-US 10Yr Spread (1.76%) are looking stable.Besides we have ECB press conference today at 6.00 pm IST, which may add some clarity towards the future price action in Euro.
Japan 10Yr yield (0.01%) is hovering near 0.00 regions while the 30Yr (0.81%) and the 5Yr (-0.14%) are almost stable at the time of this writing. No directional clarity so far but definitively yields are consolidating at these levels.
The UK 5Yr and 30Yr Gilt Yields (5Yr 0.44% and 30Yr 1.58%) had moved lower towards their respective supports. The UK 10Yr (1.02%) also failed to breach the immediate resistance of 1.8% and dipped a bit.
Bank Of Canada Hikes Rates And USD/CAD Snaps
USD/CAD tumbled to a fresh yearly low for 2017 as the Bank of Canada hiked their benchmark interest rate to 1.00%.
As we've been discussing on the blog, this shift in market positioning was expected to continue throughout the remainder of the year as Governor Stephen Poloz continues to take a hawkish stance in any forward guidance published from the bank. This also comes as the normalasation (god I love that word) of monetary policy appears to be on course as we head through the back half of the year and beyond.
Remember on Tuesday when we last blogged the following USD/CAD setup? Price retested support and then…
Then:
“USD/CAD 4 Hourly:
“I've used a 4 hourly chart on this occasion, simply because it clearly shows the swing low levels that we've been watching for previous support to possibly turn to resistance.”
“As long as price is below the daily support level, the intraday zone that I've marked with the thinner lines is the key level to look for a turn.”
Now:
USD/CAD 4 Hourly:
Beige Book Indicates Increased Momentum in Q3, but Highlights Harvey-Related Disruptions
Today's Beige Book indicated that economic expansion across all Federal Reserve Districts progressed at a modest to moderate pace in July and August. This is an advancement from the last Beige Book that cited a slight to moderate expansion across districts. Despite this, several firms in the path of Hurricane Harvey, along the Gulf Coast, were forced to postpone activity, namely in the production of oil and natural gas as well as fuel refining and petrochemicals.
Household spending continued to be a significant contributor to growth with non-auto retail sales and tourism being key components. The one weak spot continues to be auto sales which have displayed lackluster performance this year after peaking in 2016. Retailors are remaining upbeat, with spending activity likely to remain robust and support economic activity going forward. This will be helped by rising incomes alongside consumer and business loans that were noted as growing modestly in most Districts.
Prices rose modestly with input and materials costs leading the way. Notably, steel, lumber and freight prices rose. However, producers reported that increases in input prices exceeded any rise in selling prices eroding their profit margins.
Low inventory levels of residential property continued to restrain sales and are leading to robust home price gains. However, homebuilding activity increased slightly overall, indicating some relief for homebuyers is on the way after a prolonged period of flat residential construction activity. While higher mortgage rates may further put pressure on activity, this should be offset by rising incomes.
Employment growth slowed on balance, with a slight to modest pace of hiring cited in most Districts. Labor scarcity is increasingly presenting employers with challenges in the recruitment and retention of workers of all skill levels. This was especially prevalent in the manufacturing and construction industries. Despite labor market tightness, the majority of Districts reported limited wage pressures with modest to moderate wage growth. A select few firms in the Dallas and San Francisco Districts indicated that pressures were beginning to push wages up.
The manufacturing sector, which is reported as being one of the two tightest labor markets, looks to be turning a corner, with several firms planning expansions. The weakness in vehicle sales translated into concerns for auto manufacturers, but most other manufacturing industries expanded modestly on balance. Most manufacturers reported that sales had expanded in line with their targets and expectations for future sales were positive. However, capital spending continues to hinge on policy outcomes for some producers. For example, an electrical equipment manufacturer in the Boston District noted that political pressures had led them to reduce offshoring of production, thereby leading the firm to increase spending on automation.
Key Implications
Businesses were generally optimistic, with transitory complications as a result of Hurricane Harvey noted as being substantial roadblocks during the quarter for those located along the Gulf Coast. Importantly, the manufacturing and construction sectors appear to be gaining momentum alongside the consumer, with investment likely to follow. This will mark the end of a period of deferred investment related to the caution that has prevailed following the election.
The upbeat tone of this Beige Book indicates that economic growth has gained momentum halfway through the third quarter. Although Hurricane Harvey is expected to shave 0.1-0.4 ppts. off growth in Q3, a rebound in Q4 is expected to leave the second half of the year largely unchanged on balance. Household consumption will be central to the strength GDP with income growth crucial for solidifying the continued important role of the consumer.
While so far producers are seeing their margins eroded, the increase in input prices reported should in the near future lead to higher inflation, as they begin to pass on past input price increases. Additionally, wage pressures were reported to have begun to mount in a few Districts, a trend that will likely proliferate in the coming months and will also support the inflation outlook. Next week's CPI report will shed more light on the extent to which increases in producer input prices translated through to inflation. This will be of key importance to the Fed that will need to see improvement on this front in order to proceed with a hike in December as we expect.
(FED) Beige Book – September 6, 2017
National Summary
This report was prepared at the Federal Reserve Bank of Chicago based on information collected on or before August 28, 2017. The information included in the District reports was primarily collected before Hurricane Harvey made landfall on the Gulf Coast. However, some Districts received preliminary information from business contacts regarding the impact of the storm, which is compiled in a special paragraph in the national summary.
This report summarizes comments received from contacts outside the Federal Reserve System and is not a commentary on the views of Federal Reserve officials.
Overall Economic Activity
Economic activity expanded at a modest to moderate pace across all twelve Federal Reserve Districts in July and August. Consumer spending increased in most Districts, with gains reported for nonauto retail sales and tourism, but mixed results for vehicle sales. Capital spending also increased in several Districts. Manufacturing activity expanded modestly on balance. That said, reports were mixed regarding auto production, and contacts in many Districts expressed concerns about a prolonged slowdown in the auto industry. Both residential and commercial construction increased slightly overall. Low inventories of homes for sale continued to weigh on residential real estate activity across the country, while commercial real estate activity increased slightly. Activity in the energy and natural resources sector was generally positive prior to shutdowns arising from Hurricane Harvey. Agricultural conditions were mixed overall, with drought conditions reported in multiple Districts. Business and consumer loan demand grew at a modest pace in most Districts, with a number of banks reporting rising competition from both other banks and non-bank lenders.
Employment and Wages
Employment growth slowed some on balance, ranging from a slight to a modest rate in most Districts. Labor markets were widely characterized as tight. There were reports of worker shortages in numerous industries, most notably in manufacturing and construction. Firms in the Atlanta, St. Louis, and Minneapolis Districts said that they had turned down business because they could not find the necessary workers. Many Districts indicated that businesses were having difficulty filling openings at all skill levels. In spite of the tight labor market, the majority of Districts reported limited wage pressures and modest to moderate wage growth. That said, there were reports from firms in the Dallas and San Francisco Districts that labor shortages were pushing up wages.
Prices
Prices rose modestly overall across the country. Input and materials costs generally increased, most notably for freight, lumber, and steel. In contrast, movements in energy and agricultural commodity prices were mixed. A number of Districts indicated that pass-through to downstream prices was limited, with increases in input prices exceeding gains in selling prices. Home prices moved up overall, as low inventories put upward pressure on prices in many regions.
A Special Note on the Impact of Hurricane Harvey
Hurricane Harvey created broad disruptions to economic activity along the Gulf Coast in the Dallas and Atlanta Districts, although it was too soon to gauge the full extent of the impact. Many firms and organizations in the affected areas closed due to flooding. A fifth of the oil and natural gas production in the Gulf of Mexico was offline, and many onshore producers in the Eagle Ford region temporarily stopped production. Harvey also affected fuel and petrochemical production, forcing fifteen refineries in the region to shut down temporarily and several others to operate at reduced capacity. Some areas experienced gasoline shortages, and supply was expected to remain tight in the Southeastern United States because of pipeline disruptions. Contacts in the Richmond District indicated that spot freight prices jumped after the storm, as freight was being redirected around the country. The Port of Charleston expected increased volumes in coming weeks as freight traffic is routed away from the Port of Houston.
Highlights by Federal Reserve District
Boston
Business reports indicated that revenues at most manufacturing and retail firms continued to expand modestly to moderately. Staffing firms, however, cited revenue declines, which they blamed on limited labor supplies. Prices were stable and wages were up very little. Residential real estate markets were constrained by inventories. Respondents continued to cite a positive outlook.
New York
Economic growth picked up to a moderate pace in recent weeks, and labor markets remained tight. Input prices continued to rise moderately, while selling prices were flat to up modestly. Housing markets strengthened, whereas commercial real estate markets were steady.
Philadelphia
Economic activity resumed a modest pace of growth, with trends improving for nonauto retail sales, new home construction, and nonresidential construction and leasing. Manufacturing growth softened and auto sales declined further. Other sectors continued to grow modestly. On balance, employment and wages continued to grow modestly, and prices resumed a modest pace of growth.
Cleveland
Business activity picked up to a moderate pace during the past few weeks. Manufacturers and construction contractors saw rising payrolls and wage pressures. Higher wages were attributed to growing employee turnover. Motor vehicle production trended lower at District assembly plants. The trucking industry was concerned about the effect of electronic logging requirements on freight capacity.
Richmond
The economy continued to expand modestly. Reports on consumer spending and real estate and construction were not as consistently positive. Manufacturers noted stronger new orders, and ports and freight haulers were seeing increased volumes. Lending was up slightly while nonfinancial services firms saw moderate growth. Labor markets improved moderately and prices rose modestly.
Atlanta
Economic activity rose modestly since the previous report. Labor markets remained tight but wage growth was unchanged. Retailers, excluding auto dealers, noted an increase in sales levels. Home sales increased and prices continued to rise modestly. Credit remained readily available for qualified borrowers.
Chicago
Growth slowed to a modest pace. Employment, consumer spending, business spending, and manufacturing production all grew at modest rates, while construction and real estate activity increased slightly. Wages and prices rose modestly. Conditions were little changed in the financial sector and worsened some in the agricultural sector.
St. Louis
Economic activity improved at a modest pace. Contacts continue to hold a generally optimistic outlook for the remainder of 2017. District bankers continued to report moderate growth in demand for new loans and a modest uptick in delinquency rates.
Minneapolis
Economic activity grew modestly. Consumer spending was mixed, but tourism was having a good summer season. Manufacturing continued on an upward trend, and residential construction saw growth that likely would have been stronger if not for tight labor, which was holding back employment in general. Home sales lagged in most regions due to low inventories, and drought was negatively affecting farmers.
Kansas City
Economic activity in the Tenth District increased modestly. Manufacturing and other business services expanded at a moderate pace, and energy activity continued to increase modestly. Consumer spending was mostly flat, with modest growth expected. Agricultural conditions weakened, but at a slower pace, and farm income and farmland values remained subdued.
Dallas
Economic activity grew moderately. Activity in the energy sector held steady, and contacts expected the rig count to stay flat or dip through year-end. Manufacturing output strengthened, and growth in retail sales accelerated, in part due to a rebound in auto sales. Crop prices were generally below breakeven levels.
San Francisco
Economic activity continued to expand at a moderate pace. Overall price inflation was flat, while upward wage pressures intensified and labor market conditions tightened further. Growth in consumer and business services remained strong. Activity in the manufacturing sector expanded at a moderate pace. Activity in the residential real estate sector remained robust. Lending activity expanded modestly.
Federal Reserve Bank of Boston
Summary of Economic Activity
Business contacts indicated that economic activity in the First District expanded modestly to moderately through mid-summer, with both retailers and manufacturers mostly reporting increases in revenues compared with a year earlier. Most staffing firms, by contrast, cited revenue declines attributed to tight labor supply. Commercial real estate markets were mixed across the region, with little change in leasing fundamentals and some loosening of commercial sales markets. Residential real estate markets in the region continued to experience increases in prices and declines in sales. Most responding firms cited a positive outlook.
Employment and Wages
Despite labor supply falling short of demand in many cases, wage pressures continued to be modest. Retailers' hiring plans were said to be in line with planned store expansions and they cited "not much" wage pressure. All nine manufacturing contacts this round indicated that employment was flat or increasing. All but one of the manufacturers who commented on the ability to recruit said that they were not having any trouble hiring and replacing workers. Two manufacturing respondents said they were forgoing cost-of-living increases this year. Among staffing firms, all contacts reported high demand for labor and tight labor supply. Demand for skilled labor has been strong, but contacts said many job applicants fall short on requested training; some suggested that clients needed to moderate their expectations. Likewise, low-skill labor supply has not met demand, with two firms citing public assistance as a challenge to recruitment, given the low wages in these positions. All responding staffing firms reported rising pay rates.
Prices
Prices were generally reported to be stable. Retailers reported that prices on most items remained steady. Restauranteurs said that while there were some small price increases on food, some menu prices have gone up more, in the 2.5 percent range. Manufacturing contacts mostly reported stable prices, and a manufacturer of dairy products said that pricing had been "exceptionally stable" in the last two years; a commercial aviation contact said they continue to feel strong downward price pressure from big customers despite record aircraft sales.
Retail and Tourism
Retail contacts consulted for this round reported that their most recent year-over-year comp store sales results ranged from low single-digit decreases to low single-digit increases. One contact noted that younger adults tend to make more purchases online, leading to fewer in-store sales, and two contacts attributed recent sales increases or decreases in part to changes in customer traffic. The outlook for the remainder of 2017 is positive.
A contact in the Massachusetts restaurant industry reported that restaurant revenues through June were up about 3.6 percent from a year earlier. Restaurants in tourist areas such as the Berkshires, Cape Cod, and Boston's North Shore have experienced severe staffing shortages, especially those that have historically relied on seasonal workers needing H2B visas. This labor shortage has had a negative effect on revenues in what is traditionally the high summer tourist season. There is also concern among many Massachusetts restaurant owners that the just-signed law "Further Regulating Employer Contributions to Health Care" imposes substantial penalties on employers whose (non-disabled) employees obtain health coverage through MassHealth (Medicaid, CHIPS) or receive subsidized coverage through the state's health insurance exchange.
Manufacturing and Related Services
Of the nine manufacturing firms contacted, all reported sales in line with their expectations. Sales were up for seven respondents, while two reported changes near zero. Strong areas included commercial aviation and semiconductors. One semiconductor contact reported a year-on-year increase in sales in the second quarter in excess of 30 percent but cautioned that semiconductors are notoriously cyclical. A manufacturer of electrical equipment described the last two years as an "industrial recession" and said that we are now in a recovery.
Only one contact reported a major revision to capital spending plans. The dairy firm said that capital spending was up more than 40 percent last year as they expanded alternatives to traditional dairy products such as almond milk. A manufacturer of electrical equipment said that political pressure had led them to reduce off-shoring to Mexico and China and to increase spending on factory automation.
All respondents said the outlook was positive. A manufacturer of test equipment said that uncertainty about the federal budget and shutdowns was a cause for concern.
Staffing Services
Staffing services contacts in New England gave mixed reports on current revenue growth, with the majority of firms seeing an overall decline year-on-year, which they attribute in large part to difficulty recruiting candidates. Skilled labor markets, particularly in health care and IT, have been strong sources of revenue among contacts, buoying businesses more concentrated in these sectors. All respondents remained optimistic but said they were less optimistic than three months ago. Most anticipate only slight improvement in revenue growth from this quarter to next.
Multiple firms cited the current political situation as a negative influence on hiring; health care reform was singled out as a source of instability, as job applicants now seek employer-based coverage as their top job benefit. All contacts said they are adapting to the tight-supply landscape through targeted recruitment including an expanded online presence, a better referral process, active community engagement, and building stronger relationships with job market candidates.
Commercial Real Estate
Commercial real estate markets remained somewhat mixed across the First District. Contacts reported that leasing activity was very slow in both Hartford and Portland, modest in Providence, and moderate in Boston. In both Portland and Providence, limited inventories in the office and industrial sectors were seen as restraints on leasing activity. However, a Portland contact noted that demand for office space was also soft. Leasing fundamentals were mostly flat across the region, with the exception that office rents increased modestly in Providence and rose slightly in Boston.
Commercial real estate sales fell modestly in Boston and Portland and remained light elsewhere in the District. Prices for premier office properties in Boston were stable despite a modest decline in the number of interested buyers. Maine saw an uptick in retail vacancies and retail property foreclosures. Throughout most of the District, investor demand for industrial properties remained robust, and banks bid aggressively to lend to industrial buyers. At the same time, some banks required more equity on loans for construction of new apartments. One new hotel project was proposed in the Portland area, which reportedly has enjoyed a strong summer tourism season. The outlook among contacts was mostly unchanged, and contacts were cautiously optimistic on balance.
Residential Real Estate
Residential real estate markets in the First District continued recent trends of supply shortages and price increases. For single-family homes, all areas but New Hampshire and Vermont reported moderate decreases in closed sales (New Hampshire data refer to changes from June 2016 to June 2017; the other areas reported July-to-July changes). Pending sales generally increased. For condos, closed sales were down in Boston, Connecticut and Vermont. Persistent upward pressure on prices was observed across the region, with median sales prices increasing in all states except Vermont for both single-family homes and condos.
Low inventory prevails. On a year-over-year basis, all reporting areas experienced a sharp decrease in inventory for both single-family homes and condos. A contact pointed out that varying rules across cities and towns created regulatory difficulties for home builders.
Contacts expressed concern about the decline in sales, noting that as prices increase, potential sellers become wary about finding new listings elsewhere and may be less likely to list their homes. Nonetheless, some contacts expect the market to become more active with the prospect of rising interest rates.
For more information about District economic conditions visit: www.bostonfed.org/regional-economy
Federal Reserve Bank of New York
Summary of Economic Activity
Economic activity in the Second District has picked up somewhat since the last report, expanding at a moderate pace, and labor markets have remained tight. Input prices continued to rise moderately, while selling prices were flat to up modestly. Manufacturers noted a brisk pickup in business activity, while service-sector businesses reported more moderate gains. Consumer spending expanded modestly since the last report, tourism picked up somewhat, and consumer confidence has remained close to a cyclical high. Housing markets were somewhat stronger, though sales volume in many areas has been restrained by a dearth of homes on the market. Commercial real estate markets were generally steady. New residential construction activity has slowed slightly, while commercial construction has been flat. Banks reported some tightening in credit standards on commercial mortgages.
Employment and Wages
The labor market has remained tight. One New York City employment agency reports further strengthening in the labor market, with brisk hiring in the usually slow summer months. However, a major agency in upstate New York and another downstate both characterize the market as steady. Businesses across a broad array of industries have been reporting widespread difficulty finding qualified workers--particularly in rural areas.
Manufacturers reported that hiring activity has been subdued and some have scaled back hiring plans for the months ahead. Businesses in the transportation and information sectors reported some pickup in hiring, while those in retail trade and leisure & hospitality noted steady to slightly lower employment. Businesses in other service industries report little change in staffing levels.
Overall, wages have risen modestly, though contacts in retail, education & health, information, and real estate report more widespread wage hikes. One employment agency maintains that employers have become more negotiable on both compensation and required skill sets.
Prices
As in the last report, businesses indicated that input prices rose moderately. Businesses in wholesale trade, education & health, and leisure & hospitality noted modest growth in selling prices, while those in other sectors indicated little change.
General merchandise retailers reported that prices have been steady, on balance, and New York City hotels indicated little change in room rates. Broadway theaters, on the other hand, continued to report 10-13 percent gains in ticket prices from a year earlier.
Consumer Spending
Retailers reported that sales have been a bit firmer in recent weeks. One major chain reports that sales picked up and have been running ahead of plan in July and the first few weeks of August. Similarly, retailers in upstate New York have seen some pickup in both traffic and sales in recent weeks. Inventories were generally reported to be in good shape.
Auto dealers in upstate New York reported that sales of new vehicles were steady at high levels in July and early August and were up from comparable 2016 levels. Vehicle inventory levels have come down somewhat but are still higher than desired. Used vehicle sales have been steady to up moderately, while prices have softened somewhat. Retail and wholesale credit conditions were characterized as being in good shape.
Consumer confidence in the Middle Atlantic states (NY, NJ, PA) has retreated from its multi-year high set during the spring but has remained at a high level.
Manufacturing and Distribution
Manufacturers reported that business activity has expanded at an increasingly brisk pace since the last report. Contacts in the transportation industry, however, continued to report modest growth, while those in wholesale trade noted that activity was generally flat. Looking ahead, manufacturers remained broadly optimistic about the near-term outlook, while those in transportation and wholesale trade expressed a more moderate degree of optimism.
Services
Businesses in most service industries reported some pickup in business activity. Contacts in both professional & business services and education & health services noted modest increases in activity. Service sector businesses were generally optimistic about the near-term outlook, except in the leisure & hospitality industry. Broadway theaters reported stronger than usual attendance and revenues for the summer months. In New York City, while tourism has picked up somewhat, advance bookings for the months ahead have been softer.
Real Estate and Construction
Housing markets across the District have been mixed but, on balance, a bit stronger. Real estate contacts in upstate New York report that low inventories of homes on the market have restrained sales activity but have driven prices to new highs, with homes often selling for above the asking price. Low inventories and rising demand have also started to push home prices up in the suburbs around New York City--except at the high end of the market, where there remains an excess supply. New York City's condo and co-op market has been mixed; home prices have risen at a roughly 5 percent annual rate in Brooklyn and Queens but have been flat in Manhattan. Here too, an oversupply at the high end has kept that segment of the market soft. Sales activity has picked up, as sellers have cut prices, especially at the high end.
Rental markets have also been mixed. In New York City, effective rents have drifted down--face rents have been flat, while landlord concessions have increased. Thus far, these rising concessions have kept vacancy rates from rising. In northern New Jersey and parts of upstate New York, rental markets have been fairly robust, with rents rising steadily.
Commercial real estate markets have been mixed but steady, on balance. The market for office space has softened a bit in upstate New York and Long Island but tightened modestly in New York City. The market for industrial space, which had been tightening for quite some time, appears to have lost some momentum. Availability rates were steady near multi-year lows in downstate New York and northern New Jersey but edged down to new lows in upstate New York. Still, industrial rents have continued to rise, running 8-10 percent above comparable 2016 levels.
Single-family home construction has been subdued--except at the high end of the market--while new multi-family development has slowed. While there continues to be a good amount of multifamily construction in progress throughout the District, new starts have slowed considerably, except in northern New Jersey. Similarly, new commercial development has largely ground to a halt, except in northern New Jersey, where new construction starts for both office and industrial space remain fairly brisk.
Banking and Finance
Small to medium sized banks in the District reported that loan demand was steady overall but mixed by category--weaker demand for consumer loans and residential mortgages, no change in demand for commercial mortgages, and higher demand for C&I loans. Bankers also noted a moderate decrease in refinancing activity. Some tightening in credit standards was reported for commercial mortgages, but no change was indicated for other loan categories. Contacts reported lower spreads of loan rates over cost of funds for residential mortgages and C&I loans. Finally, banks reported steady delinquency rates across all loan categories.
For more information about District economic conditions visit: www.newyorkfed.org/data-and-statistics/regional-data-center/index.html
Federal Reserve Bank of Philadelphia
Summary of Economic Activity
Aggregate business activity in the Third District resumed a modest pace of growth during the current Beige Book period--a bit stronger than during the prior period--but reports were mixed by sector. Manufacturing, nonfinancial services, new home sales, and tourism grew modestly; nonresidential construction and leasing appeared to grow slightly; nonauto retail sales and new home construction activity exhibited essentially no growth; and auto sales declined modestly. These trends were an improvement over the prior period for nonauto retail sales, new home construction, and nonresidential construction and leasing; they were less positive for manufacturing and more negative for auto sales. On balance, employment, wages, and prices continued to grow at a modest pace. Overall, firms appear to anticipate continued modest growth over the next six months with a somewhat larger percentage of firms expecting growth.
Employment and Wages
Employment has continued at a modest pace of growth, although reports of net additions to staff were somewhat less than the prior period for both manufacturing and nonmanufacturing firms. Average hours worked also dipped over the period for manufacturing firms but held steady among nonmanufacturers.
On balance, wage growth held steady at a modest pace. Staffing firms and other contacts generally reported steady wage growth and an occasional lack of labor availability for specific jobs. In particular, Pennsylvania staffing firms continued to note difficulties finding qualified, committed workers, while demand for labor continued to grow. One staffing firm added to its own staff in order to keep pace.
Prices
On balance, price levels rose modestly. Although reports were mixed, over two-thirds of the contacts responding indicated no change at all in prices paid and prices received. Prices appeared to hold firmer for raw inputs to and intermediate goods from manufacturers, while fewer firms reported increases for prices received for their own goods sold.
Retailers and banking contacts generally noted no signs of inflation, while homebuilders continued to report high lumber costs. Overall, existing home prices continued to edge up with some variance across markets and price categories.
Looking ahead one year, firms anticipate a 2.25 percent increase in prices received for their own goods and services--unchanged from one quarter prior. Firms also reported expectations of nearly 2.6 percent annual inflation for consumers--a bit higher than last spring.
Manufacturing
On balance, manufacturing firms edged back to a modest pace of growth in general activity after nearly six months at a moderate pace. Firms reported somewhat slower overall growth of new orders and shipments than during the prior period; however, growth rates appeared to begin picking up late in the period.
The makers of paper products, chemicals, fabricated metal products, industrial machinery, and electronic products continued to note gains in new orders and shipments; firms in the lumber and primary metal sectors reported declines in activity.
Generally, manufacturing contacts continued to expect growth over the next six months. The percentage of firms expecting future increases rose for general activity and capital expenditures, and held steady for employment.
Consumer Spending
As physical stores continued to struggle, nonauto retail contacts reported little change in sales, on balance--an improvement over the modest declines of the prior period. In late reports from traditional malls, declining apparel sales pulled overall sales negative in June, although remaining segments were up. An outlets operator reported a summer resurgence and good back-to-school sales through the current Beige Book period. Convenience store contacts noted a "tough" July and a weak start to August.
Auto dealers throughout the region reported that the slight year-over-year sales declines of the prior period had deepened to a modest rate during the current period, although the level of sales remains high. Prices are very competitive and manufacturers are providing significant dealer incentives to move inventory. Dealers expect manufacturers to back off production next year.
Tourism held steady at a modest pace, although mountain resorts appeared to make greater gains than the shore locations this summer. Strong gains were reported from the Poconos and from Amish country, while a Delaware shore contact noted concerns about shorter stays and more cautious spending, and Atlantic City's July casino revenues fell relative to July 2016. A Philadelphia analyst noted that demand exceeded expectations, locally and nationally, and that international tourism seems to have held steady.
Nonfinancial Services
Service-sector firms continued to report modest growth in general activity for the period as a whole, but as with manufacturers, reports of sales and shipments began to strengthen late in the period. Expectations about future growth have increased somewhat since the prior Beige Book period and remained positive with nearly 60 percent of the firms anticipating increased activity.
Financial Services
Financial firms reported modest growth of overall loan volumes (excluding credit cards)--a bit faster than the slight growth that had occurred during the prior Beige Book period. Auto loans and other consumer loans exhibited moderate growth in loan volume. Commercial real estate and mortgages grew modestly, while home equity loan volumes were essentially flat. Commercial and industrial loan volumes declined again. Credit card volumes are highly seasonal--they grew at a modest rate during this Beige Book period, but at a somewhat higher rate in the comparable year-ago period.
Banking contacts tended to describe economic growth as slow and steady. Several noted a small increase in shale gas drilling activity; others pointed to gains stemming from renewed global activity. On balance, loan portfolios were considered healthy, with low delinquencies and no significant signs of concern.
Real Estate and Construction
Homebuilders generally reported little change in a market that has oscillated between slight growth and slight decline in activity in recent months. The four weeks around Labor Day are typically slow for traffic and contract signings. Production problems continued to include labor availability, labor costs, and lumber prices.
Brokers in most major Third District housing markets continued to report modest growth of existing home sales, but no increase of inventories. Several contacts noted a pickup of second home purchases in vacation areas, but this trend appears modest so far.
Nonresidential real estate contacts reported slight growth in construction activity, which had been flat last period; individual markets do vary by sector and geography. Leasing activity also appeared to grow slightly, at best. One contact reported that the industrial market was holding up nicely, but that two spec buildings have taken longer to lease up than has been the case recently. Contacts also reported that the Philadelphia office market was getting tighter, with steady demand being met mostly by changing space utilization and shifting locations within the region's footprint rather than by new office construction. The rental market is shifting in favor of landlords.
For more information about District economic conditions visit: www.philadelphiafed.org/research-and-data/regional-economy
Federal Reserve Bank of Cleveland
Summary of Economic Activity
Aggregate business activity grew at a moderate pace in the Fourth District since our last report, an improvement from the modest growth seen in the prior period. Labor markets expanded, with wage pressures reported primarily in the construction, manufacturing, and energy sectors. Upward pressure on prices paid was prevalent in the construction industry. Freight carriers and construction contractors increased billing rates and reported little pushback. Consumer spending at brick-and-mortar establishments rose slightly, while new motor vehicle sales strengthened. Manufacturing activity grew slightly overall, but production at District motor vehicle assembly plants trended lower. Nonfinancial services firms saw moderate gains in activity. Year-to-date residential real estate unit sales stayed above year-ago levels and selling prices were higher. Activity in the commercial real estate market remained elevated.
Employment and Wages
District payrolls continued to expand, although at a slower pace than in the previous reporting period. Staffing increases were notable in the manufacturing and construction sectors. In contrast, energy firms and brick-and-mortar retailers described payrolls as flat. Several industrial products manufacturers filled openings that had previously been left vacant, or they created new positions because of rising demand and an improving outlook for sustained business growth. Construction contractors reported a shortage of experienced labor, making it difficult to fill newly created positions. To be in compliance with newly enacted electronic logging regulations, freight carriers anticipate adding drivers in order to maintain capacity. Wage pressures were felt primarily in the construction, manufacturing, and energy sectors in response to employee turnover. Mid-year wage increases were widespread in most other industry sectors.
Prices
Similar to the previous reporting period, upward pressure on prices paid eased somewhat when compared to that of the second quarter. Construction contractors saw rising prices for lumber, concrete, and wiring products. A few manufacturers and upstream oil and gas companies cited an upward trend in steel prices. Selling prices for products and services were stable on net. Construction contractors and freight carriers increased billing rates and reported little pushback. Contractors attributed the need to increase rates to rising labor and material costs, and an increase in demand. Some freight carriers reported that they needed to offset higher labor costs and additional equipment purchases associated with electronic logging requirements. Projections call for an additional 500,000 off-lease motor vehicles in 2017 compared to the number in 2016. This increase will drive down used vehicle prices, a situation which will likely have an impact on new vehicle sales. However, OEM incentives continue to rise and are reportedly as high as 15 percent.
Consumer Spending
Consumer spending at brick-and-mortar department stores rose slightly during the period, whereas revenue growth at specialty stores was characterized as flat or lower. Contacts reported that revenue gains from online shopping have not yet offset declines from brick-and-mortar operations. Retailers were satisfied with sales of furniture, food, and women's apparel. Purchases of electronics products remained soft. Year-to-date unit sales through July of new motor vehicles increased about 3 percent compared to those of a year ago. Auto dealers are concerned about above-normal inventories. Customers are reportedly waiting for higher OEM incentives.
Industrial Production
Overall activity in the manufacturing sector picked up slightly during the period. Factors contributing to the expansion included strong demand for construction materials, rising activity in upstream oil and gas markets, and rising exports to China. The latter was attributed to strong infrastructure spending in that country. In contrast, demand for consumer packaged products and capital goods was weaker than expected. Year-to-date production through July at District auto assembly plants declined more than 16 percent when compared to that of the same period a year earlier. Much of the decline can be attributed to retooling for three next-generation vehicles. Even with the decrease in auto production, some OEM suppliers reported satisfaction with their order books. Allocations of capital monies for plant expansion and product development rose. Many of our contacts are bullish in their outlook for the economy. However, some have tempered their outlook during the past few months, citing slowing demand from the transportation sector.
Reports through July indicated that the number of drilling rigs operating in the District increased significantly compared with that of a year ago. Natural gas output remains at historic highs. Thermal coal production declined because of reduced demand from a warmer-than-average 2016-2017 winter.
Real Estate and Construction
Year-to-date unit sales through July of new and existing single-family homes increased 1.5 percent compared to those of a year earlier. The average sales price rose almost 5 percent. A softening in the new-home market was attributed to rising list prices. Homebuilders cited a shift in buyer preference from homes in the move-up price point categories to those in the lower price points. One builder described this sudden shift as unusual. Slightly higher interest rates were not seen as a deterrent for purchasing a house. Although demand has softened, estimates of single-family construction starts for the first half of the year are more than 5 percent higher compared to those of a year earlier.
Nonresidential real estate activity generally remains at an elevated level. Building contractors reported strong backlogs, though inquiries are beginning to show signs of slowing. The highest demand was for commercial property development, including office buildings, and public infrastructure projects. Office vacancy rates are stable, and asking rents are slowly rising. A strong increase was reported in selling prices for office properties during the first half of 2017 compared to those of a year ago. Reports indicated a slowing in the construction of multifamily housing, as lenders and investors are considering pulling back from commitments to multifamily development projects. Apartment rental increases were described as moderate to strong.
Banking
Reports on commercial lending were more upbeat than in recent reporting cycles. Strongest demand was for CRE loans. Several bankers noted that customers have sufficient confidence in the current business climate to self-finance capital projects. Skittishness related to the political climate and rising competition from nonbank sources were cited as factors holding back more robust loan growth. Consumer lending was largely stable. Purchase mortgages were in high demand, while auto lending softened. Bankers reported generally improving loan quality. Loan application standards were little changed other than some tightening in auto lending.
Nonfinancial Services
Freight volume expanded along seasonal trends during the past couple of months and was relatively stable compared to that of the same period a year ago. Several contacts expressed concern about the effects of electronic logging on trucking capacity.
Professional and business services firms reported moderate gains in activity during the period. Strongest demand was seen by management consulting and software and IT services firms. Factors contributing to strong demand for the latter group include clients' concerns about cyber-security and data protection.
Federal Reserve Bank of Richmond
Summary of Economic Activity
The Fifth District economy continued to expand at a modest pace, although reports from some sectors were a little more mixed since the last report. Moderate growth in new orders and shipments was noted by manufacturing firms; ports and trucking companies reported increased cargo movements. Retail sales were mixed but mostly flat in recent weeks while tourism and travel activities were strong. Existing home sales declined slightly while new home sales and construction were said to be up modestly. Commercial leasing increased at a slightly slower pace in recent weeks; reports on commercial construction were mixed. Overall loan demand increased slightly as business lending was up modestly while residential lending was relatively flat. Services firms indicated that revenues grew moderately. Labor demand strengthened moderately and prices increased at a modest pace.
Employment and Wages
Labor demand continued to strengthen moderately in recent weeks. Compared to the previous report, employment agencies noted slightly lower levels in new job openings; however, they anticipated a significant increase during the upcoming fall recruitment months. Wage increases remained modest across all sectors, and a few firms reported increased wage pressures to retain top talent in tight labor markets. Executives reported difficulty finding qualified cybersecurity specialists, mechanics, accounting professionals, construction workers, agriculture workers, truck drivers, and customer service agents.
Prices
Overall, prices rose at a modest pace in recent weeks. According to our most recent surveys, services firms indicated that prices grew modestly, on balance. Manufacturing input prices grew a modest rate and continued to outpace final goods price growth. Contacts throughout the Fifth District specifically noted increases in prices for steel and scrap metal, fuel, and construction inputs, such as lumber and dirt. Contracted trucking prices reportedly rose moderately as capacity continued to tighten. Conversely, an architectural firm noted that increased competition over bids was driving fees down slightly. Coal and natural gas prices were unchanged or marginally lower.
Manufacturing
On balance, manufacturing firms reported moderate growth in new orders and shipments in recent weeks. Metal manufacturers continued to report improved business conditions, and computer and electronic equipment firms noted a recent pickup in new orders. Additionally, a steel producer commented that business remained very strong with order backlogs above normal levels. Expectations were generally optimistic for the next six months, as most producers anticipated modest increases in new orders.
Ports and Transportation
Cargo volumes at District ports remained robust since our last report and continued to increase modestly. Most ports were seeing growth that was in line with, or better than, expectations. However, one executive indicated that new services initiated in June had not resulted in the increase in activity he had anticipated. Growth in import volumes continued to exceed that of exports. Remarks from trucking firm executives were unusually consistent as they reported moderate increases in shipments, broad-based strength in demand, and very steady growth beginning around April. One trucking firm executive suggested that he had "the luxury" of being able to turn down business. A regional airport in the District reported that air cargo shipments were up significantly over the year and there were no signs that this growth trend was trailing off.
Retail, Travel, and Tourism
On balance, retail sales were flat to up in recent weeks, with some variation by segment. A home furnishings store reported the largest improvement in sales in the past six to seven years, although margins were down due to discounting. Clothing sales were flat to slightly up, with considerable variability from month to month. Hardware and home improvement stores saw strong sales for seasonal outdoor items, but slower growth for smaller-ticket hardware sales. An auto dealer in coastal South Carolina reported that sales had leveled off and that inventories continued to build, so he expects manufacturers to offer even more incentives in coming months.
Tourism and recreation activities were strong in recent weeks in coastal areas as well as the mountain attractions in the District. A rafting and outdoor adventures business in West Virginia experienced a record July, despite double-digit increases in many of their activity prices. In contrast, a western Virginia outdoor recreation facility reported a dip in July activity, but saw bookings picking up at a normal pace for September and October. In coastal North Carolina, visitors were up relative to last year, despite a power outage in the Outer Banks, and restaurants and retailers were busy. Modest growth in hotel occupancy was reported in western North Carolina as well as Washington, DC, although average daily rates were mostly steady.
Real Estate and Construction
Residential real estate agents reported a slight seasonal decline in home sales and noted that buyer traffic remained slow in recent weeks. Brokers reported a significant increase in first time home buyers, with one firm indicating that sixty percent of its sales were to first time home buyers. Inventories remained low, and home prices continued to rise modestly. Average days on the market remained at low levels; however, some contacts noted slight increases due to the seasonal slowdown in sales. New home construction and sales improved modestly since the previous report.
Commercial real estate leasing rose modestly in recent weeks, slowing slightly from the previously reported pace. Industrial leasing transactions generally declined, while retail leasing and sales remained strong. Office leasing remained limited; however, a few brokers reported an increase in office building sales. Vacancy rates remained low across markets. Rental rates were stable to increasing modestly, with reports of rising rate pressure in the industrial market due to lack of inventory. Commercial construction accounts were mixed. Realtors reported more industrial warehouse construction and noted an increase in speculative building, while office construction remained limited throughout the District. Reports from brokers in Virginia Beach and Columbia, South Carolina said there were fewer new multi-family developments taking shape and fewer sales in recent weeks, while agents throughout North Carolina and in Charleston, South Carolina, central Virginia, and the District of Columbia said that demand is keeping pace with new construction and new space is needed.
Banking and Finance
Loan demand grew slightly in recent weeks. Commercial real estate and business lending picked up modestly, overall, while residential real estate lending was little changed. A North Carolina lender said that recent branch expansions and a rise in deposits provided additional capital and allowed them to increase commercial and business lending. Interest rates were little changed, on balance, as short term rates rose slightly while long term rates were flat to somewhat down. Competition among banks intensified, particularly in the residential mortgage market. A West Virginia lender reported seeing secondary market mortgage lenders offering low and no down payment mortgage loans in an effort to combat the flat demand. Historical credit quality metrics remained strong and there were no reports of changes to credit standards.
Non-Financial Services
According to our most recent survey, services firms indicated moderate revenue growth and expected demand to grow further over the next six months. Reports from firms in the administrative, education, hospitality, telecom, and warehousing services were the most consistently positive. A civil engineering firm in Maryland noted an uptick in demand in recent weeks and expected it to persist for the remainder of the year. There were fewer bidding opportunities reported for government contracts, as federal agencies relied more on large, single award agreements.
For more information about District economic conditions visit: www.richmondfed.org/research/regional_economy
Federal Reserve Bank of Atlanta
Summary of Economic Activity
According to reports from businesses across the Sixth District, economic activity expanded at a modest pace from July through mid-August. The outlook among contacts remains optimistic as most expect slow and steady growth over the remainder of the year. Businesses reported continued tightness in the labor market, though wage growth remained flat for most types of jobs. Firms cited that non-labor input costs remained steady. Reports from most retailers indicated that sales increased slightly while auto dealers noted soft sales activity. The hospitality sector continued to experience weakening activity. Residential brokers and builders cited that sales of existing and new homes were flat to slightly up from a year ago and home prices continued to rise modestly. Commercial real estate firms reported that demand continued to improve and construction increased from a year ago. Manufacturers noted that activity pulled back slightly since the previous report. Bankers indicated that credit continued to be available.
Employment and Wages
Broadly, business contacts expressed that labor demand continued to outweigh supply in fields such as information technology, construction, and healthcare. Construction industry contacts reported that the lack of available labor was still so severe that companies were turning down business opportunities. The leisure and hospitality industry experienced notable net gains in payrolls across the region; however, contacts continued to describe challenges filling positions during the summer. Some employers who rely on immigrant labor--either directly or indirectly--continued to express concerns that efforts to tighten immigration were having a tangible drag on the supply of labor. Turnover was mixed across the region; however, any time turnover occurred, firms pursued opportunities to increase operational efficiencies by evaluating whether to fold one job into another, replace position(s) with technology, and/or shift the salary towards training and development of other employees.
Firms continued to implement various methods to attract and retain top talent, often in lieu of wage increases. Contacts shared that in addition to offering flexible work hours and locations, more vacation time, and training and education opportunities, they were increasingly focused on social responsibility initiatives and support systems to encourage work-life harmony. Some contacts indicated that these non-wage compensation mechanisms were losing their effectiveness, thus broad wage increases were expected in the near term. Some firms noted increased offerings of early retirement packages in an attempt to lower overall compensation costs (replace higher-paid, tenured workers with technology or lower-paid, entry to mid-level workers). Businesses continued to report increases in starting wages to attract new hires for high-skill positions, but most contacts indicated that these increases remained in the two to three percent range.
Prices
Non-labor input costs were stable and businesses reported that pricing power remained constrained. According to the Atlanta Fed's Business Inflation Expectations survey, respondents indicated that year-over-year unit costs were up 1.7 percent in August and they expect unit costs to rise 1.9 percent over the next twelve months.
Consumer Spending and Tourism
District retail contacts reported that sales levels were higher than expected in July. Retailers noted that back to school shopping and online sales helped boost overall sales levels this period. Automotive dealers continued to report a slowdown in the momentum of auto sales from a year ago.
In general, tourism and hospitality contacts in the District reported that activity over the summer season was softer than expected, which they attributed to significant rainfall throughout the region. In most markets, hotel occupancy achieved expectations; however, average daily rates remained subdued. Many contacts noted that the outlook for the remainder of the year should be in line or slightly below forecasts made earlier in the year.
Construction and Real Estate
Reports from District residential real estate contacts in July signaled modest but continued growth. Builder reports on construction activity were mixed. Brokers and builders continued to report that home sales were flat to slightly up relative to one year earlier. The majority of contacts noted that buyer traffic was flat to slightly up and inventory levels were down from the year-ago level. Both builders and brokers continued to report modest gains in home prices. Home sales expectations remained positive in July, with most brokers and builders anticipating that sales would hold steady or increase slightly over the next three months compared to the year-earlier level. Most builders continued to expect that construction activity would match or exceed the current pace over the next three months.
Many District commercial real estate contacts reported improvements in demand that resulted in rent growth, but they cautioned that the rate of improvement varied by metropolitan area, submarket, and property type. The majority of commercial contractors indicated that the pace of nonresidential construction activity had increased from one year ago, but a growing share noted that activity was down slightly. Most contacts reported healthy backlogs. While several reports indicated that the pace of multifamily construction matched or exceeded the year-ago level, some continued to report that activity was down from one year earlier. Looking forward, District commercial construction contacts' expectations for the pace of nonresidential construction over the third quarter was mixed, while their outlook for the pace of multifamily construction continued to level off.
Manufacturing
District manufacturers indicated that overall activity expanded, but at a slower pace since the last reporting period. While overall manufacturing activity expanded, contacts reported slower growth in new orders amid modest gains in production and more tepid job gains. Supply delivery times were reported to be getting shorter, while finished inventory levels decreased. Contacts' outlook for production was relatively unchanged from the previous report, with about half expecting higher production levels over the next six months.
Transportation
Reports from District transportation contacts were little changed since the previous report. Ports continued to indicate strong growth in containerized, bulk, and breakbulk cargo. Total rail traffic remained flat. The declines in shipments of grain, petroleum and petroleum products, and metallic ores, were mostly offset by increases in nonmetallic minerals, crushed stone, sand and gravel, and coal. Year-to-date intermodal traffic, however, was up modestly. Logistics and freight forwarding contacts cited further growth in e-commerce shipments.
Banking and Finance
Credit remained readily available for most qualified borrowers. Some contacts reported mortgage activity slowed due to a limited supply of homes for sale and a decline in auto lending due to decreasing demand. Commercial loan activity was brisk and small businesses used loan proceeds to refinance or expand their business.
Energy
Contacts indicated that liquefied natural gas exports, on average, continued to increase from the Gulf Coast. Reports from energy contacts noted that completion of pipeline projects continued to add growth in capacity to the Gulf Coast. Utility contacts indicated residential usage continued to decline while overall commercial and industrial usage increased slightly.
Agriculture
Agriculture conditions across the District were mixed. Significant rainfall throughout much of the District eliminated drought conditions but resulted in many areas experiencing abnormally moist to excessively wet conditions. These heavy or frequent rains caused some crop damage and delayed planting and harvesting in parts of the District. Forecasts still indicate that the District will exceed last year's production in cotton, soybeans, and peanuts, but lower rice and corn production is expected. With harvesting completed for the current season, Florida's orange production forecast was significantly lower than last year's production. On a year-over-year basis, prices paid to farmers in June were up for cotton, beef, broilers, and eggs but were down for corn, rice, and soybeans.
For more information about District economic conditions visit: www.frbatlanta.org/economy-matters/regional-economics
Federal Reserve Bank of Chicago
Summary of Economic Activity
Growth in economic activity in the Seventh District slowed to a modest pace in July and early August, and contacts expected growth to continue at that pace over the next 6 to 12 months. Employment, consumer spending, business spending, and manufacturing production all grew at modest rates, while construction and real estate activity increased slightly. Wages and prices rose modestly. Conditions were little changed in the financial sector and worsened some in the agricultural sector.
Employment and Wages
Employment growth slowed to a modest rate over the reporting period, and contacts expected it to continue at that pace over the next 6 to 12 months. Contacts indicated that the labor market was tight and reported difficulty filling positions at all skill levels. Hiring was primarily focused on professional and technical, sales, and production workers, though there was an increase in the number of contacts hiring management and administrative workers. A staffing firm that supplies firms with IT workers said growth was strong, while a staffing firm that primarily supplies manufacturers with production workers reported a slight decline in billable hours. Wage growth was modest overall, with wage increases more likely for high-skilled occupations. Many contacts said that the cost of health insurance had increased.
Prices
Overall, prices again rose modestly in July and early August. Retail prices increased slightly, with the exception of grocery prices, which were flat after a period of steady declines. There were multiple reports of rising prices for older used cars. Many manufacturers noted an increase in raw materials costs. One manufacturing contact indicated that persistent rail delivery delays were forcing them to use more costly modes of transportation.
Consumer Spending
Consumer spending increased modestly over the reporting period. Non-auto retail sales rose slightly, led by improvements in the furniture, building materials, food and beverage, and health and personal care segments. Grocery store sales were little changed overall, though contacts reported that there was growth in delivery and pickup services. Auto dealers across the District reported a moderate increase in sales. The vehicle mix continued to shift from cars to light trucks, led by increased sales of crossover vehicles. The pace of used vehicle sales was up modestly on balance.
Business Spending
Growth in business spending slowed to a modest pace in July and early August. Retail inventories were slightly higher than desired. Manufacturing inventories were at comfortable levels overall, though a surge in steel imports led to elevated inventories at service centers. Growth in capital spending slowed to a modest pace, and contacts expected growth to continue at that pace for the next 6 to 12 months. Outlays were primarily for replacing industrial equipment, IT equipment, and renovating structures, though there was an increase in the number of contacts reporting spending for expansion.
Construction and Real Estate
Construction and real estate activity increased slightly over the reporting period. Residential construction increased modestly, with growth concentrated in the single-family segment and suburban locations. Home sales increased modestly overall, with contacts across the District indicating that low inventories of single-family starter homes were holding back growth. Growth varied by price point, with a slowdown in sales of homes under $250,000 and a pickup in sales of homes over $250,000. Growth also varied by location, with reports of a moderate increase in the Chicago area and a slight slowdown in the Detroit area. Home prices were up slightly overall. Nonresidential construction was little changed, though one contact noted decreasing demand from automotive suppliers for building new manufacturing facilities. Commercial real estate activity remained strong, edging up further on balance over the reporting period. Commercial vacancy rates declined slightly and both commercial rents and the availability of sublease space changed little.
Manufacturing
Manufacturing production growth slowed to a modest pace in July and early August. Steel production grew modestly (with increases in both domestic and international demand), and heavy machinery picked up some as well, with contacts from both sectors reporting increased demand from the energy sector. Sales for specialty metals manufacturers increased a bit, with contacts highlighting growth in the energy, aerospace, and defense sectors. Manufacturers of construction materials reported slow but steady growth in line with the pace of improvement in the construction sector. Demand for heavy trucks increased moderately, while demand for autos declined slightly.
Banking and Finance
Financial conditions were little changed on balance over the reporting period. Financial market participants noted that equity prices remain high and volatility remains low. Business loan demand slowed some, particularly from middle-market firms. The slowdown led to reports of increased competition between banks for customers and greater pressure on loan pricing and terms. In spite of lower volumes overall, contacts reported increased demand for capital equipment loans. Consumer loan demand increased slightly on balance. Demand for home and auto loans increased slightly and quality for both was little changed.
Agriculture
A lack of rainfall in July and early August hurt crops in much of Iowa and parts of Illinois and Indiana. Crop conditions and maturity lagged that of last year's bumper crop, to the point that contacts expected the corn harvest to be below trend and the soybean harvest to be at about trend. Corn and wheat prices fell, while soybean prices were flat. Given current prices, some operations will be able to make crop insurance claims and take advantage of government support programs. Dairy prices moved higher, reportedly easing losses for dairy operations. Hog and cattle prices were down, but prices were still high enough for many operations to be able to turn a profit. In addition, contacts expected that the opening of a pork processing plant in Michigan would lead to greater demand for hogs in the region.
For more information about District economic conditions visit: chicagofed.org/cfsbc
Federal Reserve Bank of St. Louis
Summary of Economic Activity
Economic conditions have improved at a modest pace since our previous report. District labor market conditions continue to improve, although employment growth has leveled in recent months as contacts report difficulties filling open positions. Price pressures remain modest, although fewer contacts reported increasing prices charged to customers in recent months. In general, business contacts surveyed in mid-August continued to hold an optimistic outlook for growth during the remainder of 2017. On net, 53 percent of contacts expect District economic conditions in 2017 to be better or somewhat better than last year. This outlook was generally unchanged since contacts were surveyed in mid-May.
Employment and Wages
Employment has increased modestly since the previous report. Of the business contacts surveyed in mid-August, on net, 29 percent reported that third-quarter employment was higher or slightly higher than a year ago. Contacts in a variety of industries continued to report difficulties finding skilled or qualified employees. Construction contacts across the District reported shortages of both skilled and unskilled workers. In addition, manufacturing contacts in Louisville noted that difficulties in finding qualified labor have led to longer lead times and an inability to fill additional orders.
Contacts reported moderate wage growth since the previous report, as tightness in the labor market has resulted in upward pressure on wages. On net, 61 percent of contacts reported wages were higher or slightly higher than a year ago, and a similar share reported increases in labor costs.
Prices
Price pressures have increased modestly since our previous report. Business contacts surveyed reported that prices charged to consumers and non-labor input costs increased modestly. On net, 22 percent of contacts reported that prices were higher than a year ago and 35 percent reported that non-labor input costs were higher than a year ago. Although prices continue to move upward, growth has slowed during the third quarter.
Reports on construction costs were mixed. Contacts in St. Louis and Louisville noted rising construction costs; however, several Little Rock contacts reported declines in construction costs. In particular, multiple contacts in the wood products sector in Arkansas reported that excess supply continues to drive down input prices.
Commodity price pressures have been mixed. Since the previous report, coal prices in Illinois, Indiana, and Kentucky have been flat. In the agricultural sector, corn prices increased modestly, while sorghum prices are unchanged. In Little Rock, cash prices of rice increased moderately. A Little Rock contact reported that soybean and wheat prices also increased. Prices of cottonseed in Memphis fell slightly, and soybean and wheat prices in St. Louis decreased moderately.
Consumer Spending
Reports from general retailers, auto dealers, and hoteliers portray a mixed picture of consumer spending activity. Although July real sales tax collections increased in Arkansas relative to a year ago, they declined in Kentucky, Missouri and Tennessee. Multiple auto dealers across the District reported a decrease in sales, which have failed to meet their expectations during 2017. St. Louis dealers indicated a shift in demand toward low-end vehicles.
Hospitality contacts in Missouri reported that business activity has increased since our previous report, whereas hoteliers in Kentucky and Arkansas indicated a decline in hotel occupancy rates.
Manufacturing
Manufacturing activity has increased modestly since our previous report, although the pace of growth slowed across the District. On net, about one-third of contacts reported that production, new orders, and capacity utilization increased in the third quarter relative to one year ago. The results are down from our previous survey, when more than half of contacts reported improvements in these areas. More contacts reported increases in capital expenditures than in the previous survey. Several companies reported new capital expenditure and facility expansion plans, including firms that manufacture food products, transportation equipment, and metal products. Contacts are less optimistic about the next quarter than in our previous report, with fewer than half expecting improvements, down from two-thirds last quarter. Some contacts expressed concerns about political uncertainty and a slowdown in the auto industry.
Nonfinancial Services
Reports of plans in the service sector have been positive since the previous report. More than two-thirds of transportation and service contacts reported that sales met or exceeded expectations in the current quarter. More than half of contacts reported higher dollar sales in the current quarter than this time last year, and slightly less than half expect sales to be higher in the next quarter than they were last year. Firms that provide transportation and information technology services reported plans to expand facilities and hire employees, particularly in the St. Louis region. Reports from healthcare firms remain mixed, but are more positive than earlier this year.
Real Estate and Construction
Residential real estate sales activity has been mixed since the previous report. Seasonally adjusted home sales for July ticked up slightly from the previous month in the District's four major MSAs. Year-to-date sales were generally in line with those from a year ago. Local real estate contacts continued to report that significant shortages in inventory have hindered sales, and, on net, nearly 40 percent of survey respondents indicated that sales fell short of expectations halfway through the third quarter. One industry contact noted that mortgage rates have been lower than expected, providing a positive impact on business.
Residential construction activity has been flat since the previous report. July permit activity dropped slightly relative to the previous month. However, most contacts reported an increase in residential construction compared with a year ago. Expectations are slightly less optimistic for the fourth quarter.
Commercial real estate activity has improved modestly since the previous report. Contacts reported relatively strong demand for most property types, particularly office and industrial. However, contacts indicated a decrease in multifamily demand relative to a year ago.
Commercial construction activity remained strong. Multiple contacts reported an optimistic outlook for the rest of 2017. Planning and development of new hotels continued throughout the District, particularly in Louisville and Memphis. Multifamily construction activity also remained robust.
Banking and Finance
Banking conditions in the Eight District have improved at a modest pace since the previous report. Loan demand rose at a moderate rate with continued signs of slight tapering. District contacts reported that commercial and industrial loan demand grew moderately relative to year-ago levels, while year-over-year auto loan demand experienced an unexpected and sharp decline. Delinquencies rose modestly across all loan categories and are expected to continue rise next quarter. Contacts reported that competition from other banks and credit unions has increased moderately, while competition from non-bank financial service providers has remained generally unchanged.
Agriculture and Natural Resources
District agricultural conditions were mixed in this reporting period. The conditions of the District's cotton and rice crops have improved since our previous report and are better than the same time last year. Although rice conditions have improved, early-season flooding pushed acreage down 25 percent from last year. The lost acreage will hurt rice farmers this year, but some of these farmers are optimistic that a recent trade agreement with China will boost profits. Meanwhile, corn and soybean conditions declined from the previous period.
Natural resource extraction conditions declined slightly from June to July, with seasonally adjusted coal production declining 3 percent. However, July production was 10 percent above a year earlier.
For more information about District economic conditions, visit: www.research.stlouisfed.org/regecon/
Federal Reserve Bank of Minneapolis
Summary of Economic Activity
The Ninth District economy grew modestly overall since the last report. Employment grew modestly, despite tight labor conditions. Wage pressure was moderate, while price pressure was modest overall. The District economy showed growth in services, real estate, manufacturing, residential construction, tourism, and energy. But consumer spending and commercial construction were mixed, and agriculture remained weak.
Employment and Wages
Employment grew modestly since the last report, despite continued tight labor conditions. Seasonally adjusted employment in July grew in a majority of District states; Minnesota added 7,700 jobs, and June job growth was also revised significantly higher. But South Dakota and Montana saw total employment dip slightly in July, due at least in part to constrained labor supply. Montana workforce development offices saw one-third fewer active job seekers in July compared with a year earlier. District-wide, initial unemployment claims dropped by 14 percent over the most recent six-week period compared with a year earlier, and continuing claims dropped 12 percent; every District state saw significant declines in both categories. In Mankato, Minn., labor is "the number one concern," according to a business source. A Minneapolis-St. Paul staffing firm said that "lots of needs go unfulfilled" and business was being turned away because of tight labor. Labor retention continued to be a problem. A South Dakota human resources consultant said most businesses were hiring, but more often "to replace turnover and retirements than to increase headcount." An ad hoc poll of ag bankers in southwestern Minnesota found that 60 percent were hiring, but the large majority were doing so because of labor turnover; 90 percent said they were having difficulty finding qualified labor.
Wages grew moderately since the last report. A South Dakota contact said there was pressure to boost wages and companies "seem to be willing to pay a bit more" for talent. A staffing contact said that the recently passed $15-per-hour minimum wage in Minneapolis--being implemented over five years--was rippling across wage expectations of workers earning below or near that level. Some wage sentiment was softer, however. The aforementioned poll of ag bankers found that two-thirds believed 2017 wage increases would be between 1 and 3 percent. A Minnesota construction company said that office personnel wages "had very modest increases this year for some, and none for others."
Prices
Price pressure remained modest since the last report. Retail fuel prices in District states increased slightly. A commercial contractor reported that construction materials prices were steady, but he was budgeting for a 2 percent increase in construction costs largely due to labor costs. Rental rates for apartments in Minneapolis-St. Paul have increased 4 to 5 percent over the last 12 months, according to industry sources, while increases in other commercial segments have been more modest, especially of late. Prices received by farmers for wheat, hay, milk, hogs, cattle, chickens, and eggs increased in June compared with a year earlier; prices for corn, soybeans, and turkeys decreased.
Consumer Spending and Tourism
Consumer spending was mixed since the last report. The most current data on statewide gross retail sales showed a decline in recent summer months in South Dakota and Wisconsin compared with a year earlier; however, sales tax revenue in North Dakota increased in July. While store closures grabbed headlines, retail expansions were also seen in many metro markets in the District. A mall manager in Minnesota reported that business was "good overall," despite the loss of an anchor tenant.
Summer tourism has been generally positive. South Dakota's annual Sturgis Motorcycle Rally saw an uptick in attendance of almost 5 percent over last year. Most regional and state fairs have seen increased attendance. Glacier National Park summer visits were up 25 percent over last year's record attendance. But attendance at other District national parks was spotty. Minnesota hotel occupancy rates in July were strong overall compared with a year earlier, but some weakness was seen in St. Cloud and northern Minnesota.
Services
Activity in the professional services industry increased moderately since the last report. Providers of data analytics for agriculture reported a jump in demand this year as farmers sought to control input costs through more precise application of fertilizer and chemicals. A Minnesota accounting and professional services firm said it was seeing "pretty significant growth" among clients looking for one-stop services. A provider of telehealth services reported that demand was increasing from rural areas.
Construction and Real Estate
Construction was mixed since the last report. Industry data suggested that spending has slowed for commercial and heavy construction in the District compared with a year ago. A southern Minnesota contractor said the company's commercial construction volume was down one-quarter from last year due to delays for several projects. However, commercial permits in July--suggestive of future activity--were higher in a majority of the District's larger cities, with the notable exception of Minneapolis. Residential building, on the other hand, saw modest but widespread growth since the last report. Increases in the number of permitted, single-family homes in July were seen in a majority of larger cities, while the Minneapolis-St. Paul region was flat but saw strong multifamily permitting. Labor shortages were reportedly holding back more construction. A Minnesota developer said his company could have built 40 to 45 homes this year, but was on track to build just 32 due to a lack of available labor.
Commercial real estate grew modestly since the last report. Industrial vacancy rates were at very low levels in Minneapolis-St. Paul, though rental rates were flat. Office vacancy rates were flat to slightly lower. Despite continued strong multifamily construction, vacancy rates in Minneapolis-St. Paul and Missoula, Mont. remained low. Residential real estate sales slowed in July compared with a year earlier. Though increases were seen in a few markets (northern Wisconsin; Missoula and Bozeman, Mont.), most markets saw declines, including a 5 percent drop across Minnesota, which was widely attributed to low inventory.
Manufacturing
District manufacturing activity increased moderately since the last report. An index of manufacturing conditions indicated increased activity in July compared with a month earlier in Minnesota and the Dakotas. An annual survey of Montana manufacturers indicated a positive outlook among respondents for production, sales, profits, and employment over the next year. A producer of precast concrete products announced a large new plant in South Dakota, and a pipe manufacturer announced a new plant in Minnesota. Several suppliers to the wind power industry described demand as strong. Contacts in agricultural equipment said that activity remained slow overall, but conditions have improved from a year ago, as demand for some types of equipment picked up and inventories dropped.
Agriculture, Energy, and Natural Resources
District agricultural conditions remained weak overall since the previous report. In spite of recent rains, severe drought conditions persisted in the Dakotas and Montana. Farmers in many areas were cutting failed cereal crops for hay, while livestock producers were selling off parts of their herds due to a lack of feed. Meanwhile, crop conditions remained much better in eastern parts of the District, and sugar beet growers in Minnesota and North Dakota were anticipating a potential record crop. Activity in the energy and mining sectors increased slightly since the last report. Montana coal production increased in recent months compared with a year earlier. District oil and gas exploration as of mid-August was flat compared with the previous report. Regulators approved a major expansion at a natural gas processing plant in the Bakken oil patch.
Federal Reserve Bank of Kansas City
Summary of Economic Activity
Economic activity in the Tenth District increased modestly in late July and August, and most sectors expected moderate growth in future months. Professional, high-tech, and wholesale trade firms reported a strong increase in sales, and manufacturing activity expanded at a moderate pace. District energy activity expanded modestly compared to the previous survey period, and bankers reported steady to improving overall loan demand, stable deposit levels, and unchanged loan quality. District real estate activity continued to increase at a slight pace, while consumer spending contacts indicated growth was unchanged since the previous survey period. Agricultural conditions weakened but at a slower pace, with subdued farm income and slightly lower farmland values. In addition, transportation contacts indicated slightly lower sales than the previous survey period. Employment and employee hours rose slightly in late July and August, and contacts in most sectors reported moderate wage growth. Input prices were up moderately over the previous survey period, while selling prices increased modestly in most sectors.
Employment and Wages
Employment and employee hours across the District rose slightly in late July and August over the previous survey period, and modest increases were expected in coming months. Contacts in the wholesale trade, professional and high-tech services, real estate, education, health services, and manufacturing sectors reported an increase in employment, while contacts in the retail trade, auto sales, transportation, restaurants, and tourism and hotels sectors noted a decline. All sectors except the auto sales and tourism sectors expected an increase in employment in the months ahead. Since the previous survey period, average employee hours rose for all sectors except the retail trade, auto sales, and health services sectors, which experienced declines. Respondents noted a shortage of commercial drivers, salespeople, and service workers.
Contacts in most sectors reported moderate wage growth, and expectations in the coming months were for strong wage growth.
Prices
Overall, input prices were up moderately compared to the prior survey period, while selling prices increased modestly and contacts expected additional price increases in the months ahead. Respondents in the retail sector reported moderately higher input and selling prices, with both expected to continue to rise moderately moving forward. Restaurant input prices grew at a moderate pace, while selling prices edged up. Selling prices in the transportation sector declined slightly, while input prices were up moderately after falling in the previous survey. Construction prices continued to expand modestly with slight increases anticipated in the coming months. Manufacturers reported slight growth in prices for finished goods, and raw material costs continued to edge higher. Manufacturers expected moderate increases in both finished goods and raw material prices over the next few months.
Consumer Spending
Consumer spending was mostly flat in late July and August, while expectations for future growth increased at a modest pace. Retail sales decreased slightly over the previous survey period, but remained above year-ago levels. Several retailers noted an increase in sales for apparel and discounted items, while higher-priced products sold poorly. Contacts anticipated sales to rise moderately in the next few months, and inventory levels were expected to increase modestly. Auto sales fell moderately, but were slightly above year-ago levels. Dealer contacts anticipated a further slowdown in sales for the months ahead. Auto inventories were expected to rise slightly heading forward. Restaurant sales increased strongly and were well above year-ago levels. Contacts expected a moderate increase in activity heading forward. District tourism activity decreased slightly in late July and August, and was lower than a year ago. Tourism contacts expected activity to fall further heading into the fall months.
Manufacturing and Other Business Activity
Manufacturing activity expanded at a moderate pace in late July and August, and the majority of other business contacts reported moderate sales increases. Manufacturers reported sustained moderate growth in production, particularly for metals, aircraft, and electronics products. Shipments, new orders, and order backlog grew at a solid pace, and activity was higher than a year ago. Manufacturers' capital spending plans rose moderately, and firms' expectations for future activity remained favorable.
Outside of manufacturing, professional, high-tech, and wholesale trade firms reported strong sales increases, while transportation contacts indicated slightly lower sales than the previous survey. All firms expected a strong improvement in sales in the next six months. Professional, high-tech, and wholesale trade firms reported strong capital spending plans, while transportation firms anticipated a slight decrease in capital expenditures heading forward.
Real Estate and Construction
Overall District real estate activity continued to increase at a slight pace in late July and August. Residential home sales were flat since the previous survey period, and contacts anticipated no change in the coming months. Sales of low- and medium-priced homes continued to outpace sales of higher-priced homes. Residential home prices and inventories were modestly higher than the previous survey period. Residential construction activity continued to expand at a slight pace, as construction supply activity remained flat while new home starts and traffic of potential buyers rose. Expectations for overall residential construction activity were for a modest increase in the months ahead. Commercial real estate activity continued to expand modestly, as absorption, completions, construction underway, sales, and prices rose, while vacancy rates declined. Commercial real estate activity was expected to continue to increase at a modest pace moving forward.
Banking
Bankers reported steady to improving overall loan demand for the month of August. A majority of respondents indicated a stable demand for commercial and industrial, commercial real estate, agricultural, and consumer installment loans. Demand for residential real estate loans was mixed among respondents. Most bankers indicated loan quality was unchanged compared to a year ago. In addition, most respondents expect loan quality to remain essentially the same over the next six months. Credit standards remained largely unchanged in all major loan categories. Finally, a majority of respondents reported stable deposit levels.
Energy
Energy activity rose at a modest pace since the last survey period, and expectations for future activity remained positive. The number of active oil and gas drilling rigs increased modestly across the District, particularly in Oklahoma. With rising rig counts and relatively stable oil and gas prices, oil and natural gas production is projected to continue to increase in the District's Niobrara and Anadarko shale regions through September. Natural gas activity has picked up modestly since the last survey period, particularly in the Arkoma basin in Oklahoma.
Agriculture
The District farm economy continued to soften since the previous reporting period, but the pace of the decline slowed somewhat. Crop prices decreased modestly in late July and August due to an increase in production expectations for the year. Livestock prices also declined modestly and some cattle feedlots reported modest losses. Although District contacts continued to report a decrease in farm income and loan repayment rates, the pace of the decline was slower than in recent periods. The continued decline in farm income again pushed farmland values lower, but only slightly, as values also appeared to stabilize in some parts of the District. In general, agricultural credit conditions continued to weaken and were expected to decline further in coming months.
For more information about District economic conditions visit: www.KansasCityFed.org/Research/RegionalEconomy
Federal Reserve Bank of Dallas
Note: The information included in this report was collected before Hurricane Harvey made landfall in Texas.
Summary of Economic Activity
The Eleventh District economy continued to expand at a moderate pace over the past six weeks. Manufacturing output strengthened, and activity in nonfinancial services increased. Growth in retail sales accelerated, in part due to a rebound in auto sales. Home sales rose slightly, but office leasing activity was mixed. Loan volumes expanded, while demand for oilfield services was flat. Crop conditions remained mostly favorable. Employment, wages and prices increased. Outlooks remained positive, although several contacts expressed concern that policy-related uncertainty would impact the broader economy.
Employment and Wages
Overall employment rose, and wage pressures were similar to or up slightly from the previous reporting period. Reports of labor shortages were widespread across sectors, particularly for skilled workers. Manufacturers added to payrolls, with some contacts noting that labor shortages were pushing up wages. The construction labor market generally remained tight. Hiring in the services sector continued, but employment in retail was flat. Hiring in the upstream energy sector slowed, and some firms were considering reducing staff in the second half of the year. Airlines also noted a slower pace of hiring. Two staffing firms cited wage pressure for lower-level manufacturing positions, and one contact noted wage pressure for higher-level IT and engineering workers.
Prices
Selling prices increased at a faster pace than in the prior report, and contacts noted upward pressure on input costs. Staffing firms said pricing was flat, although one contact noted renegotiating certain contracts at lower rates. Airlines said ticket prices were stable in the domestic market, but increased for South American routes. New home prices were flat, but there were several reports of incentives and/or discounts being offered, particularly on speculative inventory. Grain and cattle prices fell during the reporting period, prompting financial concerns for producers, and cotton prices were at breakeven levels. Gasoline and diesel prices rose over the reporting period following the increase in oil prices.
Manufacturing
The pace of expansion in the manufacturing sector picked up over the reporting period. Output growth strengthened for durable goods, led by increases in transportation equipment, machinery, and computer and electronic product manufacturing. Demand for fabricated metal manufacturing edged up, however, a few producers cited seasonal or energy-related weakness. Among nondurables, food manufacturers saw continued strength in demand. Exports remained a source of weakness for some manufacturers who sell internationally. Overall, outlooks were positive, although some expressed concern about political uncertainty.
Refinery utilization rates increased along the Gulf Coast. Chemical producers noted healthy global and domestic demand and higher year-over-year production. Outlooks for chemical manufacturers remained optimistic due to expectations of persistent feedstock cost advantages over their international counterparts.
Retail Sales
Retail sales expanded at a markedly faster clip than in the prior period. One contact noted that the tax-free weekend stimulated sales. Sales of building materials and garden equipment rose. Auto sales rebounded following weakness in the prior reporting period; however, there were a few reports of softening demand in Houston and Central Texas. Contacts said margins have improved due to increased purchases of larger vehicles. Outlooks among retailers were mixed.
Nonfinancial Services
Demand for nonfinancial services expanded moderately over the past six weeks. Demand for staffing services increased at a moderate pace. Activity in Dallas-Fort Worth increased, while one contact noted an unexpected decline in demand from oil and gas firms in Houston. Professional and technical services firms saw revenue gains during the reporting period, although firms tied to the energy sector cited continued sluggish demand. Accommodation and food services contacts noted slight increases in revenues, while revenue at healthcare firms fell during the reporting period. Airlines said passenger demand was stable over the past six weeks. Domestic travel remained solid, and activity along South American routes improved.
Transportation and warehousing firms noted higher revenues and an increase in cargo volumes since the last report. Rail cargo rose due to persistent strong gains in shipments of fracking sand, although shipments of petroleum products and motor vehicles declined further. Parcel shipments were flat over the reporting period but up from year-ago levels. Year-over-year growth in demand was driven by increases in shipments of nondurable goods, particularly food, apparel, petroleum and coal products, and plastics and rubber products. Outlooks among nonfinancial services firms were cautiously optimistic, with some contacts expressing concern about the impact of the current political environment on the broader economy.
Construction and Real Estate
Home sales were flat to up slightly over the reporting period. Contacts noted ongoing strength in sales of moderately-priced new homes; sales at the higher-price points softened, however. Buyers remained price-sensitive and were shopping more for deals. One contact said that some master-planned communities are adjusting lot sizes downward in future phases, to cater to the solid demand for moderately-priced product.
Apartment leasing remained active in Austin, but rent growth has moderated and incentives were being offered at the high end in submarkets, where competition was intense among new properties in the leasing phase. Activity in Dallas-Fort Worth remained strong, although contacts expect growth to moderate. Apartment demand firmed up in Houston following earlier weakness, and outlooks were positive, with contacts expecting continued, gradual improvement.
Office leasing activity stayed sluggish in Houston and vacancy rates were elevated, putting downward pressure on rents. Fundamentals in Houston's industrial market were healthy given near-record-low vacancy rates. One contact noted that investor interest has picked up in Houston. Office and industrial leasing activity continued to be solid in Dallas-Fort Worth.
Financial Services
Loan demand increased at a somewhat faster pace than the previous reporting period. Growth in commercial and industrial loan volumes ticked up. Commercial and residential real estate loan balances grew at a slower pace than in the previous reporting cycle, while consumer lending declined. Both core deposit volumes and the interest paid on them expanded slightly. Sentiments about future business activity and loan demand remained largely positive.
Energy
Demand for oilfield services held steady during the reporting period. Drilling activity expanded further in the Permian Basin, but has tapered off, on net, in the Eleventh District. Most contacts expect the rig count to remain flat or fall slightly through yearend, and some firms noted reducing capital expenditures for the remainder of the year. Outlooks were less optimistic compared with the previous report, as firms expect lower oil prices in the first half of 2018 and many firms have lowered their capital expenditure projections for next year.
Agriculture
Above-average moisture levels and cooler-than-normal weather boosted crop conditions. Sorghum and corn crop yields were better than average. However, grain prices fell below typical breakeven prices during the reporting period, and contacts noted it will take well-above-average yields to offset the low prices. Cattle prices also trended lower, prompting some financial concerns for ranchers after several months of profitability. Agricultural producers were concerned about the renegotiation of NAFTA, as many rely on export markets to sell their products.
For more information about District economic conditions visit: www.dallasfed.org/research/texas
Federal Reserve Bank of San Francisco
Summary of Economic Activity
Economic activity in the Twelfth District continued to expand at a moderate pace during the reporting period of July through mid-August. Overall price inflation was flat, while upward wage pressures intensified and labor market conditions tightened further. Sales of retail goods were unchanged, and growth in the consumer and business services sectors remained strong. Manufacturing activity picked up at a moderate pace, and activity in the agriculture sector expanded modestly. Contacts reported robust activity in residential real estate markets, and conditions in the commercial sector strengthened. Lending activity grew at a modest pace.
Employment and Wages
Labor market conditions tightened further, and upward wage pressure intensified in most parts of the District. Shortages of software engineers, particularly those with experience in cloud computing, boosted wages in the technology industry. Robust labor demand in the online retail sector boosted hiring in the Seattle area. Shortages of skilled labor somewhat restricted production in the manufacturing sector. While employee levels were unchanged in the pharmaceutical industry, contacts noted that some large companies began to move some production facilities to lower cost locales outside of the District. Wages in the construction sector continued to climb due to shortages of qualified contractors. Investments in automation in the agriculture sector picked up further, as labor shortages persisted and businesses sought to increase production efficiency. Legalization of cannabis increased demand for low-skilled workers in parts of the District.
Prices
Overall, price inflation was flat over the reporting period. Strong demand from the construction sector boosted prices of raw materials and steel products. Strong demand in the hospitality sector pushed up food and beverage prices at restaurants and hotels. Inflation remained low for branded pharmaceuticals, while prices of generic drugs continued to decline modestly. Continued elevated production reduced prices for some agricultural commodities. Mounting competitive pricing pressures in the retail grocery sector pushed prices lower.
Retail Trade and Services
On balance, the pace of retail sales was largely unchanged from the previous period, but many contacts reported increasing competitive pressures from online retailers. Demand for automobiles grew at a similar pace to that of late summer last year. However, contacts reported that inventories of used vehicles remained elevated, particularly for sedans, as low fuel prices boosted demand for trucks and sport utility vehicles. Overall sales at grocery retail outlets were largely unchanged from the prior reporting period, but contacts reported that traditional retailers faced growing competitive pressure from multinational chains. Sales of apparel products declined modestly, and contacts reported continued competitive pressure from online retail outlets. Additionally, foot traffic at large shopping centers declined further.
Activity in the consumer and business services sectors grew at a strong pace. Domestic and international flight arrivals continued to increase at a robust pace, and contacts reported that airports were running at or above capacity. Activity in the hotel industry remained robust in Southern California, although contacts expect the strong pace of growth to slow somewhat at the start of next year. While the health-care industry faced some uncertainty around federal policy, demand for services strengthened, and investments in medical information technology picked up after a soft first half of the year. Demand for restaurant services continued to be strong. Sales of information technology services increased modestly, as declining sales of legacy product lines were more than offset by increased investment in cloud computing and big data solutions.
Manufacturing
Manufacturing activity expanded at a moderate pace over the reporting period. Conditions in the steel sector improved, as global growth continued to strengthen and competitive pressures from abroad eased. Production of semiconductors rose modestly, while new orders rose strongly; contacts expect overall sales for 2017 to grow by nearly a double-digit pace. Production of pharmaceuticals picked up over the first half of the year. Deliveries of commercial aircraft over the first seven months of the year grew at around the same pace as the prior year, while new orders increased substantially.
Agriculture and Resource-Related Industries
Activity in the agriculture sector picked up at a modest pace. Harvest yields of grain were strong. Dealers reported that demand for used agricultural equipment picked up, while sales of new equipment were soft. Overcapacity in the energy generation industry hindered profitability somewhat, and contacts expect capital investments over the next few years to slow from historically high levels.
Real Estate and Construction
Real estate market activity continued to grow at a robust pace. Residential construction activity remained strong throughout the District, particularly in urban centers. New construction activity was slowed only by shortages of available land. Supply constraints pushed inventories to very low levels and slowed home sales somewhat. Prices continued to rise at a brisk pace, and contacts reported that affordable housing shortages in Southern California remained a serious concern. Overall, commercial real estate activity picked up to a moderate pace. Declining foot traffic at large shopping centers continued to push up vacancy rates. Rents for commercial property edged up slightly.
Financial Institutions
Lending activity grew at a modest pace over the reporting period. Loan demand expanded modestly. Deposit growth weakened slightly due to increased competition from nonbank institutions. Credit quality remained unchanged, and delinquency rates continued to be low. Contacts noted that regulatory costs continued to constrain profitability at community banks in some regions.
Surprises Galore
Surprises Galore
Surprises galore are greeting Asia traders as we digest the astonishing overnight headlines.Betwixt by an incredible rate hike from the Bank of Canada (BOC), a sudden resignation of Fed Vice Chair Stanley Fischer and a rare bipartisan deal on the debt ceiling, all caught market watchers by surprise.
Debt Ceiling
In a move designed to put the focus back on tax reform likely, President Donald Trump sided with Democrats over fellow Republicans, to achieve a deal with congressional leaders to extend the U.S. debt limit until Dec. 15 as well as avoid a government shutdown and provide disaster relief. This outcome was our expected results in that the that this debt limit increase is tied to an aid package to assist victims of Hurricane Harvey relief. Republican back room squabbling aside I think we all have to agree with Senate Democrat Minority Lead Schumer that this was “a positive step forward.”
Stanely Fischer
Vice Chair Stanley Fischer’s resignation helped to ignite a much-welcomed risk rally. While citing personal reason it’s not hard to read between the lines this move is more about clearing the way for Fed Yellen’s likely departure in February. Given that this move weakens the FED Troika ( Yellen, Dudely, Fischer) who were currently viewed as less dovish leaning members, his departure could eventually support a dovish Fed outcome throughout 2017.
Canadian Dollar
With the market pricing in only a 40 % chance of a rate hike from the BOC, USDCAD tumbled in the wake of the decision, down from 1.2400 to a low near 1.2140. This surprise will likely open the door to further gains for the Loonie as the market will start to price in a quicker pace of rate hikes from the Bank of Canada who is showing little concern for the high reaching Canadain Dollar. Unless the roaring Canadain economy takes an unexpected and abrupt U turn, it’s more likely than not the BOC will be leading the global centeral bank charge towards interest rate normalisation this year.
It amazing how a rate hike can improve risk sentiment as EM and other commodity linked currencies rallied on the fact that at least from the BOC perspective, reflation is not dead a buried, and there are real macro concerns to focus on beyond the North Korea bluster.
Global centeral bankers were keeping close tabs on the Toronto Stock Exchange reaction in the wake of the surprise hike. And while the stock market reaction was not huge, it does italicise that stock market buoyancy is a direct result of central bank largess and perhaps a small foreshadowing of what’s in store for the ECB if the hawks take a flight of Draghi fails to temper the EURO.
EURO
Expect the EURO pre ECB positioning to dictate the pace today . But the market is struggling to reach a collective view heading into today’s meeting. If there is a consistent look, it’s that the ECB will kick the can to October before making any serious policy announcement allowing them more time to digest both the N.Korea risk fall out and Federal Reserve Outlook.With that said, there remains a high chance that Super Mario will attempt to bludgeon Eur strength
Japanese Yen
The greenback received a modicum of support after the debt ceiling extension as USDJPY prices were lifted to a session high as US Treasury yields blipped higher. Other than the debt ceiling bounce there doesn’t appear to be a whole lot of other reasons to buy UDJPY at present, so very questionable if this rally holds and I expect the market to be better seller on the average.
Australian Dollar
The Aussie regained some composure overnight on the mini risk revival, as the market refocuses on the reflationary trade after the BOC rate hike.
Yesterday, the Aussie tripped after a marginal miss on GDP. This slight data miss and the subsequent market reaction was
more a symptom of pent up expectations than anything else as the domestic GDP data has surprised the market consensus
in recent times.
The market is still in buy the Aussie dip mode.
Malaysian Ringgit
Are we finally getting our anticipated expansive shift in MYR sentiment ?? It appears the bulls are coming out on mass supported by a decent carry, a stable to a strong currency, the 1MDB risk is in the rear view mirror, and the Malay Macro fundamentals looking solid.
Yesterdays soaring exports is certainly not a sign of a struggling economy and bodes well for the MYR.
Firming Oil prices of late are also supporting the Ringgit cause.
The party may only be starting
USD/CAD Canadian Dollar Higher After BoC Delivers Surprise Rate Hike
The Canadian dollar appreciated on Wednesday after the Bank of Canada (BoC) hiked interest rates by 25 basis points. The move was not totally unexpected as the central bank had been hinting at a second rate hike this year, but the timing predicted by analysts was for later in the year given the amount of noise from other central banks happening in September. BoC Governor Stephen Poloz has proven once again that he can be proactive. The BoC has been optimistic about the strength of the Canadian economy and decided to raise rates now rather than later and regardless of what other central banks do or say in September.
The Canadian trade balance deficit shrunk in July to $3.0 billion after imports fell 6 percent with exports decreasing by only 4.9 percent. Falling prices drove the fall in imports and exports had to deal with a stronger loonie. Canadian productivity edged down by 0.1 percent in the second quarter but after a big gain last month (1.3 percent) it didn't have much impact as traders were awaiting the decision from the Bank of Canada.
The loonie hit a 2 year high after the decision to bring back interest rates to 1.00 percent. The rate cuts of 2015 have served their purpose and the strong pace of GDP growth has made it an easy decision for the BoC even if the timing is questionable given it is front running the September policy meetings for the U.S. Federal Reserve and the European Central Bank (ECB). The ECB will be up next on Thursday at 7:45 am EDT.
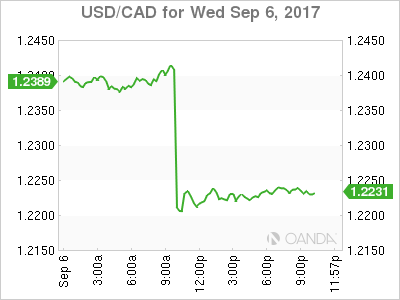
The USD/CAD lost 1.311 on Wednesday. The pair is trading at 1.2224 after touching a 2 year low right after the Bank of Canada (BoC) surprised the market with a 25 basis points raise of its benchmark interest rate. The Canadian central bank had adopted a very hawkish view back in June and signalled a rate hike in July. A second rate hike was expected but later in the year as September is anticipated to be an important month for monetary policy meetings in particular for the Fed and the European Central Bank (ECB).
BoC Governor Stephen Poloz did not want to be left out and proactively hiked the interest rate to 1.00 percent. The eagerness of the policy maker to get ahead of the market was also evident back in 2015 when he cut rates twice to stimulate a Canadian economy about to hit by lower oil prices. Comments from the central bank's leadership pointed to an end of that stimulus as it was no longer needed given the strength of the economy. The rate statement echoed those comments as even the strength of the loonie is not a concern as it is deemed by the central bank to be a reflection of the economy.
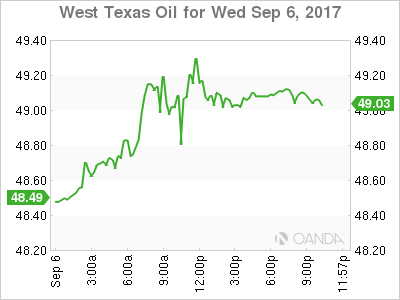
West Texas Intermediate rose 1.038 percent on Wednesday. The price of crude is trading at $49.06 after Texan refineries are starting to come back online while at the same time Hurricane Irma threatens to hit Florida on the weekend. Harvey caused a glut of crude as the storm mostly hit refineries with as much as a quarter of US capacity had to be shutdown. Irma on the other hand could threaten crude supplies if platforms have to be taken offline for security reasons.
Weekly US crude inventories was pushed back a day due to the Labor day holiday and will be released on Thursday, September 7 at 11:00 am EDT. Last week's data showed a big drawdown of 5.4 million barrels but with little refining capacity available crude stocks rose, specially after the US released part of its reserves to out of state refiners to keep gasoline prices from going higher.
Market events to watch this week:
Thursday, September 7
7:45 am EUR Minimum Bid Rate
8:30 am EUR ECB Press Conference
8:30 am USD Unemployment Claims
11:00 am USD Crude Oil Inventories
Tentative CNY Trade Balance
Friday, September 8
4:30 am GBP Manufacturing Production m/m
8:30 am CAD Employment Change
ECB Caught Between Growth And Low Inflation
Central bank to upgrade growth but downgrade inflation outlook
The EUR continues to gain versus the USD ahead of the ECB monetary policy statement. The single currency has gained 7 percent since June as geopolitical uncertainty at home and abroad, coupled with mixed data have impaired the USD. A strong currency has put even further pressure on the ECB as it has depressed inflation and complicated the tapering of quantitative easing that is anticipated for this year.
The European Central Bank (ECB) will announce its minimum bid rate on Thursday, September 7 at 7:45 am EDT. ECB President Mario Draghi will host a press conference at 8:30 am EDT. A taper announcement has been in the cards and Germany is applying pressure to do it sooner rather than later, but the announcement could still be pushed for later in the year. The political uncertainty in the United States have put the ECB on the spot as the USD with the Fed pushing a tightening monetary policy should be higher as the ECB still has massive stimulus in place. Confidence in European growth and dollar overselling has put the single currency close to 1.20.
The Energy Information Administration (EIA) will publish its weekly US crude inventories on Thursday at 11:00 am EDT. The price of oil has risen after refineries hit by Hurricane Harvey are slowly starting to get back online, but the threat of Hurricane Irma is fast approaching due to hit the US over the weekend. Supply disruptions have a big impact on prices as shale production and the Organization of the Petroleum Exporting Countries (OPEC) production cut agreement created a stalemate earlier in the year.
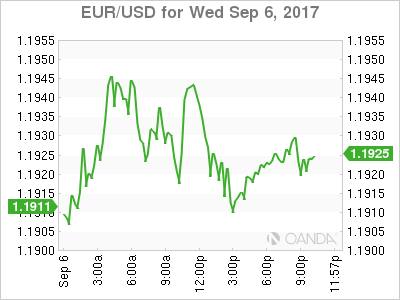
The EUR/USD gained 0.044 percent in the last 24 hours. The single currency is trading at 1.1923 ahead of the European Central Bank (ECB) monetary policy meeting statement on Thursday. While the central bank could announce the schedule for its QE tapering it could also chose to wait until December with the spotlight squarely on Mario Draghi’s words at the press conference. The ECB president has the tough job of balancing strong growth and low inflation while having a strong currency.
June proved to be a particular hawkish month for central bankers with the Bank of Canada (BoC) changing its tune and prepping the market for a rate hike that came in July. The ECB was upbeat in Draghi’s speech in Portugal, but has now moderated his optimism and said almost nothing about monetary policy at the Jackson Hole summit. The main takeaway from the ECB meeting on Thursday could be the upgrade on its growth forecasts.

West Texas Intermediate rose 1.038 percent on Wednesday. The price of crude is trading at $49.06 after Texan refineries are starting to come back online while at the same time Hurricane Irma threatens to hit Florida on the weekend. Harvey caused a glut of crude as the storm mostly hit refineries with as much as a quarter of US capacity had to be shutdown. Irma on the other hand could threaten crude supplies if platforms have to be taken offline for security reasons.
Weekly US crude inventories was pushed back a day due to the Labor day holiday and will be released on Thursday, September 7 at 11:00 am EDT. Last week’s data showed a big drawdown of 5.4 million barrels but with little refining capacity available crude stocks rose, specially after the US released part of its reserves to out of state refiners to keep gasoline prices from going higher.

The USD/CAD lost 1.311 on Wednesday. The pair is trading at 1.2224 after touching a 2 year low right after the Bank of Canada (BoC) surprised the market with a 25 basis points raise of its benchmark interest rate. The Canadian central bank had adopted a very hawkish view back in June and signalled a rate hike in July. A second rate hike was expected but later in the year as September is anticipated to be an important month for monetary policy meetings in particular for the Fed and the European Central Bank (ECB).
BoC Governor Stephen Poloz did not want to be left out and proactively hiked the interest rate to 1.00 percent. The eagerness of the policy maker to get ahead of the market was also evident back in 2015 when he cut rates twice to stimulate a Canadian economy about to hit by lower oil prices. Comments from the central bank’s leadership pointed to an end of that stimulus as it was no longer needed given the strength of the economy. The rate statement echoed those comments as even the strength of the loonie is not a concern as it is deemed by the central bank to be a reflection of the economy.
Market events to watch this week:
Thursday, September 7
7:45 am EUR Minimum Bid Rate
8:30 am EUR ECB Press Conference
8:30 am USD Unemployment Claims
11:00 am USD Crude Oil Inventories
Tentative CNY Trade Balance
Friday, September 8
4:30 am GBP Manufacturing Production m/m
8:30 am CAD Employment Change
BoC Does It Again
The Bank of Canada hikes interest rates on Wednesday and left the door open for more. The Canadian dollar soared and was easily the top performer while the New Zealand dollar and yen lagged. Australian retail sales are up next. A new Premium trades in major index has been issued alongside 3 supporting charts and notes.
The Bank of Canada is all about the output gap and proved it once again Thursday. Stronger growth numbers were inputed to the model after Q2 GDP data and the machine spit out an earlier close, which means sooner rate hikes and that led to a hike.
What the model may be missing is that a narrow or closed theoretical gap in potential growth isn't leading to inflation anywhere, especially not wage inflation. Poloz and company maybe overlooking the disinflationary impacts of a higher currency and lower commodity prices; never mind the risks to Canadian housing.
In any case, the BOC wields the power and USD/CAD bulls were crushed. The pair fell to 1.2143 from 1.2405 immediately after the announcement before a bounce to 1.2220 late. It's a fresh two-year low in the pair. It kept the door open for more hikes (without committing) and said the focus will be on the labor market and household debt. We will look for more clarification in upcoming BoC speeches.
Otherwise Thursday, the US dollar was bounced around. It sold off after Fed Vice-Chair Fischer announced his resignation. He was a hawkish voice at the core of the FOMC. The dollar bounced back later after a bipartisan deal to lift the debt ceiling and fund the government through Dec 15, when the fight will renew again.
The next items on the agenda are from Australia with retail sales and trade balance for July due at 0130 GMT. Will the RBA be the next to make a hawkish shift?
Gold Pauses as Markets Digest N. Korea Tensions, Dovish Fed Stance
Gold is showing little movement in the Wednesday session, after considerable gains on Tuesday. In the North American session, gold is trading at $1337.87, down 0.13% on the day. On the release front, today's major event was ISM Non-Manufacturing PMI. The indicator improved to 55.3, but this was short of the forecast of 55.8 points. On Thursday, the US releases employment claims.
The most recent crisis over North Korea has triggered sharp gains in gold prices, as less risk appetite has led to investors snapping up safe-haven gold. On Tuesday, gold touched a high of $1344.39, its highest level since September 2016. The week began with North Korea announcing that it had tested a hydrogen bomb which could be used in a missile strike. US President Trump responded by announcing that he would increase weapon sales to Japan and South Korea and on Wednesday, South Korea's President Moon Jae-in warned that the situation risked becoming "uncontrollable". As tensions between Washington and Pyongyang have increased, the US dollar has lost ground to safe-haven assets such as gold. If the situation continues to deteriorate, traders can expect gold prices to continue to climb.
There has been increasing speculation that the Federal Reserve will stay on the sidelines and not raise interest rates until 2018. Last week's soft employment numbers have only reinforced that sentiment. On Tuesday, FOMC member Leal Brainard weighed in on interest rate policy. Brainard noted that inflation remained "well short" of the Fed's target of 2%, and urged the Fed to act cautiously and resist raising interest rates until inflation moves higher. Brainard did acknowledge the rebound in the US economy, saying that the economy was on "solid footing". A December rate hike remains very much in doubt, with odds of an increase at just 30%. With the likelihood of a rate hike pegged at less than 2% at next week's policy meeting, the markets will be focusing on the Fed's balance sheet, which stands at $4.2 trillion. Earlier in the year, the Fed outlined plans to reduce the balance sheet, and analysts expect further details at the September meeting.
Bank of Canada: Actions Speak Louder than Cautious Words
The Bank of Canada had at least some element of surprise in announcing today's increase in its overnight lending rate to 1.0 percent, although the tone of the written statement was somewhat cautious.
Does the Rearview Mirror Look Better than the Road Ahead?
The Bank of Canada (BoC) raised rates this morning in a move that was somewhat anticipated by financial markets, but generally not expected by most economists. Admittedly, we thought October would be the first reasonable opportunity for the Bank of Canada to raise rates. That said, in our note following last week's better-than-expected report on second quarter GDP, we said "we would be remiss not to acknowledge there is some risk policy-makers could act at their scheduled meeting this coming Wednesday."
The announcement came with a significant re-write of previously published press releases in which BoC policy makers recognized that economic data have been "stronger than expected". Actions speak louder than words, and today's rate hike demonstrates the fact that the BoC judges the faster rate of growth to be "more broadly based and self-sustaining." Having said that, there was a fair degree of caution in the rest of the published statement that, in our view, hedges those comments about growth being "selfsustaining." We have been hammering the table on the sustainability of consumer spending when household debt levels are elevated and home prices may have overheated in some markets. This is not going unnoticed by the BoC as evidenced by this segment from today's official statement: "the housing sector appears to be cooling in some markets in response to recent changes in tax and housing finance policies. The Bank continues to expect a moderation in the pace of economic growth in the second half of 2017."
In the first two quarters of 2017, Canada's growth has been faster than any other economy in the G-7. Although, like a thoroughbred that breaks early in a horse-race, we question whether or not the pace is sustainable. Specifically, we point to the fact that in each of the first two quarters, a double-digit percentage growth rate for inventory accumulation contributed to the outperformance. Any sort of moderation in stockpiling will bring the GDP growth rate back down to earth in the second half.
It bears noting that the rate hike today was couched as a "removal of some of the considerable monetary policy stimulus," and that future decisions are not predetermined. The statement also spoke of some remaining slack in labor markets and subdued wage pressure on inflation. The headline rate of CPI inflation in Canada is just 1.2 percent at present, near the low end of the target range. The last line of the official statement spoke to elevated household debt levels and the need for monitoring how higher rates impact the Canadian consumer. We will be watching that as well. The move by the BoC today likely takes another hike in October off the table. December 6 is now a "live" meeting, though our baseline expectation is that a slowing growth profile will justify the BoC remaining on hold, conditional on the outlook for inflation.