
Sample Category Title
Euro Recovers Mildly, But Stays Weak as Markets Await ECB
Euro recovers mildly in Asian session today but stays in red for the week except versus Dollar. Markets are cautiously awaiting the highly anticipated ECB policy decision and press conference. There were rumors flying around since last week that ECB will deliver nothing this time. The decision on tapering the asset purchase program would be delayed to October or even December. At this point, October is still a more likely option. After all, the central bank will likely maintain the rhetoric that "the net asset purchases, at the current monthly pace of EUR 60b, are intended to run until the end of December 2017, or beyond, if necessary, and in any case until the Governing Council sees a sustained adjustment in the path of inflation consistent with its inflation aim". Policymakers would also warn of currency appreciation. At the Q&A session, Draghi would probably stay neutral in the tapering schedule.
Canadian Dollar maintains post BoC gains
Canadian Dollar remains the strongest one for the week after BoC's surprised rate hike. BoC increased the policy rate by 25 bps to 1.00%, following a rate hike in July. Policymakers cited the better-than-expected economic developments as a key reason for the removal of stimuli from the market. However, they remained cautious over a number of issues including excess capacity, subdued inflation, geopolitical risks and the strength in Canadian dollar. On the future tightening path, the central bank stressed that it is "not predetermined" and "will be guided by incoming economic data and financial market developments as they inform the outlook for inflation". We believe the progress of NAFTA renegotiations and other trade-related issues, the inflation outlook, the housing market developments and the Fed's balance sheet reduction would be key factors driving BoC's rate decision. More in BOC Surprisingly Hikes Rate For Second Consecutive Meeting.
Trump upsets Republicans on debt limit deal with Democrats
Dollar, on the other hand, is trading as the weakest one for the week. US President Donald Trump reached a short-term deal with Democrats, despite opposition from Republicans, to extend the US debt limit, providing government funding for three months until December 15. The deal would also provide financial relief to victims of Hurricane Harvey. However, the decision attracted criticism that Trump is further distancing himself from his own party, the Republicans. And some pointed out it's an act to deflect blame for the gridlock for a year. The move overruled Trump's own treasury secretary, Steven Mnuchin, who's in the middle of a proposal for long term fix to the debt ceiling problem. Also, shortly before the meeting, Republican House Speaker Paul Ryan called the Democratic proposal a "ridiculous and disgraceful" idea that would "play politics with the debt ceiling". The bill is due to pass in the Republican-controlled Congress and Senate.
Fed Beige Book showed concern on auto industry
Fed's Beige Book economic report showed modest moderate growth across the regions in the past two months. Labor markets were "widely characterized as tight" but "growth slowed some on balance". But the report also showed that "contacts in many districts expressed concerns about a prolonged slowdown in the auto industry." Wage growth also remained subdued as " majority of districts reported limited wage pressures and modest to moderate wage growth." Regarding inflation, "prices rose modestly overall across the country".
Fed Vice Fischer announce early step down
Fed Vice Chair Stanley Fischer announced to step down from his position for personal reasons, on or around October 13. That is eight months ahead of the end of his term. Fischer noted in his letter to Trump that job growth has returned and "steps to make the financial system stronger and more resilient" had been taken. Fischer is seen as a close ally of Chair Janet Yellen. And, his departure intensify rumors that Yellen will also leave after her term expires next February. Trump's top economic advisor Gary Cohn has always been tipped as the replacement for Yellen. But the Wall Street Journal reported yesterday, citing sources, that Cohn won't be picked. Relationship between Cohn and Trump turned sour after the former criticized the latter's reactions to white supremacist rally in Virginia last month.
BoJ Kuroda front runner for next term
Talking about top central bankers, BoJ Governor Haruhiko Kuroda will also end his five year term next March. There have been some criticism on Kuroda for being out of ideas in boosting inflation in Japan. Prime Minister Shinzo Abe's top advisor Nobuyuki Nakahara warned before that Kuroda will "fall into inertia" after being in the job for so long. But according to a Bloomberg survey of economist done between August 21 and 25, Kuroda is still the front runner for the job by a market. Respondents assigned a score of 68 out of 100 for Kuroda. The next is Deputy Governor Hiroshi Nakaso at 34/100, and then Columbia University Professor Takatoshi Ito at 30/100.
On the data front
Australia retail sales rose 0.0% mom in July, below expectation of 0.2% mom. Trade surplus narrowed to AUD 0.46b in July. German industrial production and Swiss foreign currency reserves will be featured in European session. But the main focus will certainly be on ECB announcement and press conference. Later in the day, Canada will release building permits and Ivey PMI. US will release jobless claims and non-farm productivity.
EUR/GBP Daily Outlook
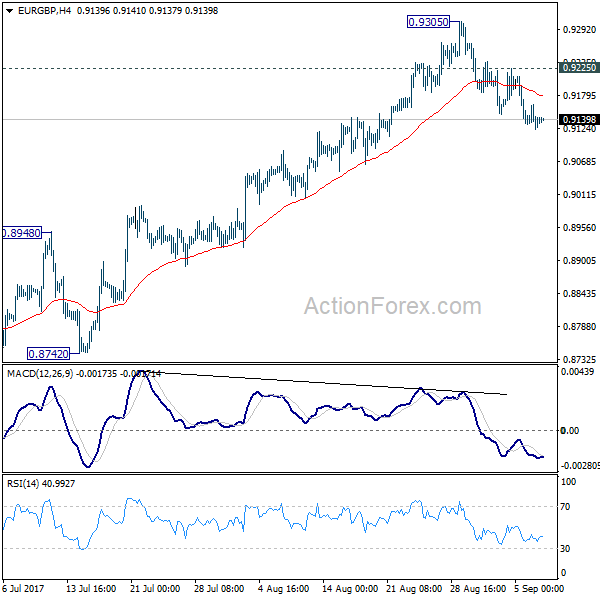
Daily Pivots: (S1) 0.9118; (P) 0.9141; (R1) 0.9159; More
Intraday bias in EUR/GBP remains on the downside for the moment. Current fall from 0.9305 short term top would target 55 day EMA (now at 0.9013). Sustained trading below there will likely start the third leg of the consolidation from 0.9304 and target 0.8303 key support again. On the upside, above 0.9236 minor resistance will turn bias back to the upside for 0.9225 minor resistance instead.
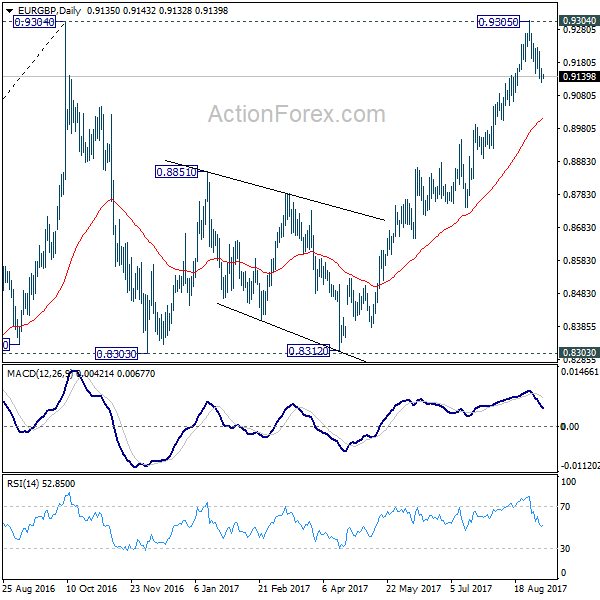
In the bigger picture, price actions from 0.9304 are viewed as a medium term corrective pattern. It's uncertain whether it is finished yet. But in case of another fall, we'd expect strong support from 0.8116 cluster support (50% retracement of 0.6935 to 0.9304 at 0.8120) to contain downside and bring rebound. Whole up trend from 0.6935 is expected to resume after consolidation from 0.9304 completes. Firm break of 0.9799 high will target 61.8% projection of 0.5680 to 0.9799 from 0.6935 at 1.1054.
Economic Indicators Update
| GMT | Ccy | Events | Actual | Forecast | Previous | Revised |
|---|---|---|---|---|---|---|
| 1:30 | AUD | Retail Sales M/M Jul | 0.00% | 0.20% | 0.30% | 0.20% |
| 1:30 | AUD | Trade Balance (AUD) Jul | 0.46B | 0.95B | 0.86B | 0.89B |
| 5:00 | JPY | Leading Index Jul P | 105 | 105.1 | 105.9 | |
| 6:00 | EUR | German Industrial Production M/M Jul | 0.60% | -1.10% | ||
| 7:00 | CHF | Foreign Currency Reserves Aug | 714B | |||
| 11:45 | EUR | ECB Rate Decision | 0.00% | 0.00% | ||
| 12:30 | EUR | ECB Press Conference | ||||
| 12:30 | CAD | Building Permits M/M Jul | -1.00% | 2.50% | ||
| 12:30 | USD | Initial Jobless Claims (SEP 02) | 242k | 236k | ||
| 12:30 | USD | Non-Farm Productivity Q2 F | 1.20% | 0.90% | ||
| 12:30 | USD | Unit Labor Costs Q2 F | 0.40% | 0.60% | ||
| 14:00 | CAD | Ivey PMI Aug | 61.3 | 60 | ||
| 14:30 | USD | Natural Gas Storage | 30B | |||
| 15:00 | USD | Crude Oil Inventories | -5.4M |
Brent Oil Imminent Breakout
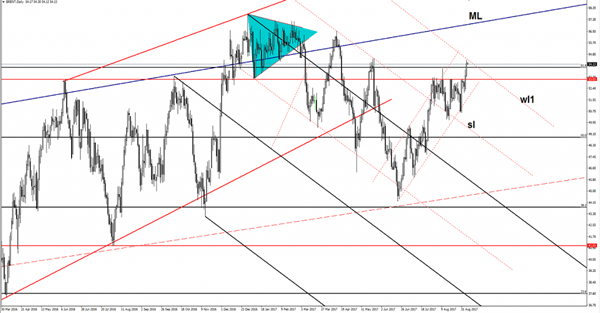
Brent shows little activity after the last's day's impressive rally. Price has managed to climb above the 61.8% retracement level, signaling that the bulls are in total control. However, price stands under the first warning line (wl1) of the major descending pitchfork, which represents a major resistance line. Only a valid breakout above it will confirm a further increase in the upcoming weeks. Resistance can be found at the 54.55 as well.
USD/JPY Still Flat
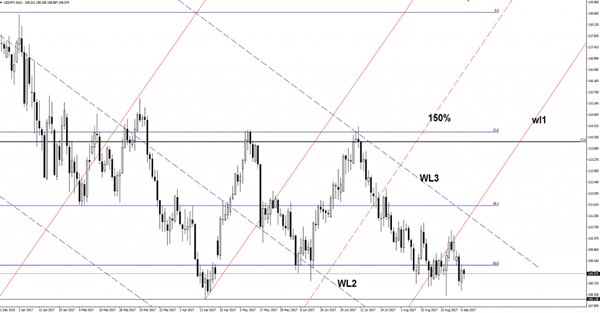
USD/JPY narrows on the Daily chart and fails to show us a clear direction. Price failed once again to reach the 108.12 horizontal support, showing an oversold and a potential up movement. Personally, I hope that we’ll have clear direction after today’s major fundamental events.
The pair moves in range also because the Nikkei stock index move sideways as well on the short term. JP225 lost the bearish momentum and could climb higher again if the USDX will receive a helping hand from the US economy today.
EUR/USD The Crucial Day Has Come
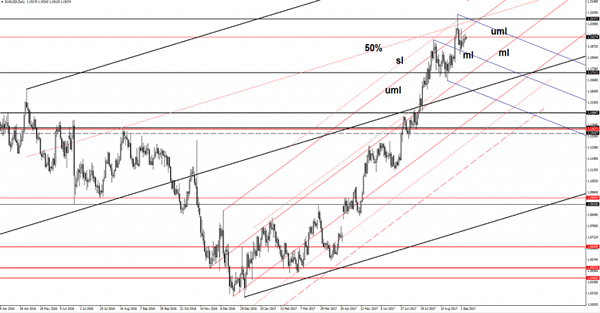
EUR/USD posted humble gains today and seems like has lost the bullish momentum. It shows a little activity as the USDX has changed little as well today. The dollar index is trading in the red, but shows some exhaustion signs, even if is located under the 92.49 broken static support.
However, the USDX could drop much deeper to retest a dynamic support before will really start another leg higher. The dollar index is on a declining path, only some good US data and a dovish ECB could turn it to the upside again.
We have a crucial day for the Euro, the ECB is to release the Minimum Bid Rate, which is predicted remains steady at the 0.00% historical minimum. However, there are rumors that said that the European Central Bank will take action today, any stimulus measures will weaken the European currency.
The EUR/USD is fighting hard to hold the ground and to retest the upper median line (uml) of the ascending pitchfork. Technically, is overbought and could decrease at least till will reach the median line (ml) of the ascending pitchfork.
I want to remind you that the current bounce back is natural after the false breakdown below the median line (ml) of the minor descending pitchfork. A failure to reach and retest the upper median lines of the mentioned pitchforks, will signal a sharp drop in the upcoming period.
Elliott Wave View: AUDUSD Bullish Above 0.787
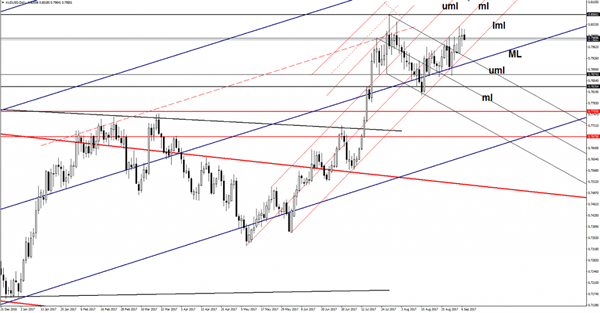
AUDUSD Short Term Elliott Wave view suggests that the rally from 8/15 low is unfolding as a double three Elliott Wave structure. Up from 8/15 low, Minute wave ((w)) ended at 0.79957 and Minute wave ((x)) ended at 0.7868. Minute wave ((y)) is in progress and the subdivision also unfolds as a double three. Minutte wave (w) of ((y)) ended at 0.7995 and Minutte wave (x) of ((y)) ended at 0.793. Near term, while pullbacks stay above 0.793, but more importantly above 0.7868, expect pair to extend higher towards 0.806 – 0.8108. We don’t like selling the pair.
AUDUSD 1 Hour Elliott Wave Chart
Double three ( 7 swings) is the most important pattern in Elliott wave’s new theory. It is also probably the most common pattern in the market these days. Double three is also known as a 7-swing structure. It is a very reliable pattern that gives traders a good opportunity to trade with a well-defined level of risk and target areas. The image below shows what Elliott Wave Double Three looks like. It has labels (W), (X), (Y) and an internal structure of 3-3-3. This means that all 3 legs has corrective sequences. Each (W) and (Y) is formed by 3 wave oscillations and has a structure of A, B, C or W, X, Y of smaller degrees.
What To Expect From The ECB?
ECB Faces Cat & Mouse Game
Well-Tailored Statement
ECB May Go On Autopilot in January
Euro Bets Skewed For Bullish Move
We have less than four months left before the ECB asset purchase program ends, and the president of the ECB, Mario Draghi is reticent about the future path of the monetary policy. Month after month, the tapering process has been delayed while the recovery in the Eurozone has strengthened. The patient is not sick and there is no need for the lifeline. Investors are forced to take their best guess and their bets are skewed by their perspective due to lack of information and clarity from the ECB in relation to their monetary policy.
ECB Faces Cat & Mouse Game
The Euro has touched the high of 1.20 against the dollar and its strength against the Sterling is even more remarkable. Not only investors but also some officials of the European central bank are concerned about the currency's strength. It will not be far stretched to say that the ECB is in a cat and mouse chase game. The bank would have sufficient excuses if it wants to keep delaying the tightening of the monetary process. However, there is a lack of evidence that the strength of the currency in the medium term will choke the economy. The ECB should keep their focus on the domestic demand and not be played by the strength of the currency as that would be misleading.
Well-Tailored Statement
Forget about pulling a rabbit out of the hat, when it comes to the ECB's meeting on Thursday, I expect the statement to be immensely tailor-made. It is widely expected that the ECB would say that they have officially discussed the process of tapering in the light of their latest economic projections. The probabilities are high that there would not be any loose ends because I expect Draghi to learn from his previous mistake. On the outset it may look as if the statement was very vague but in reality it would be highly tailor-made. The reason is that the bank would like to have their options open due to the nature of complexity involved in this task.
ECB May Go On Autopilot in January
It is highly likely that the ECB would adopt the same path as the Fed did. The bank is going to be gradual with its tapering process and it would only ease off the gas slowly and in a systematic way. These are unusual dynamics and the bank would prefer to rather play it safe than sorry.
Euro Bets Skewed For Bullish Move
The euro-dollar one week risk reversal shows that traders are highly bullish and they are anticipating the euro-dollar pair to move higher.
EUR/JPY Downside Perspective Clouded
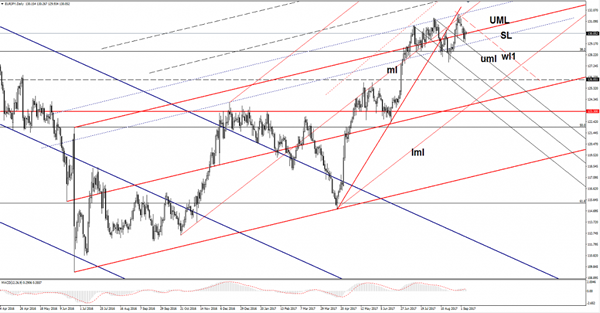
EUR/JPY rebounded in the yesterday's session and closed above the upper median line (UML) of the major ascending pitchfork. Price is pressuring the dynamic support, a false breakdown will signal another bullish momentum. The failure to reach the confluence formed by the sliding line (sl) with the upper median line (uml) signals an increase as well.
AUD/USD Losing Altitude
AUD/USD dropped significantly in the morning as the Australian data have disappointed. The Retail Sales have increased only by 0.0% in July, less versus the 0.2% estimate, while the Trade Balance dropped from 0.89B to 0.46B, even if the economists have predicted an increase to 0.93B.
Price failed to approach and reach the 0.8027 Tuesday’s high, signaling that the bulls are exhausted. Technically, a drop towards the lower median line (lml) is expected in the upcoming days.
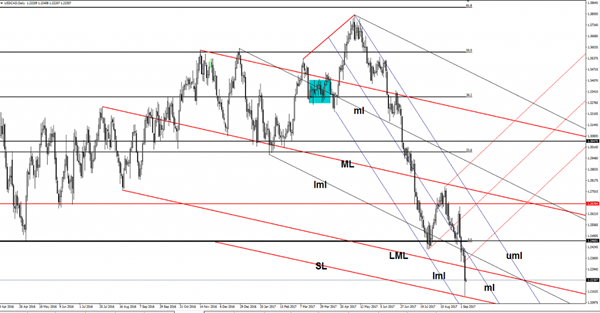
USD/CAD At 2-Years Low
The currency pair plunged aggressively after the BOC’s decision to hike the rate, now is located at fresh new lows. USD/CAD dropped more than 230 pips in the yesterday’s session and could hit new lows if the USDX slides further.
Has registered an amazing drop even if the dollar index remained steady near the 92.20 level, but we’ll see what the US data will bring today.
The greenback needs a bullish spark to be able to increase versus all its rivals, could be helped by a dovish ECB. You should keep an eye on the economic calendar because this is filled with high impact data.
Technically, the USD seems too oversold to drop further, a rebound is favored versus all its rivals. The USDX’s bears seem a little exhausted on the daily chart.
USD/CAD is on a declining path and continues to be under an immense selling pressure. Has squeezed a little in the US session and now is fighting hard to recover. Technically, it seems oversold, but we don’t have a confirmation yet.
USD/CAD dropped aggressively, but failed to approach and reach the lower median line (lml) of the minor descending pitchfork, signaling a potential reversal. It’s premature to talk about a reversal at this moment as long as the rate is trading under some important resistance levels (support turned into resistance).
A bullish confirmation could come if the rate will close above the lower median line (LML) of the major descending pitchfork again.
Daily Technical Outlook And Review: EUR/USD, GBP/USD, AUD/USD, USD/JPY, USD/CAD, USD/CHF, DOW 30, GOLD
A note on lower timeframe confirming price action...
Waiting for lower timeframe confirmation is our main tool to confirm strength within higher timeframe zones, and has really been the key to our trading success. It takes a little time to understand the subtle nuances, however, as each trade is never the same, but once you master the rhythm so to speak, you will be saved from countless unnecessary losing trades. The following is a list of what we look for:
- A break/retest of supply or demand dependent on which way you're trading.
- A trendline break/retest.
- Buying/selling tails ... essentially we look for a cluster of very obvious spikes off of lower timeframe support and resistance levels within the higher timeframe zone.
- Candlestick patterns. We tend to only stick with pin bars and engulfing bars as these have proven to be the most effective.
We typically search for lower-timeframe confirmation between the M15 and H1 timeframes, since most of our higher-timeframe areas begin with the H4. Stops are usually placed 1-3 pips beyond confirming structures.
EUR/USD
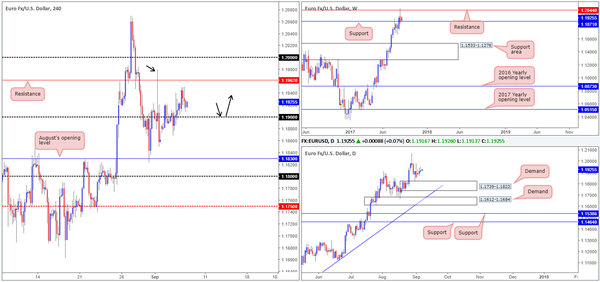
Amid Wednesday's trading, the US dollar mildly pared recent losses at weekly support drawn from 11854. As a result of this, the single currency topped at 1.1950 and ended the day closing relatively unchanged ahead of the 1.19 handle.
Looking over to the bigger picture, we can see that the pair is actually trading from a weekly support carved from 1.1871. Not only this, there's also room seen for the bulls to stretch their legs from here as far north as the weekly resistance plotted at 1.2044. A little lower on the curve, daily price also remains well-bid above demand pegged at 1.1739-1.1823, with the said weekly resistance in place as the next upside target.
Suggestions: As the desk highlighted on Wednesday, despite all three timeframes on the EUR suggesting further buying may take place up to at least H4 resistance at 1.1962, and quite possibly the large psychological boundary 1.20 (H4 consumption wick marked with a black arrow at 1.1979 shows that offers may be weak here), we're still wary due to where price is trading from on the USDX!
Given the above factors, we would want to see H4 price retest 1.19 as support (see black arrows) and hold firm in the shape of a full, or near-full-bodied bullish candle, before looking to buy this market and targeting 1.1962/1.20.
Data points to consider: EUR Minimum bid rate at 12.45pm, followed closely by the ECB Press conference at 1.30pm. US Unemployment weekly claims at 1.30pm GMT+1.
Levels to watch/live orders:
- Buys: 1.19 region ([waiting for a reasonably sized H4 bullish candle to form – preferably a full, or near-full-bodied candle – is advised] stop loss: ideally beyond the candle's tail).
- Sells: Flat (stop loss: N/A).
GBP/USD
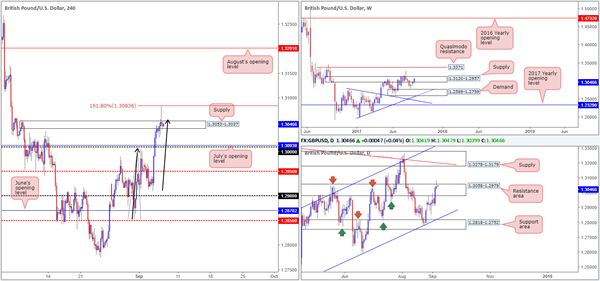
Beginning with the weekly timeframe this morning, we can see that upward momentum on the British pound has picked up of late, despite being surrounded by a supply registered at 1.3120-1.2957. A decisive close above this area could see price approach the Quasimodo resistance level penciled in at 1.3371. The story on the daily timeframe, however, shows that price chalked up a nice-looking bearish selling wick on Wednesday that pierced through the top edge of a resistance zone coming in at 1.3058-1.2979.
Over on the H4 candles, the unit recently filled our short at 1.3057 and is, as we write, currently trading in the green. As explained in Wednesday's report, we were looking to sell here due to the AB=CD formation (see black arrows) that completed within the noted higher-timeframe structures. The stop-loss order remains fixed above the 161.8% Fib ext. level at 1.3083 (1.3086).
Suggestions: For those who sold alongside us, we're currently eyeing the large psychological boundary 1.30 as an initial target.
Data points to consider: US Unemployment weekly claims at 1.30pm GMT+1.
Levels to watch/live orders:
- Buys: Flat (stop loss: N/A).
- Sells: 1.3057 ([live] stop loss: 1.3086).
AUD/USD
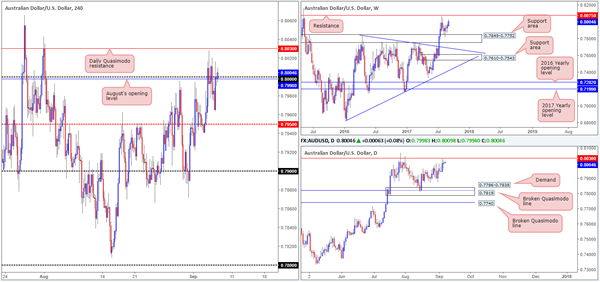
In spite of the pair ranging around 60 pips, AUD/USD prices are little changed this morning. As a result of this, much of the following report will echo similar thoughts put forward in Wednesday's report…
As of current price, H4 action remains marginally bid above the large psychological handle 0.80. With 0.80 likely being a sensitive point in this market, let's see how land lies on the higher timeframes. Since weekly price linked with the support area at 0.7849-0.7752 three weeks ago, the unit has remained reasonably well-bid. The next objective, assuming that price continues to push north, can be seen around resistance drawn from 0.8075. Before weekly action can reach the noted resistance, however, let's not forget that daily action must first consume the Quasimodo resistance at 0.8030 (recent trade printed an indecision candle).
Suggestions: We would not want to be a seller at 0.80 given the room seen to move higher on the bigger picture. Similarly, we would be uncomfortable buying above 0.80 seeing how close the daily Quasimodo resistance is located. In addition to this, a sell from the daily Quasimodo opens one up to the possibility of being faked up to the weekly resistance at 0.8075. Therefore, the only place of interest right now, in our opinion, is the said weekly resistance level, which happens to stretch as far back as 1997! Whether or not this will turn to be a valid sell zone will depend entirely on how H4 price action responds. Ideally, we'd want a strong bearish candle form from here in the shape of a full, or near-full-bodied formation.
Data points to consider: Australian Retail sales and trade balance figures at 2.30am. US Unemployment weekly claims at 1.30pm GMT+1.
Levels to watch/live orders:
- Buys: Flat (stop loss: N/A).
- Sells: 0.8075 region ([waiting for a reasonably sized H4 bearish candle to form – preferably a full, or near-full-bodied candle – is advised] stop loss: ideally beyond the candle's wick).
USD/JPY
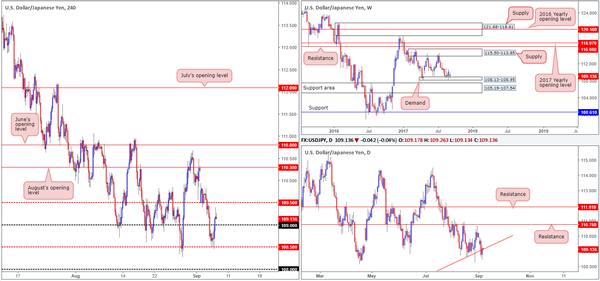
The USD/JPY corrected sharply higher from the H4 mid-level support at 108.50 during trade on Wednesday, bidding price above the 109 handle into the closing bell. Technically speaking, this likely has something to do with the fact that weekly price is trading from demand at 108.13-108.95, as well as the USDX also bouncing from weekly support at 11854. Also of particular interest is daily price recently closed back above the trendline support extended from the 100.08. The next upside target from this point can be seen at resistance fixed from 110.76.
Suggestions: As long as 109 holds as support, we feel further upside could be on the cards. Would we trade long from this number? It is certainly an option, but we believe it would only be a viable buy zone if, and only if, additional lower-timeframe confirmation is seen (see the top of this report for ideas on how to trade using lower-timeframe action).
Data points to consider: US Unemployment weekly claims at 1.30pm GMT+1.
Levels to watch/live orders:
- Buys: 109 region ([waiting for lower-timeframe confirmation to present itself is advised] stop loss: dependent on where one confirms this number).
- Sells: Flat (stop loss: N/A).
USD/CAD
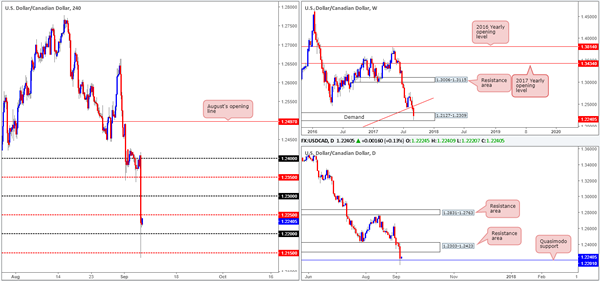
Going into the early hours of yesterday's US segment, the Bank of Canada surprised the markets by increasing interest rates by 25bps. The after-effects saw the USD/CAD aggressively tumble over 200 pips lower, dipping below 1.2200 before finding refuge around the H4 mid-level support 1.2150.
Following yesterday's excitement, the technical landscape shows weekly price sited within the walls of a demand area coming in at 1.2127-1.2309 drawn from as far back as June 2015. Alongside this, daily price recently hammered its way through 1.2303-1.2423, and shook hands with a Quasimodo support at 1.2201.
Suggestions: Despite weekly and daily price trading from supports, a long on the H4 timeframe is challenging with 1.2250 lurking just ahead. A H4 close above this number would likely confirm buying up to the 1.23 mark and also further confirm strength from the higher-timeframe supports. However, there's one caveat here! The 1.23 handle converges with the underside of the recently broken support area (now acting resistance zone). Therefore, even if one manages to buy this market above 1.2250, there will likely be less than 40 pips of room to play with before a major target comes into view. And considering that the underlying trend on this pair is firmly pointing south, this would be a challenging long, in our humble opinion. As such, remaining flat until more conducive price action presents itself is the route we have chosen to take.
Data points to consider: US Unemployment weekly claims at 1.30pm. Canadian Building permits at 1.30pm, followed by Crude oil inventories at 4pm GMT+1.
Levels to watch/live orders:
- Buys: Flat (stop loss: N/A).
- Sells: Flat (stop loss: N/A).
USD/CHF
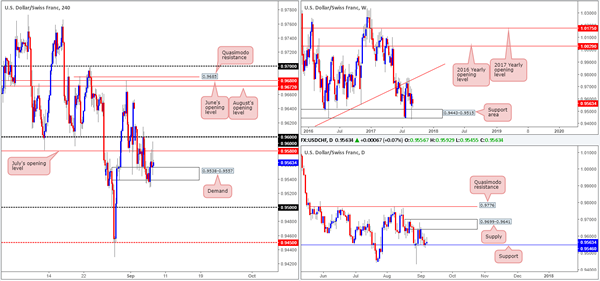
Along similar lines to its inversely correlated cousin the EUR/USD, the Swissy also ended Wednesday's session relatively unchanged. The bounce from H4 demand at 0.9538-0.9557, as you can see, failed to gain much upside trajectory as July's opening level at 0.9580 was heavily offered.
With H4 bids/offers trading even at the moment, let's take a peek at what the higher timeframes are up to. Weekly flow remains loitering above a support area coming in at 0.9443-0.9515, while down on the daily timeframe the candles are currently bolstered by support at 0.9546.
With upside slightly favored according to daily structure, a H4 close above 0.96 would ideally need to be seen before longs could be considered. Having said that though, even with this price action it would still be a challenging market to buy since there's a nearby daily supply positioned at 0.9699-0.9641!
Suggestions: Owing to the above notes, there's very little to hang our hat on at this time. Therefore, remaining on the sidelines appears the safer route for now.
Data points to consider: US Unemployment weekly claims at 1.30pm GMT+1.
Levels to watch/live orders:
- Buys: Flat (stop loss: N/A).
- Sells: Flat (stop loss: N/A).
DOW 30
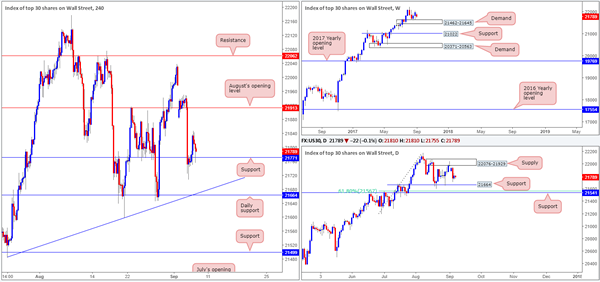
Leaving daily support at 21664 unchallenged, the H4 candles managed to reclaim the 21771 mark and later retest the number as support. With weekly buyers seen holding above demand at 21462-21645, this support could maintain a presence in this market and eventually drag the index up to August's opening level at 21913. This is, of course, if daily sellers don't flood the market to connect with the aforementioned daily support.
Our suggestions: Given that the US equity market is still entrenched within an incredibly strong uptrend, this could – coupled with weekly demand and the current H4 support – potentially force prices higher today. However, we would only consider a long position here if price crosses swords with the daily support mentioned above at 21664. Not only because of it converging with a H4 trendline support taken from the low 21484, but also because this will bring daily bulls into the picture as well as weekly and H4 bulls.
Data points to consider: US Unemployment weekly claims at 1.30pm GMT+1.
Levels to watch/live orders:
- Buys: 21664 region ([waiting for a reasonably sized H4 bullish candle to form – preferably a full, or near-full-bodied candle – is advised] stop loss: ideally beyond the candle's tail).
- Sells: Flat (stop loss: N/A).
GOLD
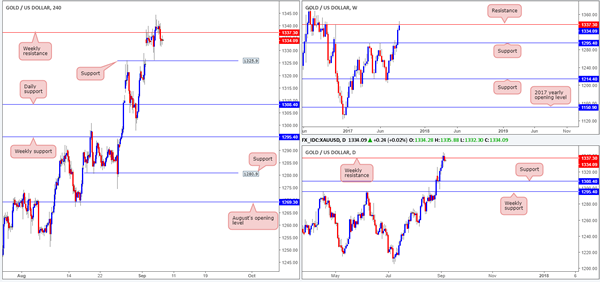
Gold prices dipped amid yesterday's US segment, consequently dragging the H4 candles back below weekly resistance at 1337.3. For those who read Wednesday's report you may recall that we said if a H4 candle closes below weekly resistance at 1337.3, this, to us, would be considered a bearish signal, and one worth trading back down to daily support at 1308.4. With that in mind, our desk has taken a small short position at 1334.6 with a stop-loss order positioned at 1341.2.
Our suggestions: The ultimate goal for the current trade is the daily support mentioned above at 1308.4. We remain relatively confident in our trading idea, simply because the US dollar is trading from weekly support at 11854. A dollar advance usually translates into a declining gold market. However, when/if a H4 close prints beyond H4 support at 1325.9, this could be used as a respectable trigger to reduce risk to breakeven.
Levels to watch/live orders:
- Buys: Flat (stop loss: N/A).
- Sells: 1334.6 ([live] stop loss: 1341.2).