Sample Category Title
Weekly Market Outlook: EURCHF Is Heading Higher But Not For Long
- Japan: Strong Upside Pressures On The Yen - Yann Quelenn
- RBA To Use Verbal Intervention - Arnaud Masset
- EURCHF Is Heading Higher But Not For Long - Yann Quelenn
- Video Game Industry
Economics - Japan: Strong Upside Pressures On The Yen
Japan's growth came in, earlier last week, way higher than forecasts at 1% q/q versus 0.6% for the second quarter. Annually speaking, this release is the best data since 2 years and a half. It also represents the sixth consecutive quarter of positive GDP growth.
Consumer spending has largely improved. Indeed it rose 0.9% from Q1 and beat estimates of 0.5% in Q2. It is true that consumer spending has always been the weakest point of the Japanese economy.
Recent fundamentals are good news for the Bank of Japan which is nonetheless still the only major central bank not able to hint about further tightening. For the time being, those recent good data must at some point translate into inflation. Nationwide inflation stands at 0.4% y/y way below the inflation target of 2% despite the Abenomics and the massive quantitative easing. The BoJ monetary policy can still not be considered as a success. The only inflation created was rather… in the stock market. The Nikkei 225 increased by 16% over the last 12 months.
These improving fundamentals are translating into a strengthening currency. The Japanese yen is on a clear bullish momentum. The currency has outperformed major G-10 currencies since last month. In particular, the USDJPY has weakened from 114 in a month. The rally may now seem a bit over extended and we may see some rebound within the short-term. Anyway the pair is riding a downtrend channel and there are definitely some more room for further weakness.
Japanese bond yield keeps on declining. The 10-year bond is back is heading back towards 0. The current rate is the lowest since last October. This indicates that the demand for inflation-linked bonds are actually very low. Markets are then estimating than inflation should remain low over the next decade!
This is a clear pessimistic view about the economic environment which should remain deflationary. A stronger yen will continue weighing on consumer prices. Japan vicious circle is set to continue. And we remember that a month early the BoJ has downgraded its inflation forecast for fiscal years 17/18 and 18/19. The central bank inflation target seems a difficult objective and upside risks on the currency should very likely continue, especially against the greenback with Trump failing to deliver his reforms.
Economies - RBA To Use Verbal Intervention
AUD bounces back amid broad USD weakness
The Australian dollar has traded with a clear downside bias since the beginning of the month as investors wondered whether further gains were sustainable against the backdrop of a weak inflation reading in the second quarter, mounting expectations for a US dollar rally and the potential reaction of the central bank that is concerned about the negative effects of a strong Aussie on the economy.
The Reserve Bank of Australia published the minutes of its August meeting last Monday. The minutes revealed that the central bank was quite optimistic regarding consumption, saying that "rising employment and stronger household income growth were expected to support consumption growth". However, the RBA noted that, despite a strengthening in economic condition, further appreciation of the AUD could derail the ongoing economic recovery as well as the pick-up in inflation. In the foreseeable future, we expect the RBA to maintain its neutral stance, waiting for the Fed to make the first move. However, further strength in the Australian currency may trigger verbal interventions from Governor Lowe.
Investors favour AUD amid lack of clear driver in this USA
However, over the last couple of days, the Aussie started to gain traction again, with AUD/USD erasing early week's losses and returning above $0.79. Despite being sold-off for several weeks, the greenback is still unable to reverse definitely momentum, mainly because of a continuous flow of negative signals from the US. The minutes of the last FOMC meeting highlighted a broad division among Fed members.
More specifically, the timing of the balance run-off was a major topic of discussion as several members were willing to pull the trigger last month, while the majority preferred to wait. In addition, the worsening of the political situation in the US - many of Trump's business counsellors resigned - dissuaded investors to go long the dollar.
All in all, we think that a USD recovery is becoming inevitable but continues to be delay amid strong political turmoil in the US and lacklustre economic data. Against this backdrop, higher yielding currencies such as the Aussie are naturally favoured by investors. Moreover, the improving economic outlook helps to restore confidence in the export-dependent country. We cannot further Aussie gains in the short-term, however the closer we get to the upcoming Fed meeting, the stronger the USD will be.
Economics - EURCHF Is Heading Higher But Not For Long
The Helvetic currency is suffering against the euro and the pair has been riding up and down between 1.12 and 1.1500. It is the highest level of the CHF since the SNB unpegged the CHF from the euro in January 2015. We nonetheless do not believe that the pair will continue to head towards 1.20 and the ongoing move may not be sustainable in the medium-term.
The fundamentals behind the recent surge of the single currency against the euro appears unclear. The economic and political situation have not changed during the summer. Yet we consider that this is only a catch-up as the euro strengthened against major G10 currencies on growing expectations of the Eurozone recovery.
Markets now expect the ECB to narrow the monetary policy divergence with the Fed. At the ECB meeting that will be held in September, there are strong expectations that the asset purchase programme should be reduced. But the ECB has often been cautious over the past years about tightening measures. This is even truer that inflationary pressures are decreasing. There is a clear risk that markets will get disappointed. European geopolitical tensions are also very calm during this summer. It is also important to remember that the massive Greek debt issue is far from solved and this will likely weigh again on the European Union unity. We recall that Greece must receive other bailouts only to service its debt. On top of that the debt situation of other European countries will, in lack of inflation, pressure the single currency.
Those basic reasons are our rationale on why downside pressures on the EURCHF pair are set to appear again. Markets definitely overestimate the Eurozone recovery. We consider that it is likely that the pair gets back lower towards 1.10 within the medium-term.

Themes Trading - Video Game Industry
Much ground has been covered since the first video game consoles of the early 70s, which offered only 2D games in black and white and with no sound. Since then, the video game industry has been growing exponentially as computer technology has advanced. Nowadays, blockbuster video games enjoy massive budgets, easily surpassing those of Hollywood movies: budgets in excess of $100 million are not uncommon. According to the ESAF, computer and video game sales in the US alone reached $15.4 billion in 2014, more than double the 2007 figure of $7.3 billion. However, the fastest growth is coming from social network gaming, mobile apps and online gaming, which represent more than 65% of the total revenue.
The video game industry is evolving faster than any other, constantly adapting to the latest technological breakthrough. The industry has already embarked on its latest mutation. However, it's not too late to be a part of it. We built this theme with the aim of offering exposure to the whole video game market, from traditional physical media distribution and console builders to new market entrants. We have overweighted the fast-growing part of the industry, meaning companies active in digital distribution, mobile app development and online gaming-related companies.

Weekly Focus: ECB’s QE Again in Focus at Jackson Hole
Market Movers ahead
- Next week's key event is the Jackson Hole symposium where ECB president Mario Draghi is among the speakers for the first time in three years. In 2014, he hinted at QE and now the focus is on tapering signals. Fed members should not reveal anything dramatic.
- Data wise, a number of survey indicators for August will give additional insight into the strength of the global economy at the beginning of H2. The figures due for release include the US and euro area PMIs, German ifo expectations as well as ZEW expectations and consumer confidence in the euro area.
- In Scandi markets focus will be on Norwegian GDP growth in Q2 and the oil investment survey for Q3, Swedish labour market data as well as Danish employment, retail sales and consumer confidence.
Global macro and market themes
- We stress that risks to our newly updated yield forecasts are that the drivers we see for higher yields in 2018 materialise much earlier than we forecast. This is especially the case for the US fixed income market.
- First of all, our business cycle model, Macroscope, is predicting that the US economy will re-accelerate in the coming months. This is contrary to market consensus.
- Secondly, we are in a situation where the market is positioned for lower yields. When the market is caught wrong-footed it often leads to exaggerated moves.
- Thirdly, the market has flattened the US money market curve and has only priced a 40% probability of a new rate hike. We think the market underestimates the risk of a December rate hike.
Loonie Spikes on Rising Inflation; Consumer Sentiment Provides Some Relief to Weak Dollar
Ahead of the US session open, a jump in the Canadian dollar was one of the biggest moves of the day following the inflation figures out today. The release of the Michigan consumer sentiment index that surprised to the upside provided an early lift to the weak dollar. However, the greenback was still down against most majors due to a heavy plunge in the prior few sessions. The dollar index fell around 0.30% to last trade at 93.36.
The Canadian statistics office issued a report signaling positive movement in consumer prices and gave hopes to investors about another potential rate hike this year by the Canadian Central Bank. Annual inflation accelerated to 1.2% in July, mirroring economists' expectations and coming off the almost two-year low of 1% recorded in June. The average of the BOC's three core inflation measures was 1.5%, rising from 1.4% in June and 1.3% in May that was the slowest since 1999. Investors ignored the monthly miss in the forecasted inflation figure (expected as a gain of 0.1%) as the number for July showed a 0.1% decline in the CPI. The loonie strengthened with the dollar/loonie pair tumbling immediately following the release to 1.2581 from 1.2656 before the release. The dollar managed to recoup some of the losses due to the consumer sentiment figures, with the pair last trading at 1.2595 in early hours of US trading.
Other forex majors either held on early gains or advanced further as the dollar continued weakening. The aussie was up at $0.7913 and the kiwi was last trading at $0.7322. The euro strengthened to $1.1747, while the pound was last at $1.2873.
The preliminary reading of the Michigan consumer sentiment index rose to 97.6 in August, beating expectations of 94.0 and rising above the 93.4 July figure. The dollar advanced on the data, though it offset only a small part of its earlier losses. Dollar/yen was last trading still below the 109 mark at 108.77.
The US currency hot hammered this week as investors continue to be worried about the most recent developments in Washington DC surrounding President Trump. Market participants lack confidence that the President and his administration have the ability to pass through any major legislation. The worries were renewed following the violence in Virginia and President's actions and remarks regarding those events.
Gold prices were testing the $1,300 an ounce mark during late hours of European trading linked to the weakness in the dollar. However, due to the upbeat set of data from the University of Michigan on consumer sentiment, the dollar strengthened and gold prices gave up on some of their gains to last trade at $1,295.12 an ounce.
Oil prices were pressured ahead of the Baker Hughes oil rig count data that is due to be released later today. WTI was last trading at $46.97 a barrel and Brent was at $50.95.
Euro Recovers After Drop Following Barcelona Attack
EUR/USD has edged higher in the Friday session, after losing ground on Thursday. On the release front, it's a quiet end to the week. German PPI improved to 0.2%, beating the estimate of 0.0%. Euro zone current account disappointed, as the surplus narrowed to EUR 21.2 billion, well off the estimate of EUR 27.3 billion. This marked the smallest current account surplus since July 2016. In the US, there was one key event, as UoM Consumer Sentiment improved to 97.6, beating the estimate of 94.0 points.
Geopolitical events continue to have a strong impact on the currency markets. Earlier in August, it was the crisis between the US and North Korea. On Thursday, it was yet another terror attack in Western Europe, this time in Barcelona, Spain. The car-ramming attack killed 12 and wounded dozens, and the euro responded with losses, as the currency touched 3-week lows. Investors are understandably on edge, but the euro has steadied on Friday, and things should return to normal next week, barring another attack in Western Europe. On the inflation front, there was positive news as German PPI improved to 0.2%, marking a 3-month high.
The euro remains at high levels, as growing political risk in the United States has weighed on the US dollar. President Trump's administration continues to spend most of its focus and energy on damage control, and the latest fiasco for Trump has been the alt-right protest in Charlottesville, where one protester was killed by a suspected white supremacist. Trump's belated condemnation of white supremacists and his insistence on blaming the violence on both the white supremacists and the counter-protesters has drawn wall-to-wall criticism from both Democrat and Republican lawmakers. Trump remains defiant and continues to attack his critics, but the events around Charlottesville have only served to tarnish his image and raised growing concerns about his presidency.
Loonie Hits Fresh Two-week High as Consumer Prices Bounce on an Annual Basis
On Friday, figures out of Canada showed that inflation in July strengthened year-on-year in line with expectations, increasing the odds for another rate hike this year. As a result, the loonie extended its uptrend against its US counterpart.
Based on Statistics Canada, consumer prices in the last twelve months grew as expected by 1.2% as six out of the eight major CPI components showed improvement during the month - this followed a rise by 1.0% in June. Particularly, increases in transportation and shelter costs contributed the most to the rise. Gasoline prices also jumped substantially by 4.6% y/y after decreasing by 1.4% in June.
On a monthly basis, consumer prices remained unchanged, while analysts anticipated inflation to turn positive from a negative 0.1% seen in June to a positive 0.1%.
Two of the three measures the Bank of Canada prefers to use in its policy making were also up on a yearly basis. CPI median, which reports the median inflation across CPI components, ticked up by 0.1 percentage point to 1.7%, while CPI trim which removes outliers edged up by an equivalent amount to 1.3%. Finally, CPI common, an alternative measure of underlying inflation that is utilized by the BOC, remained unchanged at 1.4%.
Although headline inflation is still below the 2% BOC target, its recent pickup and the fact that GDP growth continued climbing in the first quarter of the year, heightened the chances for another rate hike to be delivered this year. Moreover, the BOC supported in its July monetary statement that economic growth has become more sustainable, while weakness in inflation is likely to be temporary. However, the bank said that it will wait for further clues on economic conditions before tightening its monetary policy further. Note that the BOC increased rates or the first time in seven years in July.
Looking at the reaction in the forex markets, the loonie hit a fresh two-week high against the greenback, with dollar/loonie sinking immediately by 0.64% to 1.2575. Afterwards, the pair managed to climb to 1.2596.
GBPJPY Holding in Steep Downtrend
The cross is holding in steep downtrend for the third straight day, as strong demand for safe haven yen maintains pressure on the pair. Fresh acceleration lower on Friday dented psychological 140.00 support, opening way towards key support at 138.66 (12 June low) to fully retrace 138.66/147.77 recovery rally. Daily studies are full bearish setup and maintain strong downside pressure, with additional bearish signal coming from formation of 10/200SMA death-cross. Close below 140.00 will be an additional bearish signal, as the pair is on track for the third straight bearish weekly close. However, daily RSI and slow stochastic entered oversold territory and corrective action on profit-taking / oversold studies could be expected in coming sessions. Likely scenario could be seen as hesitation on approach to key 138.66 support.
Res: 140.40; 140.86; 141.09; 141.62
Sup: 139.84; 139.19; 139.00; 138.66
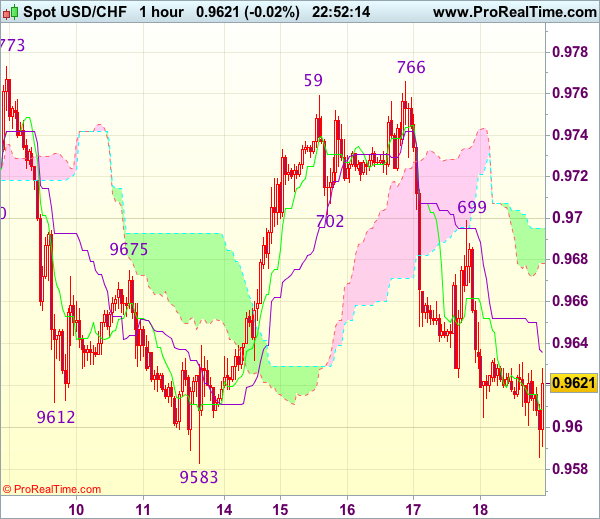
Trade Idea Wrap-up: USD/CHF – Stand aside
USD/CHF - 0.9622
Most recent candlesticks pattern : N/A
Trend : Sideways
Tenkan-Sen level : 0.9609
Kijun-Sen level : 0.9623
Ichimoku cloud top : 0.9695
Ichimoku cloud bottom : 0.9678
New strategy :
Stand aside
Position : -
Target : -
Stop : -
As the greenback has remained under pressure after yesterday’s selloff from 0.9699, suggesting near term downside risk remains for the fall from 0.9766 to extend weakness to previous support at 0.9583, however, break there is needed to retain bearishness and signal another leg of decline from 0.9773 is underway and extend subsequent fall to 0.9550, then 0.9515-20 which is likely to hold on first testing.
In view of this, would not chase this fall and stand aside for now. Above 0.9660-65 would bring another bounce to 0.9699 resistance but break there is needed to signal the fall from 0.9766 has ended, bring a stronger rebound to 0.9720-30, however, as broad outlook remains consolidative, said resistance at 0.9766 should hold.
Trade Idea Wrap-up: GBP/USD – Sell at 1.2935
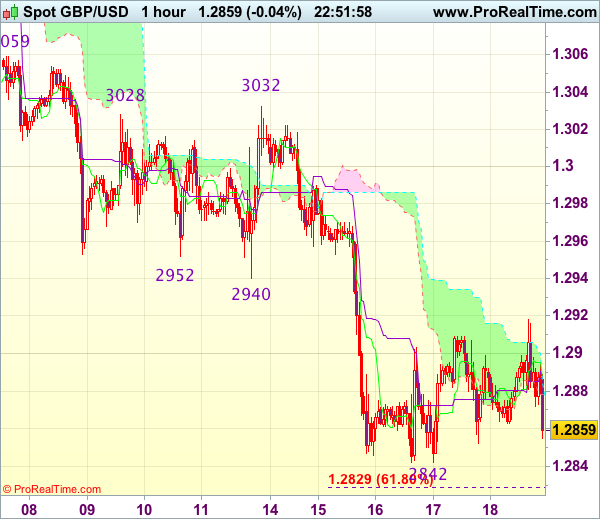
GBP/USD - 1.2863
Most recent candlesticks pattern : N/A
Trend : Near term down
Tenkan-Sen level : 1.2887
Kijun-Sen level : 1.2887
Ichimoku cloud top : 1.2878
Ichimoku cloud bottom : 1.2876
Original strategy :
Sell at 1.2935, Target: 1.2835, Stop: 1.2970
Position : -
Target : -
Stop : -
New strategy :
Sell at 1.2935, Target: 1.2835, Stop: 1.2970
Position : -
Target : -
Stop : -
As cable recovered after falling to 1.2842 earlier this week, suggesting consolidation above this level would be seen and corrective bounce to 1.2920 cannot be ruled out, however, reckon previous support at 1.2933-40 would turn into resistance and limit upside, bring another decline later, below said support at 1.2842 would extend recent selloff to 1.2825-30 (61.8% projection of 1.3269-1.2940 measuring from 1.3032), having said that, oversold condition should limit downside to 1.2800 and reckon 1.2770 would hold from here, bring rebound later.
In view of this, would not chase this fall here and would be prudent to sell sterling on recovery as said previous support at 1.2933 should cap cable’s upside, bring another decline. Above 1.2950 would defer and risk a stronger rebound to 1.2990-00 before another decline.
Trade Idea Wrap-up: EUR/USD – Hold long entered at 1.1715
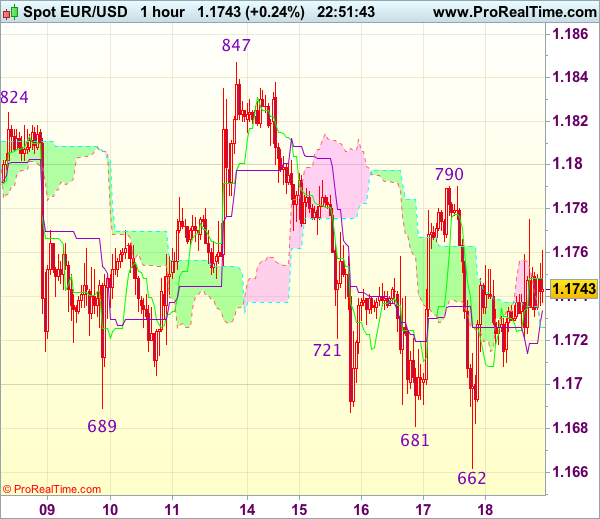
EUR/USD - 1.1749
Most recent candlesticks pattern : N/A
Trend : Sideways
Tenkan-Sen level : 1.1748
Kijun-Sen level : 1.1742
Ichimoku cloud top : 1.1726
Ichimoku cloud bottom : 1.1726
Original strategy :
Bought at 1.1715, Target: 1.1815, Stop: 1.1680
Position : - Long at 1.1715
Target : - 1.1815
Stop : - 1.1680
New strategy :
Hold long entered at 1.1715, Target: 1.1815, Stop: 1.1705
Position : - Long at 1.1715
Target : - 1.1815
Stop : - 1.1705
Although the single currency fell briefly to 1.1662 yesterday, the subsequent rebound suggests a temporary low is possibly formed there and consolidation with mild upside bias remains for another test of indicated resistance at 1.1790, however, break there is needed to add credence to this view, bring further gain to 1.1820 but resistance at 1.1847 should hold from here.
In view of this, we are holding on to our long position entered at 1.1715. Below 1.1680-85 would risk retest of 1.1662, break there would extend the erratic decline from 1.1910 top to 1.1640-50 (50% Fibonacci retracement of 1.1370-1.1910 and previous support) but reckon 1.1600 would hold from here.
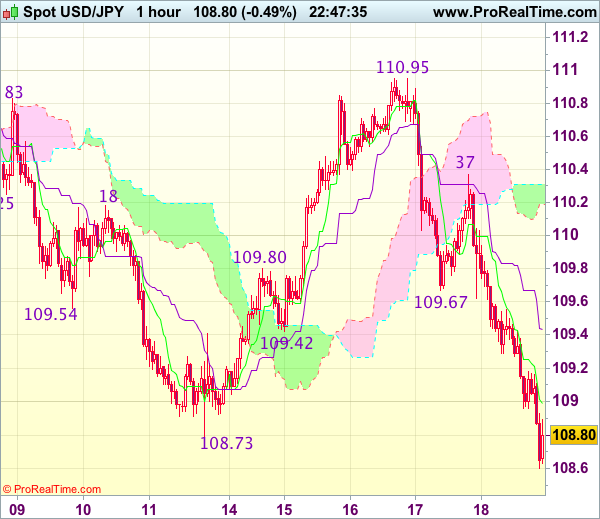
Trade Idea Wrap-up: USD/JPY – Stand aside
USD/JPY - 108.79
Most recent candlesticks pattern : N/A
Trend : Near term down
Tenkan-Sen level : 108.89
Kijun-Sen level : 109.32
Ichimoku cloud top : 110.31
Ichimoku cloud bottom : 110.19
New strategy :
Stand aside
Position : -
Target : -
Stop : -
Although the greenback has fallen again after meeting renewed selling interest at 110.37 and near term downside risk remains for recent decline to extend weakness towards 108.50, near term oversold condition should prevent sharp fall below 108.20-25 and reckon 108.00 would hold from here, bring rebound later.
In view of this, would not chase this fall here and would be prudent to stand aside for now. Above the Kijun-Sen (now at 109.32) would bring recovery towards previous support at 109.67 (now resistance), however, break there is needed to signal low is possibly formed, bring rebound towards 110.00.