Sample Category Title
Market Update – European Session: Risk Aversion Sentiment Re-Emerges Ahead Of Weekend
Notes/Observations
Market sentiment turning towards safe-haven flows; terrorist attacks in Spain's Barcelona and Cambrils as well as rumors about the possible resignation of Trump's economic advisor Gary Cohn boost risk aversion
Overnight
Europe:
Islamic State claimed responsibility for van attack in Barcelona that killed over a dozen and injured over 100
UK Govt to issue position papers on Aug 21st on confidentiality of EU information obtained before Brexit and goods placed on supply chains in single market before Brexit
Americas:
Fed Chair Yellen scheduled to speak at Jackson Hole Symposium on Friday, Aug 25th with her remarks to focus on "financial stability"
Fed's Kashkari (dove, voter): Fed will consider debt ceiling debate when deciding the start of running down balance sheet. Difficult to see how the math works for fast US GDP growth
Economic data
(DE) Germany July PPI M/M: 0.2% v 0.0%e; Y/Y: 2.3% v 2.2%e
(EU) Euro Zone Jun Current Account (Seasonally Adj): €21.2B v €30.5B prior; Current Account NSA: €28.1B v €17.9B prior
(IT) Italy Jun Current Account Balance: €5.3B v €2.3B prior
(IT) Italy Jun General Government Debt: €2.281T (record high) v €2.279T prior
(EU) Euro Zone Jun Construction Output M/M: -0.5% v -0.2% prior; Y/Y: 3.4% v 2.7% prior
Fixed Income Issuance:
(IN) India sold total INR150B vs. INR150B in 2022, 2029, 2033 and 2051 bonds
SPEAKERS/FIXED INCOME/FX/COMMODITIES/ERRATUM
Equities
Indices [Stoxx600 -1.0% at 373.3, FTSE -1.1% at 7310, DAX -0.9% at 12093, CAC-40 -1.2% at 5083, IBEX-35 -1.2% at 10321, FTSE MIB -0.9% at 21601, SMI -1.0% at 8857, S&P 500 Futures -0.2%]
Market Focal Points/Key Themes:
European Indices trade sharply lower following on from the steep losses seen on Wall Street overnight, with the French CAC and Spanish IBEX leading declines. Yesterday's terror attack in Spain weighed on sentiment with Travel and Leisure stocks the leading the decliners, with sharp falls in some of Europe's major airlines.
Elsewhere Vopak shares trade sharply lower after cutting its FY17 outlook, whilst shares of Fiat Chrysler trades lower after Guangzhou Auto said it has no plans to acquire Fiat.
Looking ahead notable earners include Deere & Co, Footlocker and Estee Lauder.
Equities
Consumer discretionary [Air France [AF.FR] -2.8%, Int Con Airlines [IAG.UK] -2.5% (Earnings), Lufthansa [LHA.DE] -1.6%, Easyjet [EZJ.UK] -2.2%, Ryanair [RYA.UK] -2.5% (Barcelona Terror Attack), Fiat [FCA.IT] -1.6% (Guangzhou Auto notes no current plan to acquire Fiat )]
Telecom: [Medivir [MVIRB.SE] +3.6% (Licenses exclusive rights to MIV-802 for Greater China to Ascletis)]
Healthcare: [ Nicox [COX.FR] +5.8% (Announces that its Exclusive Licensee Submits response to CRL for latanoprostene bunod ophthalmic solution, 0.024%), Astrazeneca [AZN.UK] -1.1% (FDA approves ovarian cancer treatment Lynparza Tablets) ]
Real Estate: [Vopak [VPK.NL] -8.6% (Earnings)]
Speakers
South Africa Mining Min Zwane stated that mining charter requirements are achievable and would continue to strengthen its laws in the sector
Taiwan Fin Min Sheu Yu-Jer: To raise corporate tax rate and cut individual rates
China Banking Regulator (CBRC) Xiao Yuanqi: To issue new regulations to crackdown on illicit banking activities. To limit impact on economy amid stronger supervision
S&P affirmed South Korea sovereign rating at AA; outlook stable. Geopolitical risks on Peninsula would not escalate with a direct armed conflict unlikely
Currencies
FX markets were subdued on Friday with focus turning to next week’s Jackson Hole symposium. Currency flows favored safe-haven assets with Yen and Swissie slightly firmer (spot gold probing the $1,300/oz)
EUR/USD trying to recover from perceived ECB concern over any FX overshoot. USD remains vulnerable to President Trump's inability to date in trying to push through the pro-growth measures
Fixed Income
Bund futures trades at 164.36 up 4 ticks as thin summer trading continues. Downside targets 163.50 followed by 162.56. To the upside the 164.50 to 165.20 remains key resistance.
Gilt futures trades at 127.83 up 13 ticks as Bunds and Treasuries remain underpinned by tensions in the White House. A resumption to the upside could eye 128.25 then 128.75. A move back below 126.51 targets 125.97
Friday’s liquidity report showed Thursday's use of the marginal lending facility fell to €123M from €174M prior.
Corporate issuance saw $1.15 come to market via 2 issuers headlined by Ipalco Enterprises $405M senior secure offering, and H&E $750M senior notes offering. For the week ending August 16th IG Funds reported inflows of $2.43B, while High Yields funds reported inflows of $2.19B
Looking Ahead
(ZA) South Africa to sell combined ZAR650M in 2025, 2029 and 2046 I/Lbonds
(BR) Brazil Aug CNI Industrial Confidence: No est v 50.6 prior
06:00 (PT) Portugal July PPI M/M: No est v -0.2% prior; Y/Y: No est v 2.7% prior
06:00 (UK) DMO to sell combined £5.5B in 1-month, 3-month and 6-month bills
06:30 (IS) Iceland to sell bills
07:00 (BR) Brazil Aug IGP-M Inflation (2nd Preview): 0.0%e v -0.7 % prior
07:30 (CL) Chile Q2 GDP Q/Q: 0.7%e v 0.2% prior; Y/Y: 1.0%e v 0.1% prior
07:30 (CL) Chile Q2 Current Account Balance: -$1.3Be v -$1.0B prior
07:30 (IN) Weekly India Forex Reserve data
08:00 (PL) Poland July Sold Industrial Output M/M: -6.7%e v +2.7% prior; Y/Y: 8.4%e v 4.5% prior; Construction Output Y/Y: 13.3%e v 11.6% prior
08:00 (PL) Poland July Retail Sales M/M: 1.4%e v 0.9% prior; Y/Y: 7.9%e v 6.0% prior; Real Retail Sales Y/Y: 7.4%e v 5.8% prior
08:00 (PL) Poland July PPI M/M: 0.0%e v -0.4% prior; Y/Y: 2.0%e v 1.8% prior
08:00 (UK) Baltic Dry Bulk Index
08:30 (CA) Canada July CPI M/M: 0.0%e v -0.1% prior; Y/Y: 1.2%e v 1.0% prior; Consumer Price Index: 130.4e v 130.4 prior
08:30 (CA) Canada CPI Core- Common Y/Y: No est v 1.4% prior;CPI Core- Trim Y/Y: No est v 1.6% prior; CPI Core- Median Y/Y: No est v 1.2% prior
10:00 (US) Aug Preliminary University of Michigan Confidence: 94.0e v 93.4 prior
11:00 (EU) Potential Sovereign ratings following European close
(EG) Egypt Sovereign Debt to be rated by Moody's
(RO) Romania Sovereign Debt to be rated by Moody's
(GR) Greece Sovereign Debt to be rated by Fitch
(IE) Ireland Sovereign Debt to be rated by Canadian rating agency DBRS
(BE) Belgium Sovereign Debt to be rated by Canadian rating agency DBRS
13:00 (US) Weekly Baker Hughes Rig Count data
13:00 (CO) Colombia Central Bank Quarterly Inflation Report
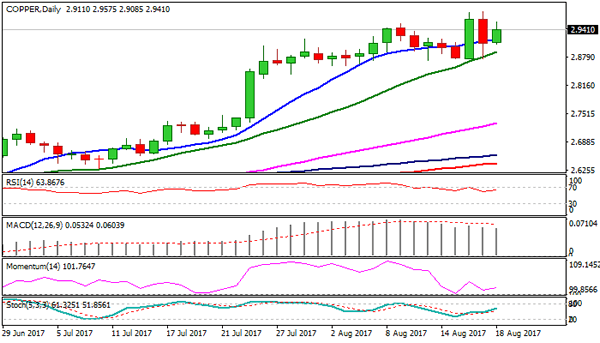
Technical Outlook: Copper – Weak Dollar And Firm Fundaments Keep Focus At Psychological 3.0000 Barrier
Copper contract for September delivery is holding firm tone on Friday but stays below fresh highs at 2.9780 and 2.9810, posted on Wed/Thu (the highest traded since Nov 2014.
Strong bullish sentiment keeps meta well supported as expectations that reforms in China’s metal industry will curb supply against a background of strong demand as China is world’s top consumer of copper.
Toppish daily studies suggest that price may extend consolidation before resuming its steep uptrend, as strong fundaments and weaker dollar continue to underpin the metal’s price.
Break above former top at 2.9540 (peak of 05 May 2015), requires weekly close above for confirmation, with psychological 3.0000 barrier coming in focus.
Broken Tenkan-sen offers initial support at 2.9257 and guarding higher base at 2.8745.
Res: 2.9575, 2.9780, 2.9810, 3.0000
Sup: 2.9257, 2.9000, 2.8745, 2.8590
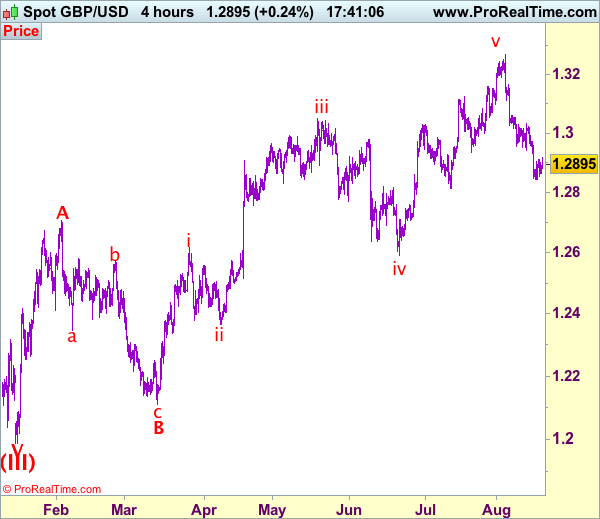
Trade Idea: GBP/USD – Sell at 1.2980
GBP/USD – 1.2891
Original strategy :
Sell at 1.2980, Target: 1.2815, Stop: 1.3040
Position: -
Target: -
Stop: -
New strategy :
Sell at 1.2980, Target: 1.2815, Stop: 1.3040
Position: -
Target: -
Stop:-
As cable has recovered after holding above this week’s low at 1.2842, retaining our view that consolidation above this level would be seen and corrective bounce to 1.2950 is likely, however, reckon upside would be limited to 1.2980-90 and bring another decline, below said support at 1.2842 would add credence to our view that the selloff from 1.3269 top is still in progress and bearishness remains for this move to bring correction of early upmove, hence further weakness to 1.2812 support would be seen but near term oversold condition should prevent sharp fall below 1.2800 and reckon 1.2740-50 would hold on first testing, bring rebound later.
In view of this, would not chase this fall here and would be prudent to sell cable on recovery as 1.2980-90 should limit upside, above resistance at 1.3032 would defer and suggest low is formed, risk a stronger rebound to 1.3059 and possibly towards 1.3100 but previous support at 1.3112 (now resistance) should remain intact, bring another decline.
Our preferred count on the daily chart is that cable's rebound from 1.3500 (wave (A) trough) is unfolding as a wave (B) with A ended at 1.7043, followed by triangle wave B and wave C as well as wave (B) has ended at 1.7192, the subsequent selloff is the larger degree wave (C) which is still unfolding with minor wave (III) of larger degree wave 3 ended at 1.1986, hence wave (IV) correction is in progress which could either be a triangle wave (IV) of a complex formation but upside should be limited to 1.3500 and price should falter well below 1.4000, bring another decline in wave (V) of 3 for weakness to 1.1500, then 1.1200.
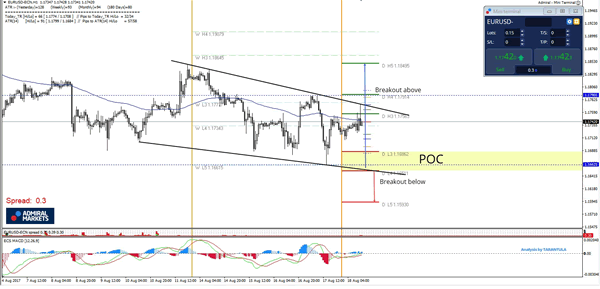
Daily Technical Analysis: EUR/USD Still Bought On Dips
The EUR/USD has been bought on dips exactly from the zone I showed during Live trading webinar. Major weekly L5 support is still keeping the pair within the bullish range with a potential to break above 1.1790. If the pair drops to POC zone (W L5, D L4, trend line, ATR low) 1.1680-50 it could possibly spike again towards 1.1755. Above there is cluster of resistance 1.1777, 1.1790 and 1.1800. Only above 1.1800 (ATR high) we can see a continuation towards 1.1850, 1.1864 and 1.1907.
However a loss of 1.1650 should tank the pair down to 1.1593.
W L3 - Weekly Camarilla Pivot (Weekly Interim Support)
W H3 - Weekly Camarilla Pivot (Weekly Interim Resistance)
W H4 - Weekly Camarilla Pivot (Strong Weekly Resistance)
D H4 - Daily Camarilla Pivot (Very Strong Daily Resistance)
D L3 – Daily Camarilla Pivot (Daily Support)
D L4 – Daily H4 Camarilla (Very Strong Daily Support)
POC - Point Of Confluence (The zone where we expect price to react aka entry zone)
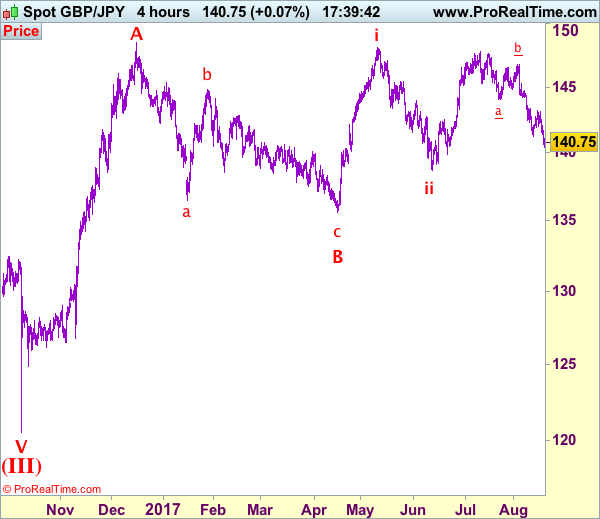
Trade Idea: GBP/JPY – Sell at 141.20
GBP/JPY - 140.65
New strategy :
Sell at 141.20, Target: 139.20, Stop: 141.80
Position: -
Target: -
Stop:-
As the British pound has remained under pressure after breaking below previous support at 141.25 (now resistance), suggesting recent decline from 147.75 top is still in progress and bearishness is seen for this move to extend weakness to 140.00, then test of previous support at 139.85, however, loss of downward momentum should prevent sharp fall below 139.20-30 and price should stay well above previous support at 138.70.
On the upside, whilst recovery to 141.00-10 cannot be ruled out, reckon upside would be limited to previous support at 141.25 (now resistance) and bring another decline later. Only break of resistance at 142.05 would suggest low is possibly formed instead, bring a stronger rebound to 142.50-60 but resistance at 143.20 should remain intact and bring another decline later.
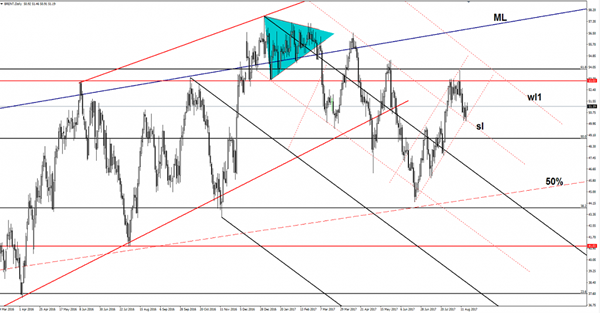
Our preferred count is that larger degree wave V with circle is unfolding from 251.12 with wave (I) 219.34, (II): 241.38 and wave (III) is subdivided into 1: 192.60, 2: 215.89 (23 Jul 2008) and wave 3 ended at 118.87 earlier in 2009. The correction from there to 162.60 is wave 4 which itself is a double three and is labeled as first a-b-c ended at 151.53, followed by wave x at 139.03, 2nd a ended at 162.60, 2nd b at 146.75 and 2nd c leg of wave 4 ended at 163.00. Therefore, the decline from 163.00 to 116.85 is now treated as wave 5 which also marked the end of larger degree wave (III), hence wave (IV) major correction has commenced for retracement of the wave (III) from 241.38 and upside target at 183.95-00 (50% Fibonacci retracement of the wave (II) from 241.38) had been met, a drop below 160.00 would suggest wave (IV) has ended at 195.85, bring decline in wave (V) for initial weakness to 130 (already met) and 120.
Washington’s House Of Cards Has Dollar On The Defense
Friday August 18: Five things the markets are talking about
Aside from the terrorist activities in Spain, the uncertain U.S political environment is keeping the 'mighty' dollar pinned down atop of its G7 overnight lows.
Global equity indices have extended their slide after terrorists struck in Barcelona yesterday, intensifying the market's unease initiated by growing concerns about dysfunction in U.S President Trump's administration and U.S policy paralysis.
All strong reason's why safe-haven bet trading is dominating the last session of the week.
1. Stocks see red on political woes
Yesterday, Wall Street's major indexes slumped between -1.2% and -1.9%. The S&P 500 index posted its biggest drop in three-months. This set the tone for the overnight session.
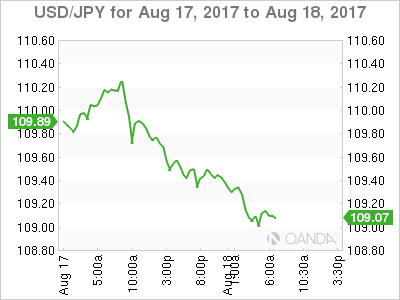
In Japan, equities hit a 3-1/2 month low on a stronger yen (¥108.98) and posted a fifth consecutive weekly drop. The Nikkei ended down -1.2%, its lowest close since May 2. For the week, it dropped -1.3%. Banks and financial shares underperformed, with the banking sub-index down -1.4% and the insurance sub-index losing -1.9%. The broader Topix declined -1.1%.
Down-under, Australia's S&P/500 Index ended -0.6% lower. In South Korea, the Kospi index ended -0.1% lower, while Hong Kong's Hang Seng Index fell -1.1%, while the China Enterprises Index lost -1.0%.
Note: Despite the losses, the Hang Seng index closed up +0.6% for the week thanks to support from companies reporting strong earnings.
In China, stocks were largely steady overnight, with investor optimism over strong corporate earnings and economic fundamentals offsetting pressure to book profits. The blue-chip CSI300 index closed out up +0.1%, while the Shanghai Composite Index was unchanged.
Note: The CSI300 gained +2.1% for the week and the Shanghai Composite rallied +1.9%, its best week in more than four-months.
In Europe, indices are trading sharply lower following on from the steep losses seen on Wall Street yesterday, with the French CAC and Spanish IBEX leading the declines. Yesterday's terror attack in Spain is weighing on sentiment with Travel and Leisure stocks while there are further sharp falls in some of Europe's major airlines.
U.S stocks are set to open in the red (-0.2%).
Indices: Stoxx600 -1.0% at 373.3, FTSE -1.1% at 7310, DAX -0.9% at 12093, CAC-40 -1.2% at 5083, IBEX-35 -1.2% at 10321, FTSE MIB -0.9% at 21601, SMI -1.0% at 8857, S&P 500 Futures -0.2%
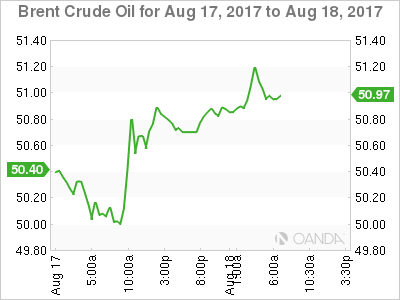
2. Oil steadies as high U.S output balances crude stock draw, gold higher
Ahead of the U.S open, oil prices trade somewhat steady after this week's U.S inventory data showed a big fall in crude stockpiles, but also an increase in production to its highest in more than two-years.
Global benchmark Brent is down -0.1% to +$50.99 a barrel, after jumping +1.5% yesterday on a drop in U.S stocks – it is on track for a -2.15% decline for the week. U.S light crude (WTI) is down -0.1% to +$47.05, surrendering some of Thursday's +0.7% gain and heading for a -3.6% weekly loss.
This week's EIA data showed commercial U.S crude stocks had fallen by almost -13% from their peaks in March to +466.5m barrels. Stocks are now lower than in 2016.
But U.S oil output is rising fast as shale producers take advantage of a recent increase in prices – production jumped by +79k bpd to over +9.5m bpd last week, its highest level in two-years.
Note: Rising U.S output continues to undermine efforts by OPEC and non-OPEC producers to drain a global fuel glut.
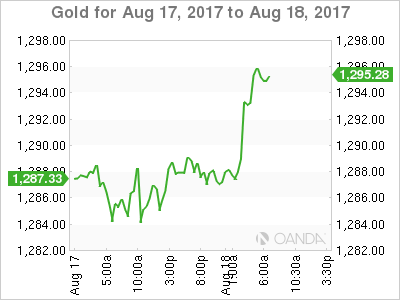
Spot gold is steady at +$1,286.85 an ounce, holding most of Thursday's +0.4% gain. It is set to end the week down -0.1%.
Elsewhere, industrial metals, which posted multi-year highs this week, is waning as investors take profit – copper futures are down -0.3% to +$6,468.50 a tonne, extending yesterday's -0.6% drop. Benchmark zinc set a new 10-year high of $3,147 a tonne yesterday.
3. Yields fall on terror worries
Geopolitical risk, protectionism and the unwinding of easy central bank money continues to support sovereign bond prices.
Investors seem content to flock into German and U.S Treasury bonds as the appeal of riskier assets flounders due to events in Spain and Washington.
Sovereign yields have fallen in recent days following the ECB comments and amid the dash for defensive assets – 10-year German Bunds are trading at a one-week low of +0.41% while U.S 10-year Treasuries trade just off their one-week lows hit yesterday at +2.19%.
Elsewhere, U.K's 10-year Gilt yield has fallen -1 bps to +1.075%.
4. Turmoil, Terror weighs on stocks and dollar
U.S political uncertainty is keeping the dollar pinned down atop of this weeks lows.
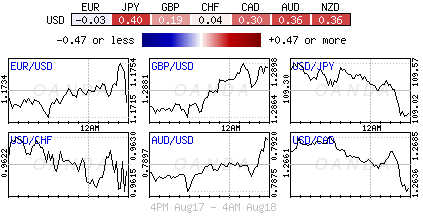
Overnight, the 'mighty' dollar is down more than -0.4% against the AUD (A$0.7921), NZD (NZ$0.7324) and off -0.2% against CHF ($0.9630) and the pound (£1.2907).
It's no surprise to see the yen (¥108.95) as the major mover among the G10 group of developed world currencies, gaining another +0.5% outright as nerves over stock market valuations and geopolitical concerns edge to the fore.
The EUR (€1.1742) had recovered all of the ground it lost after ECB policymakers warned of an “overshoot” in the currency in the minutes from last month's policy meeting.
Despite a recovery in the last fortnight, the dollar index is still just +1% above its 13-month lows hit at the start of this month.
5. Eurozone Current Account Surplus Shrank in June
Data this morning showed that the eurozone's current-account surplus narrowed in June.
The current-account balance stood at a surplus of +€21.2Bin June, following +€30.5B in May. In the 12-month period to June, the current-account surplus stood at +3.1% of GDP vs. +3.5% one year earlier.
Compared to the previous month, the surplus in goods increased from +€26.6B to +€27.4B. The surplus in services declined to +€2.2B from +€2.7B.
The surplus in primary income fell to +€4.6B from +€11.3B, while the deficit in secondary income expanded to +€13B from +€10.1B.
Brent Oil Eyeing New Highs
The Brent Oil increased significantly since yesterday and seems poised for a further increase in the upcoming period. Is trading above the $51.20 per barrel and could approach the 53.03 static resistance if the USD/CAD will slide further. A throwback was expected after the US Crude Oil Levels amazing drop, the indicator was reported at -8.9 million barrels in the previous week, much lower versus the -3.0M estimate. Only a breakdown from the minor ascending channel will signal a further drop.
NZD/USD Poised For More Gains
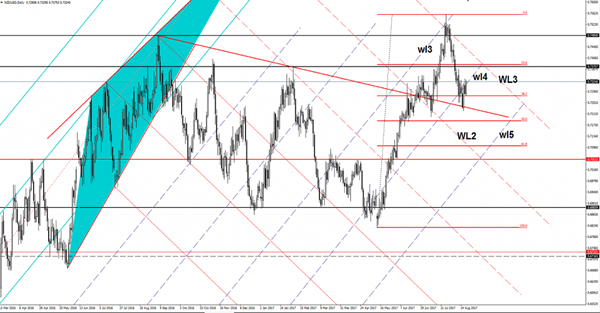
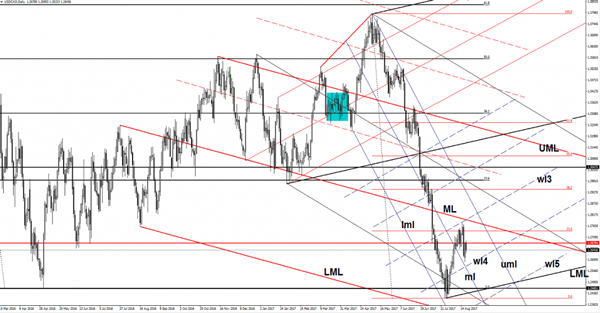
Price rallied after the retest of the 38.2% retracement level and now is trying to take out the dynamic resistance from the fourth warning line (wl4). Will climb much higher if will stabilize above the warning line, but I want to remind you that failure will signal a major drop. Has found strong support at the red downtrend line and now is fighting hard to recover. We had a false breakdown below the 38.2% retracement level, meaning that an increase towards the 23.6% is favored. Technically, is expected to retest also the third warning line (WL3) before will make the next significant move.
USD/CAD Rejected By Static Resistance
USD/CAD slips lower on the daily chart as the bears have taken control again. Price drops as the dollar index failed to close above the 93.81 horizontal resistance, signaling that another drop is favored on the short term. Technically the USD/CAD is expected to decrease further on the short term, but we'll see what the fundamental events will bring.
Canada is to release the inflation figures, the CPI may increase by 0.0% in the previous month versus a 0.1% drop in June. The Core CPI will be published as well, but remains to see if will stay in the positive area for the sixth consecutive month. The Common CPI, Median CPI and the Trimmed CPI will be released as well in the afternoon. You can keep an eye on the economic calendar to see what will move the rate.
USD/CAD falls after the 1.2678 retest and could approach the fourth warning line (wl4) of the former minor ascending pitchfork. Is expected to reach and retest this dynamic support after the failure to retest the wl3 and more important the median line (ML) of the major descending pitchfork. Is still under a lot of pressure as long as is trading within the descending pitchfork's body and much below the median line (ML) of the major descending pitchfork.
A retest of the wl4 followed by a minor increase will signal a bullish momentum, which could ignore the mentioned resistance levels, only a drop below it will validate a further drop.
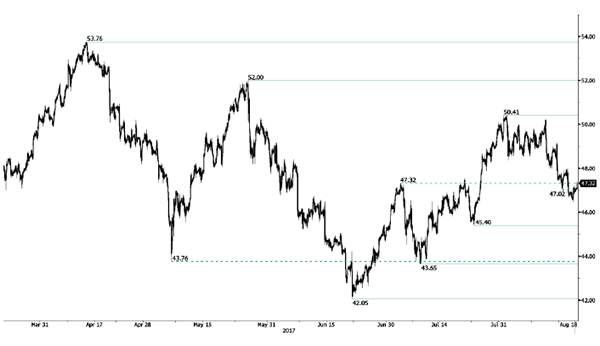
CRUDE OIL Wide-Open For Further Weakness
Crude oil is trading lower. Hourly support is given at a distance at 45.40 (24/07/2017 low). Strong resistance can be found at 50.41 (31/07/2017). Expected to show short-term weakness.
In the long-term, crude oil has recovered after its sharp decline last year. However, we consider that further weakness are very likely. Strong support lies at 35.24 (05/04/2016) while resistance can now be found at 55.24 (03/01/2017 high).