Sample Category Title
GBP/USD Consolidating Within Short-Term Bearish Pressures
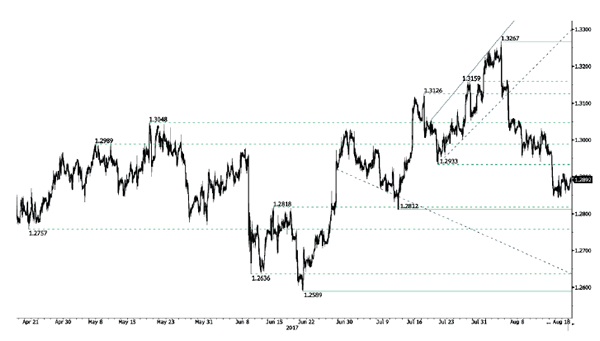
GBP/USD is edging higher. Hourly resistance is given at 1.3267 (03/08/2017 high). Hourly support can be found at 1.2812 (12/07/2017 low). Expected to show continued bearish pressures.
The long-term technical pattern is even more negative since the Brexit vote has paved the way for further decline. Long-term support given at 1.0520 (01/03/85) represents a decent target. Long-term resistance is given at 1.5018 (24/06/2015) and would indicate a long-term reversal in the negative trend. Yet, it is very unlikely at the moment.c
EUR/USD Short-Term Weakness
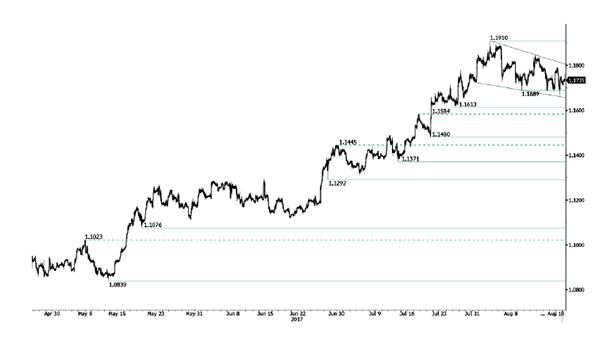
EUR/USD bearish pressures are on. Hourly resistance can be found at 1.1910 (02/08/2017 high) while hourly support given at 1.1689 (09/08/2017 high) has been broken. Stronger support lies at 1.1613 (26/07/2017 low). Expected to show further short-term selling pressures.
In the longer term, the momentum is now turning largely positive. We favour a continued bullish bias. Key resistance holding at 1.1871 (24/08/2015 high) has been broken while strong support lies at 1.0341 (03/01/2017 low).
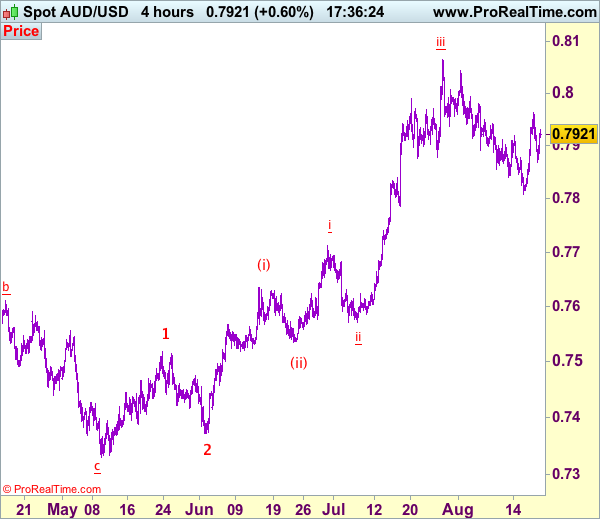
Trade Idea: AUD/USD – Hold long entered at 0.7895
AUD/USD – 0.7920
Recent wave: Wave 5 ended at 1.1081 and major correction has commenced for fall to 0.7000 and then towards 0.6500-10
Trend: Near term up
Original strategy :
Bought at 0.7895, Target: 0.8050, Stop: 0.7835
Position: - Long at 0.7895
Target: - 0.8050
Stop: - 0.7835
New strategy :
Hold long entered at 0.7895, Target: 0.8050, Stop: 0.7865
Position: - Long at 0.7895
Target: - 0.8050
Stop:- 0.7835
Although aussie retreated after meeting resistance at 0.7963 yesterday, as the pair found support at 0.7869 and has rebounded, retaining our bullishness and consolidation with upside bias remains for another test of said resistance at 0.7963, break there would add credence to our view that low has possibly been formed at 0.7808, bring a stronger rebound to 0.8000, however, break there is needed to signal the pullback from 0.8066 top (wave iii peak) has ended at 0.7808 (wave iv) and bring eventual retest of this level.
In view of this, we are holding on to our long position entered at 0.7895. Below said support at 0.7869 would dampen this bullish scenario and suggest the rebound from 0.9808 has ended, bring another test of this level, below there would signal the wave iv correction from 0.8066 is still in progress for weakness to 0.7786 support, however, oversold condition should prevent sharp fall below 0.7750 and price should stay above i top at 0.7712, bring rebound later. We are keeping our latest bullish count that recent impulsive waves is unfolding as (1 2, (i)(ii), i ii) and may extend headway towards 0.8150.
On the 4-hour chart, the move from 0.8066 is the wave 5 with i: 0.8860, ii: 0.8315, wave iii is an extended move ended at 1.0183, iv: 0.9706 and wave v has ended at 1.1081 (also the top of entire wave 5). The subsequent selloff is the major correction which is unfolding as ABC-X-ABC and 2nd A leg has ended at 0.8848, followed by a-b-c wave B which ended at 0.9758, hence, 2nd C wave is now in progress and indicated downside target at 0.7000 and 0.6950 had been met, so further fall to 0.6710-20 cannot be ruled out.
STOXX 50 Vs S&P500
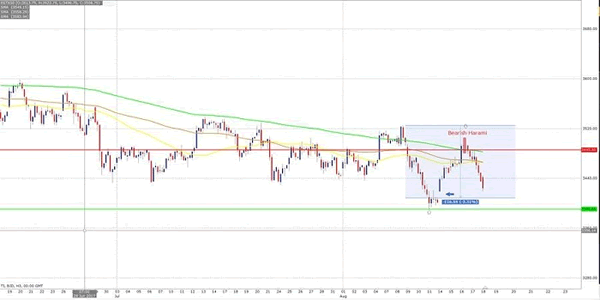
Stoxx 50 Closing the gap
S&P500 Felling the Pain
Stoxx 50 Closing the gap
The bearish Harami candle played out perfectly and pushed the price lower
More bearish strength as the price is trading below the 50, 100, 200 DMA
The price could find support at the weekend gap (11th August)
If the trend reverse, it is more likely that we are going to find the moving averages creating threat for that upside move because of the rapid sell off we had.
The support is at 3390 and the resistance is at 3525.
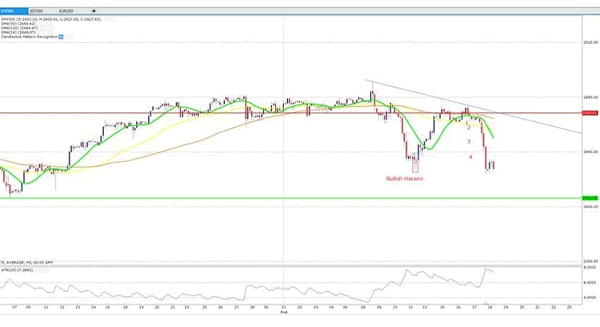
S&P500 Felling the Pain
The bullish Harami candle pushed the price higher initially and the double top pushed the price lower.
More bearish strength as the price is trading below the 50, 100, 200 DMA.
The ATR of 7.8 calls for caution.
The support is at 2406 and the resistance is at 2468
Daily Technical Analysis: EURUSD, GBPUSD, USDJPY, USDCHF
EURUSD
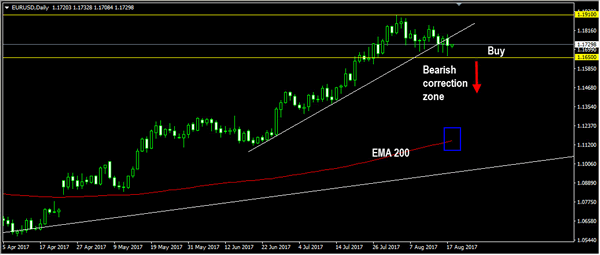
The EURUSD attempted to push lower yesterday but still unable to break below 1.1650 key support and closed higher at 1.1724. The bias is neutral in nearest term. Immediate support is seen around 1.1700. A clear break below that area could trigger further bearish pressure testing 1.1650 key support which is a good place to buy with a tight stop loss. Immediate resistance is seen around 1.1780 followed by 1.1850. Overall I remain bullish and price is still moving above the daily EMA 200 as you can see on my daily chart below but a clear break and daily/weekly close below 1.1650 would activate my neutral mode as deeper correction may take place next week. On the upside, we need a clear break and daily/weekly close at least above 1.1800 to potentially end the bearish correction phase targeting 1.1910 – 1.2000 region.
GBPUSD
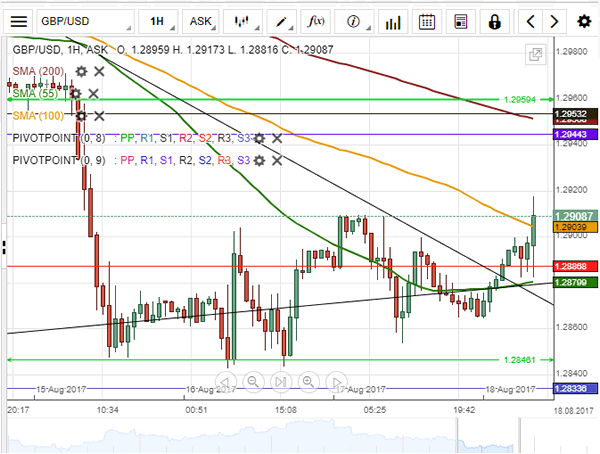
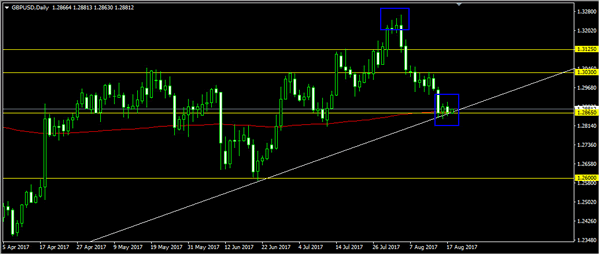
The GBPUSD didn’t make significant movement yesterday. The bias is neutral in nearest term. Price is still trending lower in short term but still unable to break below the trend line support and 1.2865 key support area as you can see on my daily chart below, which remains a good place to buy with a tight stop loss as a clear break and daily/weekly close below the trend line support would expose 1.2600 region next week. Immediate resistance is seen around 1.2908 (yesterday’s high). A clear break above that area could trigger further bullish pressure testing 1.2950 or higher. Overall I remain neutral.
USDJPY
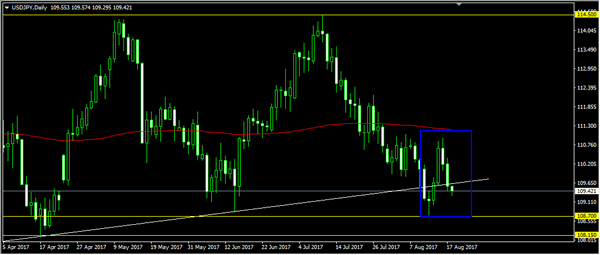
The USDJPY failed to continue its bullish momentum yesterday, bottomed at 110.03 and hit 109.66 earlier today in Asian session. The bias is bearish in nearest term. Price revisits the trend line support (109.50) as you can see on my daily chart below, which is a good place to buy with a tight stop loss as a clear break below 109.50/00 could trigger further bearish pressure testing 108.15 area. Immediate resistance is seen around 110.21 (current high). A clear break above that area could lead price to neutral zone in nearest term testing 110.80 or higher. Overall I remain neutral.
USDCHF
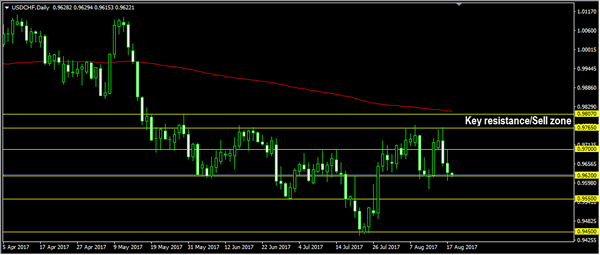
The USDCHF was indecisive yesterday. The bias is neutral in nearest term probably with a little bearish bias testing 0.9550 support area. Immediate resistance is seen around 0.9700 but key resistance remains at 0.9765 – 0.9807 which remains a good place to sell with a tight stop loss as a clear break above 0.9807 would activate my bullish mode. On the downside, a clear break and daily/weekly close below 0.9550 would expose 0.9450 key support area next week.
USD Tumbles Again Amid Concerns Over Fiscal Reform
During the European afternoon Thursday, the dollar gave back some of the gains it posted earlier in the day (particularly vs JPY), while US equities declined amid renewed concerns regarding President Trump's ability to implement his administration's fiscal agenda. Stocks and the USD tumbled after rumors that the White House Economic Council Director, Gary Cohn, was going to resign. Cohn is an influential member of the administration, and has been widely touted as the top candidate to replace Janet Yellen as Fed Chair once her term ends in early 2018. Coming on top of the recent resignations of key White House figures, the mere suggestion that he might depart as well was probably enough to heighten concerns among investors. Even though the White House quickly denied the rumors, neither equities nor the USD managed to recover all of their Cohn-related losses.
A few hours later, reports suggested that the White House will not move forward with its planned Advisory Council on infrastructure, which was expected to advise Trump regarding infrastructure projects. Considering that in the past few days the President disbanded two other advisory bodies, this development may have been seen as lowering even further the likelihood of successful fiscal reform. Moving forward, we think that the near-term outlook for the greenback remains bleak. The continued uncertainty on the political front continues to weigh on the currency, while there are no major data releases or events on the US economic calendar next week to support the dollar. Even though it has been announced that Chair Yellen will speak at the Jackson Hole symposium, given that her speech will center on financial stability, any remarks that impact USD appear unlikely.
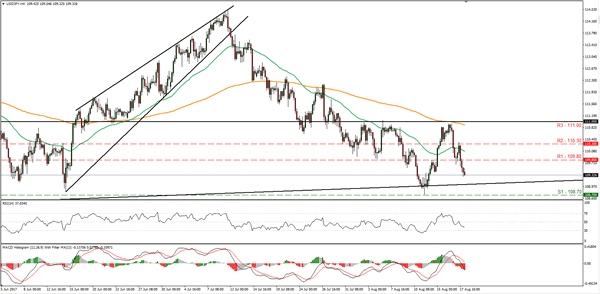
USD/JPY traded somewhat higher during the European morning Thursday, hit resistance near the 110.30 (R2) hurdle and subsequently it plunged to break below the support (now-turned-into-resistance) barrier of 109.80 (R1). At the time of writing, the rate seems to be headed for a test near the crossroads of the 108.70 (S1) territory and the upside support line taken from the low of the 17th of April. If the bears prove strong enough to break below that crossroads, that would confirm a forthcoming lower low on the 4-hour chart and it could set the stage for further declines, perhaps towards the 108.10 (S2) area, also marked by the low of the 17th of April.
ECB minutes express concerns about future EUR appreciation
The minutes of the ECB's July policy meeting revealed concerns regarding the risk of exchange rate overshooting in the future. Even though officials noted that the recent EUR appreciation could be seen as reflecting changes in the fundamentals of the Eurozone, an exchange rate overshoot in the future would still be concerning. In other words, the Governing Council can tolerate the euro's recent strength, but would be worried if it were to continue gaining. Even though the euro is trading somewhat higher than it was back then, in our view this suggests that the likelihood of the ECB talking down the currency is relatively low, unless it resumes its uptrend.
As for today's highlights:
Today, Canada's CPI data for July will be in focus. The consensus is for the headline rate to have risen somewhat, something supported by the rebound in the yearly change of oil prices, while no forecast is available for the core print. A potential rebound in headline inflation could confirm the BoC's view that inflation is likely to pick up again soon despite the recent slowdown and thereby, heighten even further market expectations regarding another rate hike this year. Even though something like that could support the Loonie somewhat, we think that market focus may be primarily on any movement in the core rate, as that could play an even bigger role in determining the timing of the next BoC rate increase.
USD/CAD traded higher yesterday, after it hit support near the 1.2600 (S1) level and the upside support line taken from the low of the 28th of July. The price structure on the 4-hour chart suggests a short-term uptrend above the aforementioned line, but given that Canada's headline inflation rate is expected to rebound today, we would stay mindful of a potential pullback in the pair. A rebound in inflation could encourage the bears to pull the trigger for another test near 1.2600 (S1) area, and if they manage to overcome it, we may see further declines towards 1.2550 (S2). Zooming out to the daily chart, even though the short-term bias of the pair appears to be positive at the moment, as long as the rate remains below the psychological zone of 1.3000, we consider the broader outlook to be cautiously negative.
From the US, we get the preliminary U of M consumer sentiment index for August.
USD/JPY
Support: 108.70 (S1), 108.10 (S2), 107.00 (S3)
Resistance: 109.80 (R1), 110.30 (R2), 111.00 (R3)
USD/CAD
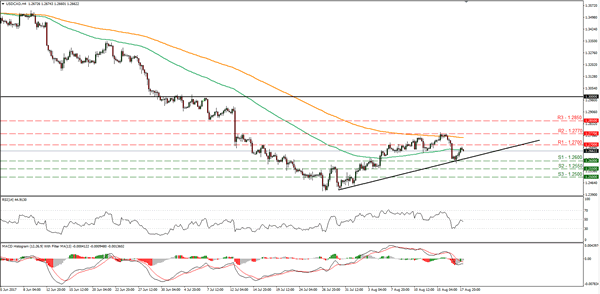
Support: 1.2600 (S1), 1.2550 (S2), 1.2500 (S3)
Resistance: 1.2700 (R1), 1.2770 (R2), 1.2850 (R3)
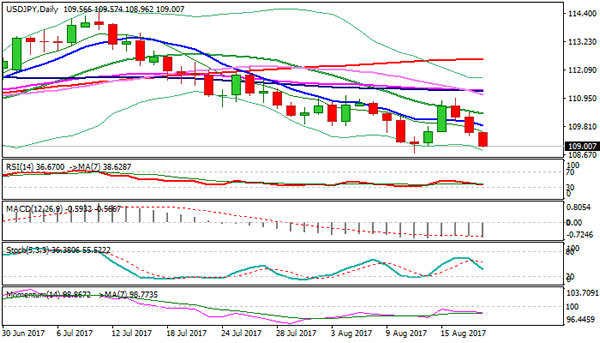
Technical Outlook: USDJPY Heads Towards Key Support At 108.72 On Fresh Risk-Off Mode
The pair remains firmly in red and extends below 109.00 handle on fresh risk-off mode. Steady descend from repeated rejection near key 111.00 barrier eyes key supports at 108.83/72 (weekly cloud base /11 Aug low), break of which would open next key support at 108.11 (14 Apr low) and spark stronger descend on break here, in extension of fall from double-top at 111.00 zone that was formed on daily chart. Bearish continuation of larger downtrend from 118.66 could extend to 106.50 (Fibo 61.8% of 98.99/118.66 (Jun-Dec 2016 rally) on firm break below 108.11 pivot. Session high at 109.57 marks initial resistance, followed by falling 10 SMA at 109.84.
Res: 109.57, 109.84, 110.00, 110.32
Sup: 108.72, 108.11, 107.88, 107.35
Markets End The Week On The Back Foot
Risk-off move accelerates ahead of the weekend
Financial markets are set to end the week on the back foot as US political turmoil takes centre stage with many of Trump’s business counsellors resigning. Wall Street suffered its worst sell-off since May with the Dow Jones Industrial Average falling 1.24% to 21,750 points. The S&P 500 was down 1.54%, while the tech-heavy Nasdaq tumbled 1.94%. The sell-off spreads to European stocks on Friday after a terrorists attack in the streets of Barcelona. The Eurostoxx 50 gave up 0.90%, the Dax was down 0.75%, while the CAC 40 slid 1%.
Against this backdrop, investors have switched to risk-off mode, sending equity indices through the floor and piling into safe haven assets. The yellow metal reversed early week losses and returned to $1,290 an ounce, rising more than 2% since Tuesday. The broad debasement of risky assets sees a strengthening of demand for Treasuries. 10-year German Bund yields dipped to 0.40%, while the 2-year slid to -0.71% amid rising bonds’ price.
In the FX market, the yields hungry investors piled into higher yielding currencies such as the Aussie and the Kiwie. AUD/USD rose 0.45% to 0.7920 while NZD/USD was up 0.50% to 0.7315. The single currency was also edging higher - despite the risk-off move - treading water at around 1.1735. The Japanese yen was up 0.40% with USD/JPY trading at around 109.15.
Overall, today’s risk-off move is amplified by the fact that investors are always reluctant to hold risky position over the week-end. Indeed Trump’s political mess creates a substantial risk for markets overreacting on Monday should the situation worsens when markets are closed.
Japan: strong upside pressures on the yen
The Japanese yen is on a clear bullish momentum. The currency has outperformed major G-10 currencies since last month. In particular, the USDJPY has weakened from 114 in a month. The rally may now seem a bit over extended and we may see some rebound within the short-term. Anyway the pair is riding a downtrend channel and there are definitely some more room for further weakness.
Japanese bond yield keeps on declining. The 10-year bond is back is heading back towards 0. The current rate is the lowest since last October. This indicates that the demand for inflation-linked bonds are actually very low. Markets are then estimating than inflation should remain low over the next decade!
This is a clear pessimistic view and the deflationary environment. The strengthening yen should also weigh on consumer prices. Japan vicious circle is set to continue. And we remember that a month early the BoJ has downgraded its inflation forecast for fiscal years 17/18 and 18/19. The central bank inflation target seems a difficult objective and upside risks on the currency should very likely continue, especially against the greenback with Trump failing to deliver his reforms.
EUR/USD Analysis: Breaks Pattern
The common European currency for the first time during the week did not follow in accordance with the forecast against the US Dollar on Thursday. As a result the short term situation was reviewed.
During the last 24 hours the pair declined to once more reconfirm the lower trend line of the medium term descending channel pattern. Moreover, it reached the long term target of 1.1670. Afterwards, the pair rebounded and began and surged above the weekly S1 at 1.1725.
It is most likely that the pair will continue to surge on Friday until it reaches the various resistance levels near the 1.1750 mark.
GBP/USD Analysis: Bounced Off Long Term Support
A review of the situation on the GBP/USD pair has been done. As a result of that, various new pieces of information have been discovered.
First of all, the recent decline of the pair was occuring in a medium term channel pattern, which guided the pair in its fall after encountering a dominant pattern's resistance.
However, on Friday it was revealed that there was another channel, whose support line has kept the rate from falling during this week. Moreover, a rebound has occured against the line. Due to that reason the rate should continue the surge. Although, on Friday it still has to pass the 100-hour SMA at 1.29.