Sample Category Title
USD/JPY Analysis: Approaches Support Below 1.09 Mark
Due to the previous forecasts failing, a review of the USD/JPY pair has been conducted. It was revealed that the pair remains on a large scale in a descending channel.
However, the recent surge of the US Dollar against the Yen occurred due to encountering a support of a long term channel up pattern. It was followed by a rebound, which can be observed on the chart. Although, it has ended and a short term decline has started in a presumed descending channel pattern.
In regards to Friday's trading , it can be expected that the rate will reach the monthly S1 and the support of the long term channel at 108.82.

XAU/USD Analysis: Moves Exactly As Expected
The yellow metal's price movements in the past trading session have become increasingly easy to forecast. Moreover, the future also seems clear.
First of all, the bullion has revealed the medium term ascending channel's borders, which help to predict when the metal will reach above the 1,300 mark. Secondly, the commodity price has reached above the 1,290 mark and touched the 1,295 level on Friday.
In the near future it can be expected that the metal's price will surge above the 1,300 mark. However, that can be hindered, if the new weekly pivot points on Monday obstruct the surge.
GBP/USD: Retail Sales M/M
The Sterling gained 14 base points against the US Dollar, as the UK Retail Sales report showed slightly better-than-expected data. The GBP/USD currency pair rose 0.11% to be seen trading near the 1.2901 mark just for a while and then retreated to the previous level. However, on Friday morning the Pound was strong enough to repeat the post-release gains.
The Office for National Statistics revealed that Britain's retail sales surged 0.3% month-over-month in July, above expectations for a 0.2% rise, though the figure was weaker than a 0.6% registered in June. Higher food sales managed to offset a decrease in spending on other goods. Moreover, the UK retail sales are expected to show modest expansion this year, if real wage growth keeps falling behind inflation.
EUR/USD: Unemployment Claims
The weekly report on the US unemployment claims provided temporary support for the US dollar during the Thursday's session. The Greenback rose against the Euro by 10 base points to reach the 1.1687 mark. However, the Euro was capable of maintaining strong position until Friday's morning to continue trading above the 1.1735 level.
The Labour Department revealed that the number of Americans filing for unemployment benefits fell to the lowest level in six months last week. The report showed the initial jobless claims dropped to 232K in the week ended August 12, down from the prior week's 244K. Data provided a good sign for the Federal Reserve as the further tightening in the labour market could encourage the US economic growth.
Technical Outlook: GBPUSD Remains Within Narrow Consolidation Supported By Daily Cloud
Cable remains above daily cloud which proves to be very strong support, following several penetrations into cloud but failing to close below cloud top. The price action remains within narrow consolidation for the third consecutive day, with downside being held by daily cloud rising 100SMA, but upside attempts were limited at 1.2900 zone. Overall negative technical studies keep bias at the downside, but bearish continuation requires firm break below1.2848 (Fibo 61.8% of 1.2588/1.3268 rally) and daily cloud (spanned between 1.2863 and 1.2851) for confirmation. On the other side, bullish signal comes from slow stochastic emerging from oversold territory after forming bullish divergence pattern, which could support for further upside. Bullish scenario requires break above 55SMA (1.2929) and falling daily Tenkan-sen (1.2947) for confirmation.
Res: 1.2908, 1.2929, 1.2947, 1.2970
Sup: 1.2863, 1.2848, 1.2811, 1.2749
Forex Technical Analysis: EUR/USD, USD/JPY, GBP/USD
EUR/USD
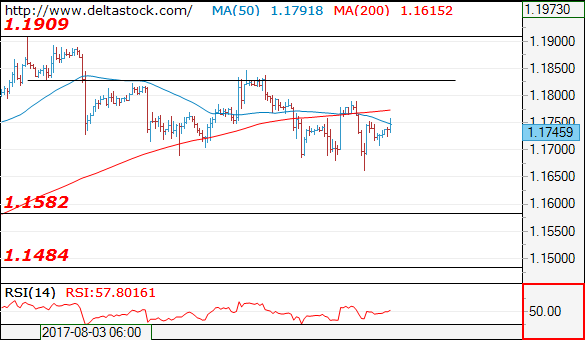
Current level - 1.1745
The overall outlook is still bearish, for a slide towards 1.1580, en route to 1.1480 zone. Initial minor resistance lies at 1..1780, followed by the crucial on the higher frame 1.1850.
| Resistance | Support | ||
| intraday | intraweek | intraday | intraweek |
| 1.1780 | 1.1909 | 1.1660 | 1.1580 |
| 1.1850 | 1.2000 | 1.1580 | 1.1480 |
USD/JPY
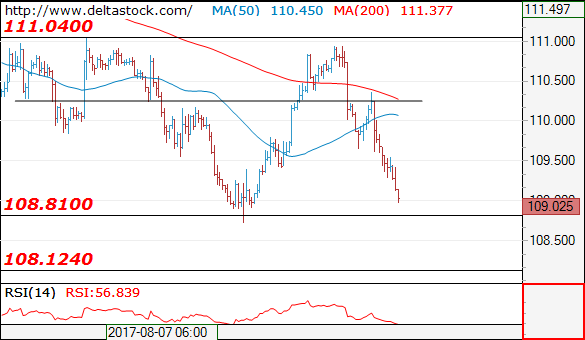
Current level - 109.02
My outlook here is counter-trend, for a reversal above 108.80, towards 111.00 hurdle. Crucial on the downside is 108.70 low.
| Resistance | Support | ||
| intraday | intraweek | intraday | intraweek |
| 109.60 | 111.00 | 108.80 | 108.10 |
| 110.30 | 112.20 | 108.10 | 107.00 |
GBP/USD
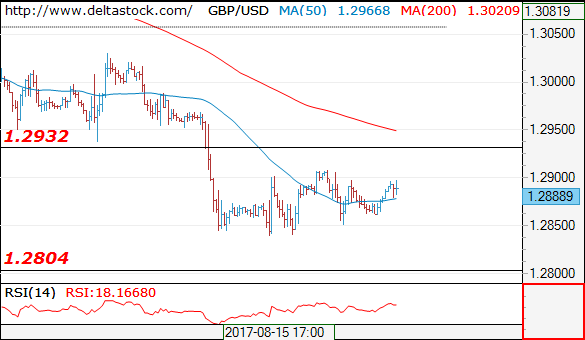
Current level - 1.2888
Despite the risk of one more brief rise to 1.2930 resistance, the overall outlook remains bearish, for a tight test of 1.2800 area.
| Resistance | Support | ||
| intraday | intraweek | intraday | intraweek |
| 1.2930 | 1.3260 | 1.2804 | 1.2804 |
| 1.3050 | 1.3500 | 1.2705 | 1.2480 |
Technical Outlook: Spot Gold Breaks Above $1292 Barrier On Fresh Safe-Haven Demand
Spot Gold rallied further in early Friday’s trading as demand for safe haven assets was boosted after terrorist attack in Spain.
Gold extended strong rally of past two days and broke above previous high of 11 Aug at $1292, looking for key med-term barriers t at $1296 (06 June / 14 Apr peaks).
Sustained break here is needed to signal an end of multi-month congestion between $1296 and $1204 and continuation of larger uptrend from $1122 (15 Dec 2016 low).
Technical studies are full bullish setup and favor further advance towards psychological $1300 barrier (also the upper boundary of bull-channel from $1204) and $1315 (Fibo 76.4% of $1375/$1122 descend) in extension.
However, hesitation ahead of $1296 barriers cannot be ruled out, with consolidation phase expected before final push higher.
Session low at $1285 marks initial support, with Thursday’s low at $1282 and 4-hr cloud top at $1278 to contain extended dips.
Res: 1296, 1300, 1315, 1328
Sup: 1292, 1285, 1282, 1278
Technical Outlook: Dow Is Consolidating Thursday’s Sharp Fall, Near-Term Bias Remains With Bears
Dow Jones contract for September delivery is trading with narrow consolidation on Friday after strong fall the previous day, when the index was down 1.3% in the biggest one-day fall since 17 May.
Strong sell off on Thursday signals that investors are strongly concerned about President Trump's administration ability to move forward with its economic agenda.
Technical outlook for Dow is weaker after the second strong fall in past two weeks, as the second leg of pullback from new record high at 22131 has completed failure swing pattern on daily chart, signaling further easing.
Thursday's long bearish daily candle weighs heavily, along with rising bearish momentum and Thursday's close below pivotal support at 21752 (Fibo 38.2% of 21138/22131 upleg.
Oversold near-term studies suggest further consolidation, with broken 20SMA (21856) expected to ideally cap and extended upticks to be limited by daily Tenkan-sen at 21911.
Fresh extension of bear-phase from 22131 through yesterday's low at 21690, would look for targets at 21635/21517 (Fibo 50% / 61.8% of 21138/22131) and may stretch towards top of rising and thickening daily cloud at 21404.
Conversely, sustained break above daily Tenkan-sen 21911 would ease bearish pressure, while bounce above lower top at 22066 is needed to confirm an end of corrective phase and turn focus higher.
Res: 21774; 21856; 21911; 22066
Sup: 21690; 21635; 21517; 21404
Technical Outlook: EURUSD Needs Break Out Of 1.1680/1.1800 Range For Clearer Direction Signal
Thursday's close below 20SMA and formation of bearish engulfing pattern maintain downside risk.
Strong rejections at both sides yesterday (near 1.1800 at the upside and 1.1680 at the downside) signal indecision, but repeated long-tailed candles in past few days suggest support at 1.1680 zone is very strong and the pair may struggle to break it.
Mixed signals on daily chart with slow stochastic and RSI in neutrality zone and sideways mode.
Stronger bearish signal is developing on weekly chart where RSI and slow stochastic are reversing from overbought zone and signal correction, with the pair being on track for bearish weekly close (the first after five straight weeks in green).
Initial support at 1.1680 (where repeated downside attempts were rejected) is reinforced by rising 30SMA and sustained break here is needed to spark fresh downside.
Otherwise, extended directionless mode could be expected while 1.1680 support holds and the price stays capped below1.1800 pivot.
Converged 10/20SMA's mark initial resistance at 1.1764.
Res: 1.1764, 1.1789, 1.1846, 1.1889
Sup: 1.1708, 1.1674, 1.1662, 1.1650
EURGBP Still Bullish Near 10-Month Highs But Running Out Of Steam?
EURGBP is still looking overbought according to many technical indicators despite yesterday's losses. The pair is currently being supported by the middle line of the linear regression channel and has avoided closing below the line during every spike downwards in the past two weeks.
The RSI is flat at the 70 overbought level, and although the stochastics are trending down, it is so far a shallow slope similar to the previous downside reversal which saw the %K and %D lines fall only slightly below the 80 overbought level. A second consecutive day of losses could strengthen the negative intra-day momentum, leading to a sharper correction.
However, the pair would first have to breach the support levels of the 0.91 handle and the middle regression line at around 0.9080, which is not too far from the 161.8% Fibonacci retracement level of 0.9075. Further down, the 100% Fibonacci level of 0.8950 of the downleg from 0.8948 to 0.8742 could act as additional support before the 50-day moving average (MA) comes into scope. A drop below the 50-day MA (currently around 0.89) would turn the near-term bias to negative from the current bullish one.
To the upside, this week's 10-month high of 0.9142 is a major resistance point that was tested twice on Wednesday. Failure to break above this peak in the coming days could significantly weaken the positive bias, but a successful challenge of it would reinforce the current uptrend. If broken, the next resistance could come from the October 2016 top of 0.9260, followed by the 261.8% Fibonacci level of 0.9280.
In the medium-term, the bullish structure is unlikely to shift anytime soon with price action firmly above the upward trending 50- and 200-day MAs.