Sample Category Title

Is The RBA Comfortable With A Stronger AUD?

During the Asian day Tuesday, the RBA will announce its policy decision and the forecast is for the Bank to keep rates unchanged once again. July has been anything but boring for AUD traders. The fuss began after the minutes of the latest meeting showed a discussion regarding the level of the neutral policy rate in Australia, which was enough to raise speculation that the Bank may be preparing for a lift-off soon. However, a few days later, both Governor Lowe and Deputy Governor Debelle poured cold water on such expectations, signaling that markets shouldn't read too much into that conversation. Lowe made it clear that the Bank is likely to stay on hold for a while.

Having said that, we think that this meeting will still be closely watched for any updated signals on policy, and in particular, whether the Bank is comfortable with the latest rise in Australian yields as well as AUD appreciation. Indeed, both Lowe and Debelle noted that a lower Aussie would be desirable, implying there is a risk that the statement communicates a greater-than-previous discomfort about the recent surge in AUD. In such a case, the Aussie could correct lower.

AUD/USD traded in a consolidative manner on Friday, staying between the support of 0.7950 (S1) and the round figure of 0.8000 (R1). On Thursday, the pair slid back within the sideways range between 0.7900 (S1) and 0.8000 (R1) and thus, we consider the short-term outlook to have turned back to neutral. That said, if the RBA appears more concerned than previously with regards to Aussie's appreciation, we may see the pair sliding below 0.7950 (S1), and challenging the lower bound of the aforementioned range, at 0.7900 (S2). A clear dip below 0.7900 (S2) could set the stage for extensions towards our next support of 0.7840 (S3).

As for the bigger picture, as long as AUD/USD is trading above 0.7800, which acted as the upper bound of a wide range that had been containing the price action since the beginnings of March 2016, we still see a positive longer-term outlook. We would treat any possible retreat that stays limited above 0.7800 as a corrective phase.

Today's highlights:

Eurozone's preliminary CPIs for July will be in focus. The forecast is for the headline rate to have held steady, while the core rate is expected to have ticked down. We view the risks surrounding both forecasts as skewed to the upside. The July 2016 monthly CPI prints, which will be dropping out of the yearly calculation now, were -0.6% mom and -0.7% mom respectively. Therefore, even in case we get soft monthly prints today, as long as they are better than the dreadful prints of July 2016, they could still drag the yearly rates higher. What's more, the yearly change in oil prices turned positive in July, which further supports the case for an upside surprise in the headline rate. In case of better-than-expected CPIs, the euro could come under renewed buying interest. We also get the bloc's unemployment rate for June.

EUR/USD traded higher on Friday, broke back above 1.1710 (S1), but hit again resistance at 1.1775 (R1) before retreating somewhat. The rate continues to trade above the uptrend line drawn from the low of the 22nd of June and as a result, we consider the near-term picture to still be positive. Even if the pair retreats a bit more today, we think such a correction could encourage the bulls to take the reins again and shoot for another test at 1.1775 (R1). The catalyst for such an advance may be accelerating Eurozone CPIs today. A clear break above 1.1775 (R1) is possible to open the way for our next resistance of 1.1880.

In the US, the Chicago PMI and the Dallas Fed manufacturing activity index, both for July, are due out. We also get the nation's pending home sales for June.

As for the rest of the week:

On Tuesday, besides the RBA decision, we get a raft of economic data from the US: the core PCE price index for June, personal income and spending data also for the same month, as well as the ISM manufacturing PMI for July. In the UK, the manufacturing PMI for July will be in focus. On Wednesday, New Zealand's employment data for Q2 and the US ADP employment report for July are to be released. Thursday is 'Super Thursday” in the UK, meaning that besides the BoE rate decision and the meeting minutes, we also get the quarterly Inflation Report. Finally on Friday, the US employment report for July will take center stage and expectations are for another solid report overall. We also get Canada's employment data for the same month.

EUR/USD

Support: 1.1710 (S1), 1.1615 (S2), 1.1585 (S3)

Resistance: 1.1775 (R1), 1.1880 (R2), 1.1980 (R3)

AUD/USD

Support: 0.7950 (S1), 0.7900 (S2), 0.7840 (S3)

Resistance: 0.8000 (R1), 0.8070 (R2), 0.8160 (R3)

USD/CAD Daily Outlook

Daily Pivots: (S1) 1.2378; (P) 1.2473; (R1) 1.2527; More....

Intraday bias in USD/CAD remains neutral for the moment. On the upside, above 1.2575 will extend the rebound from 1.2412 and target 38.2% retracement of 1.3346 to 1.2412 at 1.2769 first. On the downside, break of 1.2412 will extend recent fall from 1.3793 to next key fibonacci level at 1.2048.

In the bigger picture, price actions from 1.4689 medium term top are seen as a correction pattern. Fall from 1.3793 is seen as the third leg and should target 50% retracement of 0.9406 to 1.4869 at 1.2048. At this point, we'd look for strong support from there to contain downside and bring rebound. However, firm break there will target 100% projection of 1.4689 to 1.2460 from 1.3793 at 1.1564.

USD/CAD 4 Hours Chart

USD/CAD Daily Chart

Technical Outlook: EURUSD – Bulls May Take A Breather On Overbought Studies But Bias Remains Bullish

The Euro holds firm and consolidating under fresh high t 1.1779 (the highest since Jan 2015 and near the upper boundary of bull-channel) in early Monday's trading.

Strong bullish signal has been generated on weekly close above pivotal barrier at 1.1735 (Fibo 38.2% of 1.3992/1.0340 descend), as the pair ended the third consecutive week positively and is on track for the fifth straight bullish month on steep recovery rally from 1.0500 zone higher base.

The rally approached another strong barrier at 1.1786 (weekly 200SMA), break of which is needed to confirm bullish continuation.

The pair is currently riding on the third wave of five-wave cycle from 1.0820) which could extend to its Fibo expansion levels at 1.1877 (FE 161.8%) and 1.1945 (FE 176.4%), on the way towards target at psychological 1.2000 barrier, also monthly Ichimoku cloud base.

Meantime, corrective pullback on overbought studies is seen as likely near-term scenario. Daily RSI and slow stochastic emerged from overbought territory and support the notion.

Rising 10SMA offers support at 1.1653, followed by daily Tenkan-sen/4-hr cloud base at 1.1630, where dips should find footstep. Extended pullback should be contained at 1.1530 zone (Fibo 38.2% of 1.1188/1.1776, reinforced by rising 20SMA) to keep bulls intact.

Res: 1.1776, 1.1800, 1.1877, 1.1945
Sup: 1.1700, 1.1653, 1.1630, 1.1612

EUR/USD Daily Outlook

Daily Pivots: (S1) 1.1690; (P) 1.1726 (R1) 1.1783; More...

With 11.612 minor support intact, further rise is expected in EUR/USD at this point. Whole rise from 1.0339 low is still in progress and should target 1.2 handle next. Nonetheless, considering bearish divergence condition in 4 hour MACD, break of 1.1612 will indicate short term topping and bring lengthier consolidation first.

In the bigger picture, an important bottom was formed at 1.0339 on bullish convergence condition in weekly MACD. Sustained break of 55 month EMA (now at 1.1760) will pave the way to key fibonacci level at 38.2% retracement of 1.6039 (2008 high) to 1.0339 (2017 low) at 1.2516. While rise from 1.0339 is strong, there is no confirmation that it's developing into a long term up trend yet. Hence, we'll be cautious on strong resistance from 1.2516 to limit upside. But for now, medium term outlook will remain bullish as long as 1.1295 support holds, in case of pull back.

EUR/USD 4 Hours Chart

EUR/USD Daily Chart

Trade Idea: GBP/JPY – Stand aside

GBP/JPY - 145.10

Recent wave: Medium term low formed at 120.50 and (A)-(B)-(C) major correction has commenced with (A) leg ended at 148.45, hence wave (B) is unfolding for retreat to 131.00-10.

Trend: Near term up

New strategy :

Stand aside

Position: -
Target:  -
Stop:-

Sterling’s retreat after last week’s rise to 146.55 has retained our view that further consolidation would be seen and weakness to 144.80-85 cannot be ruled out, however, below support at 144.45-50 is needed to signal the rebound from 144.00-05 has ended, bring test of this level, break there would add credence to our view that a temporary top has been formed at 147.75 earlier this month, bring retracement of recent upmove to 143.50, then towards support at 143.30.

On the upside, above 145.80 would bring another test of said resistance at 146.55, break there would signal low has been formed at 144.05 and bring a stronger rebound to 146.90-00 and possibly towards 147.30. As near term outlook is still mixed, would be prudent to stand aside in the meantime.

Our preferred count is that larger degree wave V with circle is unfolding from 251.12 with wave (I) 219.34, (II): 241.38 and wave (III) is subdivided into 1: 192.60, 2: 215.89 (23 Jul 2008) and wave 3 ended at 118.87 earlier in 2009. The correction from there to 162.60 is wave 4 which itself is a double three and is labeled as first a-b-c ended at 151.53, followed by wave x at 139.03, 2nd a ended at 162.60, 2nd b at 146.75 and 2nd c leg of wave 4 ended at 163.00. Therefore, the decline from 163.00 to 116.85 is now treated as wave 5 which also marked the end of larger degree wave (III), hence wave (IV) major correction has commenced for retracement of the wave (III) from 241.38 and upside target at 183.95-00 (50% Fibonacci retracement of the wave (II) from 241.38) had been met, a drop below 160.00 would suggest wave (IV) has ended at 195.85, bring decline in wave (V) for initial weakness to 130 (already met) and 120.


GBP/USD Daily Outlook

Daily Pivots: (S1) 1.3077; (P) 1.3115; (R1) 1.3168; More...

No change in GBP/USD's outlook. Price actions from 1.1946 are seen as a corrective pattern. Considering bearish divergence condition in 4 hour MACD, we'd stay cautious on strong resistance from 61.8% projection of 1.2108 to 1.3047 from 1.2588 at 1.3168 to limit upside. Break of 1.2932 support will be the first sign of reversal and will turn bias to the downside to target 1.2588 key support next. Though, sustained break of 1.3168 will bring further rise towards 1.3444 before completing the correction.

In the bigger picture, overall, price actions from 1.1946 medium term low are seen as a corrective pattern that is still in progress. While further upside is expected, larger outlook remains bearish as long as 1.3444 key resistance holds. Down trend from 1.7190 (2014 high) is expected to resume later after the correction completes. And break of 1.2588 will indicate that such down trend is resuming.

GBP/USD 4 Hours Chart

GBP/USD Daily Chart

USD/CHF Daily Outlook

Daily Pivots: (S1) 0.9637; (P) 0.9682; (R1) 0.9730; More...

With 0.9633 minor support intact, intraday bias in USD/CHF remains on the upside for further rise. Prior break of 0.9699 resistance suggests near term reversal after defending 0.9443 key support. Further rally should be seen to 38.2% retracement of 1.0342 to 0.9437 at 0.9783 first. Break will target channel resistance (now at 0.9899). On the downside, below 0.9633 minor support will turn intraday bias neutral and bring consolidations first.

In the bigger picture, current development argues that USD/CHF has successfully defended 0.9443 key support level. And long term range trading in 0.9443/1.0342 is extending with another rise. At this point, there is no sign of an up trend yet. Hence, while further rise is expected in USD/CHF, we'll start to be cautious on loss of momentum above 61.8% retracement of 1.0342 to 0.9437 at 0.9996.

USD/CHF 4 Hours Chart

USD/CHF Daily Chart

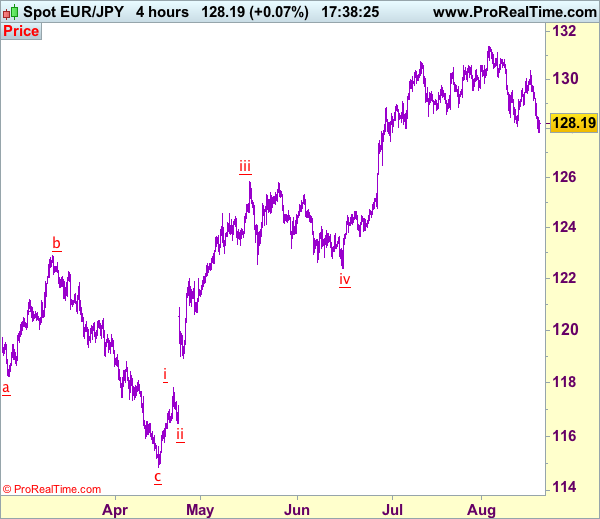
Trade Idea: EUR/JPY – Stand aside

EUR/JPY - 129.91

Recent wave: wave v of (C) ended at 94.12 and major correction in wave A has ended at 149.79

Trend: Near term up

New strategy :

Stand aside

Position: -
Target:  -
Stop:-

As the single currency has retreated after faltering below indicated resistance at 130.61 late last week, retaining our view that further consolidation below recent high at 130.77 would be seen and pullback to 129.45-50 is likely, however, reckon downside would be limited to 129.20-25 and 128.49-57 support should hold, bring another rise later.

On the upside, above 130.61 would bring retest of said resistance at 130.77 but break there is needed to confirm recent upmove has resumed and bring further gain to 131.00-10, above there would encourage for headway to 131.50, however, loss of upward momentum should prevent sharp move beyond latter level and reckon 132.00 would hold from here, risk from there is seen for a retreat later.

Our latest preferred count is that wave (ii) is ABC-X-ABC which ended at 123.33 and wave (iii) is unfolding with wave iii ended at 100.77, followed by wave iv at 111.57 and wave v as well as the wave (iii) has ended at 97.04, followed by wave (iv) at 111.43 and wave (v) has ended at 94.12 which is also the end of the larger degree v, this also implied the major wave (C) has also ended there, hence major correction has commenced from there with (A) leg unfolding in its lower degree wave c which has possibly ended at 145.69. Under this count, A-B-C wave (B) has commenced with A leg ended at 136.23, wave B at 143.79 and wave C has possibly ended at 149.79.

Our larger degree count is that the decline from 139.26 is wave (C) and is sub-divided into a diagonal triangle i-ii-iii-iv-v with wave i - 105.44, wave ii- 123.33, wave iii - 97.03, wave iv - 111.43, followed by the final wave v as well as the end of wave (C) at 94.12, this also mark the bottom of larger degree wave B. Under this count, major rise in wave C has commenced as an impulsive wave with minor wave III ended at 145.69, wave V is still in progress for further gain to 150.00. Having said that, this so-called wave V could well be the first leg of larger degree 5-waver wave C and this wave C should bring at least a retest of wave A top at 169.97 (July 2008).

EUR/USD Analysis: Trades Around 1.1731

Beginning of new trading week the currency rate started above multiple technical indicators, such as the 100% Fibonacci retracement level, the updated weekly PP and the 55-hour SMA at 1.1716. To certain extent, this is a result of announcement of the US Federal Funds Rate and Advance GDP last week. Due to the fact that the road downstairs is blocked by the above combined support level, the pair has no other choice that continue to climb towards the updated weekly R1 located at the 1.1815 level. Such scenario falls in line with the rising wedge theory, whose lower support line moves along the 55- and 100-hour SMAs. If the rate reaches the above resistance level, it might give an impulse strong enough to exit the existing formation and approach the bottom boundary of the channel.

GBP/USD Analysis: Tends To Reach Monthly R1

The currency exchange rate continues to gradually climb upstairs in a rising wedge pattern. More specifically, the first week of August the pair started in a limbo between the upper trend-line from the top and a combination of the 20- and 55-hour SMAs as well as the weekly PP from the bottom. In the upcoming hours this barrier should become additionally strengthened by the approaching 100-hour SMA. For this reason, the rate is expected not to fall below the 1.3095 level. Since there are also no important data releases today, the pair should continue to move towards the pattern's northern boundary. William's fractals suggest that the surge might be stopped already near the 1.3160 mark, which, in turn, would lead to formation of a short-term ascending triangle.