Sample Category Title
Brent Oil Should Hit New Lows
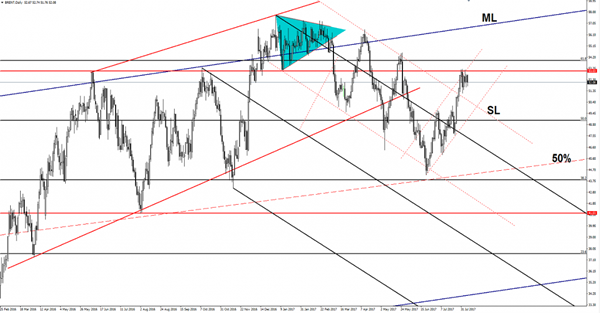
Brent is trading in the red after another failure to breakout above the 53.03 major static resistance. Is consolidating the latest gains, but he could decrease again in the upcoming days and could reach and retest the sliding line (SL) and the downside line of the minor ascending channel.
USD/CAD Breakout Underway
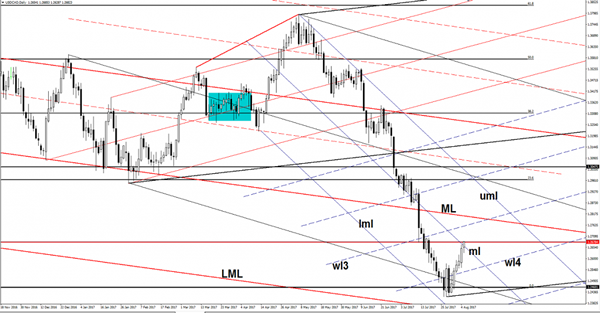
Price is trading in the green and looks motivated to take out the near term resistance levels. Has managed to jump above the median line (ml) of the minor descending pitchfork and now is pressuring the 1.2678 static support. A valid breakout above these levels will confirm a further increase in the upcoming days.
The next upside targets will be at the warning line (wl3) and higher at the median line (ML) of te major descending pitchfork. Could also be attracted by the upper median line (uml) of the minor descending pitchfork.
USD/JPY Can Buyers Take It Higher?
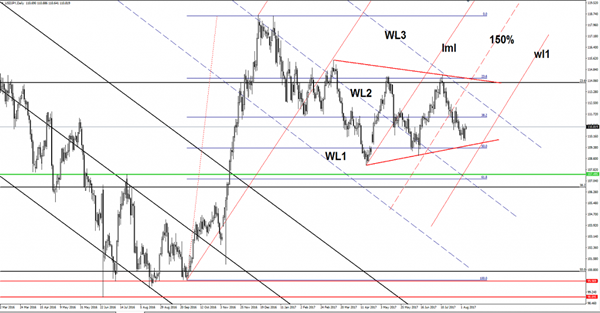
USD/JPY posted little gains today as the USDX and Nikkei have changed little as well. Price increased and is struggling to resume the Friday's bullish candle. Is located above the 110.80 level and is approaching the 111.04 Friday's high.
The Yen decreased as the Nikkei stock index is trading higher, the index retested the 20058 major static resistance today. JP225 continues to move sideways, is narrowing on the Daily chart, but I hope that we'll have a clear and significant move very soon.
Nikkei has developed a minor symmetrical triangle, but remains to see the breakout direction because a drop towards the 19700 level will force the Yen to dominate the currency market again. The Japanese Leading Indicators indicator was reported at 106.3%, higher versus the 106.02%, but less versus the 104.6% in the former reading period.
Price increased and could reach and retest the 38.2% retracement level in the upcoming days if the USDX and the Nikkei stock index will increase. Continues to move in range between the 23.6% and the 50% retracement level, is trapped within a symmetrical triangle, so we'll have a clear direction only after a valid breakout from the chart pattern.
USD/JPY failed to reach and retest the downside line of the symmetrical triangle, signaling that the bulls are sill in the game. A large rebound will be confirmed after a breakout above the WL3, while a broader drop under the warning line (wl1) of the minor ascending pitchfork.
Elliott Wave Analysis: USDCAD Intra-Day View
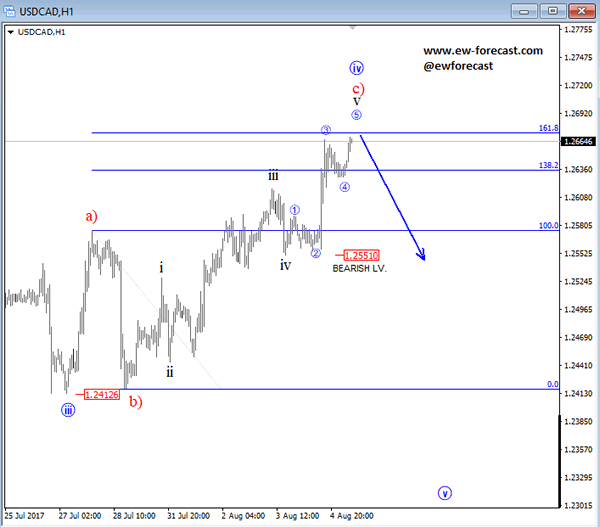
USDCAD is also seen in final stages of a corrective retracement, currently in subwave v of c), trading at 1.2660 resistance. A turn down from here in five waves back to 1.2510 will confirm a bearish turn for the pair. In fact, oil is also seen in a corrective set-back, so when uptrend will continue that’s when CAD may find buyers.
USDCAD, 1H
Resurgent Dollar Cooking Oil Basting Gold
A resurgent dollar post-Fridays not so bad data, weighs on oil and gold, even if only temporarily.
Friday's better than expected Non-Farm Payrolls, at 209,000 jobs added, wasn't a bad number, but it wasn't a king hit one other. The rally in the U.S dollar may well be just as much to do with short term positioning as it was with the data. We also note, that the hourly earnings were almost flat at 2.50% year on year and the participation rate remains anchored around 63.0%. Hardly earth shaking enough for the Federal Reserve to pull the inflation gun down of the wall and pull the trigger for a September hike.
Nonetheless, U.S. treasury yields moved higher and so did the dollar. It maintains my base case that it is the trajectory of U.S. rates that is the real story of 2017. In the short term though, there is no doubt that a stronger dollar is weighing on gold in particular and to a lesser extent oil even if it is only near term pain for bulls.
OPEC/Non-OPEC's technical committee is meeting quietly today and tomorrow in Abu Dhabi, and headlines from this may see some volatility in oil prices with compliance top of their agenda as well as bringing Nigeria and Libya “into the fold.”Traders appear to be content to await the API and EIA Crude Inventory numbers, tomorrow and Wednesday evening Asia time, for a sense of direction in what is generally, a very data light week for financial markets.
Brent
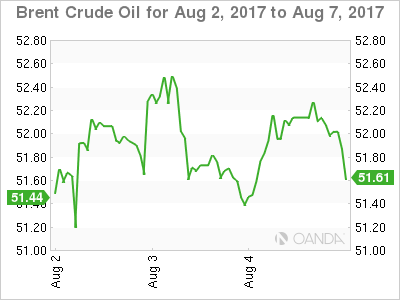
Brent spot opened unchanged at 52.15 with its triple top at 52.70 unchallenged thus far, and the must break level before we can talk about a new leg higher. Brent has drifted lower by around one percent in Asia, still some way away from the support that continues to be in the 50.45/65 zone. The zone contains its 50% Fibonacci retracement and the 100-day moving average.
WTI
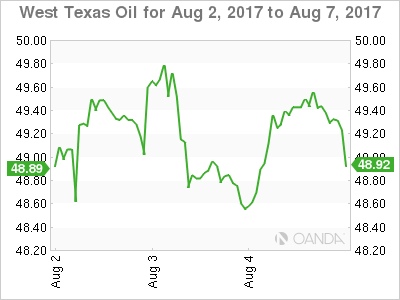
WTI spot opened unchanged at 49.40 in Asia and had drifted one percent lower to 48.80 over the session. With its double top resistance at 50.30 also unchallenged, support continues to be at 48.20, last week's low, and the 100-day moving average at 47.80.
Gold
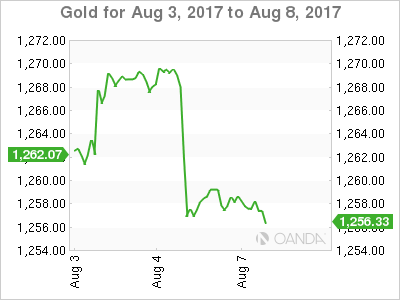
The strong non-farm payrolls data on Friday saw the U.S. dollar strengthen in general and this weighed on gold as the week drew to a close, falling 10 dollars to the 1258.50 area. Whether the dollar strength is temporary or more permanent has yet to be seen, and in a data light week unlikely to be answered anytime soon.
As a result, gold will be somewhat at the mercy of geopolitical headlines in the coming days and may also suffer if the recent dollar weakness continues to correct.
The price action on Friday left gold looking less than spectacular as we started the week's trading in Asia unchanged at 1258.50. It has drifted two dollars lower across the session to 1256.20, hovering above two keys supports. The 100-day average at 1252.85 and it's 50% Fibonacci retracement at 1249.25, the latter being a pivot level for price action of late.
Last week's resistance levels at 1274.20 and 1282.10 are now somewhat distant and unlikely to be challenged in the first half of the week at least.
Euro Steadies After Friday Slide
EUR/USD has ticked higher in the Monday session. Currently, the pair is trading at the 1.18 line, up 0.24% on the day. On the release front, German Industrial Orders disappointed with a decline of 1.1%, compared to the estimate of +0.2%. The Eurozone Sentix Investor Confidence slowed to 27.7, just shy of the forecast of 27.8 points. There are no major US releases on the schedule. On Tuesday, the US releases JOLTS Jobs Openings., which is expected to edge lower to 5.66 million.
The euro climbed above the 1.19 line on Thursday, its highest level since January 2015. However, the currency lost 1.2% on Friday, as a strong US nonfarm payrolls report boosted the US dollar. The markets had forecast a sharp slowdown of 182 thousand, but the reading of 209 thousand easily beat the estimate. The unemployment rate edged lower to 4.3%, but wage growth remains soft, and was unchanged at 0.3%.
The markets have grown accustomed to strong German numbers, so July's Industrial Production was a nasty surprise, posting a sharp decline of 1.1%. This marked the weakest reading this year. Still, German indicators continue to point to an expanding German economy. Retail Sales jumped 1.1%, its second-highest gain in 2017. Factory Orders gained 1.0%, while unemployment claims dropped 9 thousand – the employment indicator has declined every month in 2017, except one. Although manufacturing and services PMIs dipped in July, both are well over the 50-level, indicative of expansion. Are the strong German numbers too much of a good thing? Some analysts think so, and are cautioning that the German economy is in danger of overheating. The eurozone economy has also benefited from the robust German economy. Eurozone GDP gained 0.6% in the second quarter, up from 0.5% in the previous quarter. As well, Eurozone Retail Sales gained 0.5%, marking a 4-month high.
Brazil: Political Relief Prompts BRL Rally
Investors look more positively on the country as political uncertainty vanishes, improving BRL's prospects.
We update our BRL view, expecting USD/BRL to fall to 3.05 in 1M (3.20 previously), 3.00 in 3M (3.40 previously), 3.00 in 6M (3.60 previously) and 2.90 in 12M (3.80 previously).
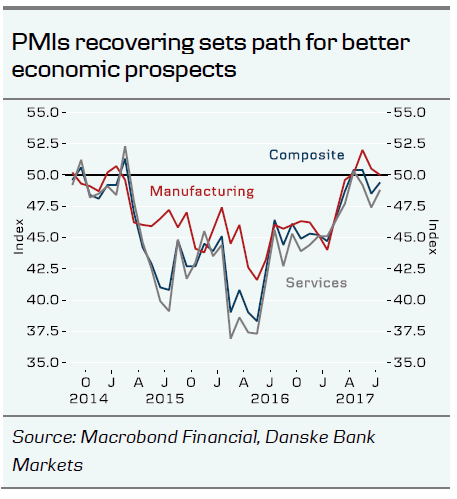
A major downside risk for our new USD/BRL forecasts is a promptly improving economy on higher commodity prices, while a more hawkish Fed is an upside risk.
Assessment and outlook
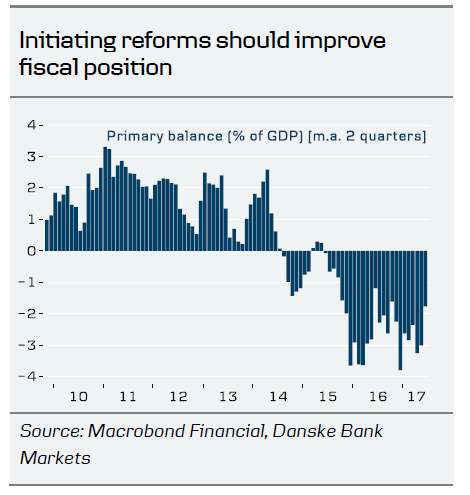
The positive news last week has improved sentiment towards the Brazilian economy. President Michel Temer has escaped the fate of his predecessor Dilma Rousseff. With 263 votes against 227, the lower house of parliament quashed the motion to put Temer on trial. Therefore, the pressure arising from the corruption scandal surrounding Temer appears to have eased, giving him more room for economic reforms, one of which is essential – the pension overhaul to improve the country's fiscal stability.
Vanishing political noise has pushed the BRL up 4% versus the US dollar within the past 30 days and improved sentiment should see portfolio inflows return. Due to the abrupt relief in political risk, we expect a near-term rally in the BRL and accordingly make sharp revisions to our short-term USD/BRL forecasts: 3.05 in 1M (3.20 previously) and 3.00 in 3M (3.40 previously). Yet, a stronger USD due to a more hawkish Fed is a clear upside risk for our short-term USD/BRL forecast.
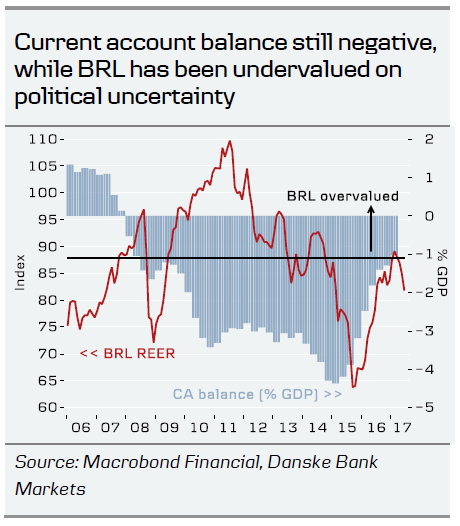
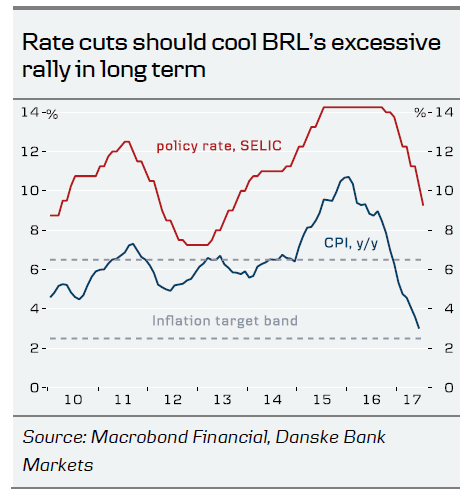
As the current account remains in deficit (albeit shrinking) and we expect the central bank to cut rates by 200bp in H2 17, we expect the BRL rally to come to a halt in the medium term, finding equilibrium in the long term at 3.00 in 6M (3.60 previously) and 2.90 in 12M (3.80 previously).
Foreign Exchange Market Commentary: EUR/USD, USD/JPY, GBP/USD, GOLD, WTI CRUDE, DJIA, FTSE100, DAX
EUR/USD
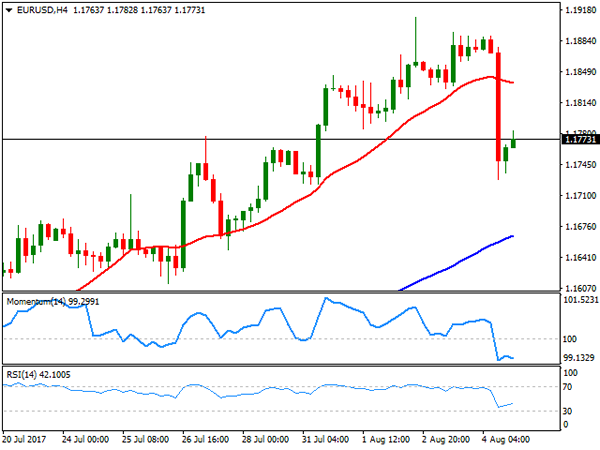
The American dollar saw a dramatic change of course on Friday, following the release of the US Nonfarm Payroll report, resulting in the EUR/USD pair trimming all of its weekly gains to end it flat around 1.1773. According to official figures, the US added 209,000 new jobs in July, beating expectations of around 180K, while June figure was revised higher by 2,000. The unemployment rate fell to 4.3% as expected, while average hourly earnings were up 2.5% on an annualized basis matching June's figure and above the expected 2.4%. Average hourly earnings rose by 0.3% when compared to the previous month, matching market's forecast.
Overall positive and supportive of Fed's tightening policy, the report was not as good as market's reaction suggests, particularly as wages' growth remains shallow, insufficient to push inflation higher. The data helped investors taking profits out of the table, as the EUR/USD pair rallied for four consecutive weeks reaching a fresh 2017 high of 1.1909. The corrective movement could extend, yet it still too early to describe the greenback as "bullish," as unless inflation clearly picks up, investors will be unwilling to buy the dollar, also dented by political jitters. The other factor of the equation is the latest EUR self-strength, backed by solid growth data and speculation that the ECB will make an announcement on tapering as soon as next September.
From a technical point of view, readings in the daily chart support a corrective movement, as technical indicators have turned sharply lower from extreme overbought levels, but remain far above their mid-lines, whilst the price remains above all of its moving averages that maintain their upward slopes. The 20 DMA is the closest, currently around 1.1660. In the 4 hours chart, the price broke below its 20 SMA, which is not flat in the 1.1860 region, while technical indicators pared their declines, but remain near, oversold readings. The key support for this Monday is 1.1715, 2015 high and the level to break to confirm a steeper decline over the next few sessions.
Support levels: 1.1750 1.1715 1.1680
Resistance levels: 1.1785 1.1820 1.1860
USD/JPY
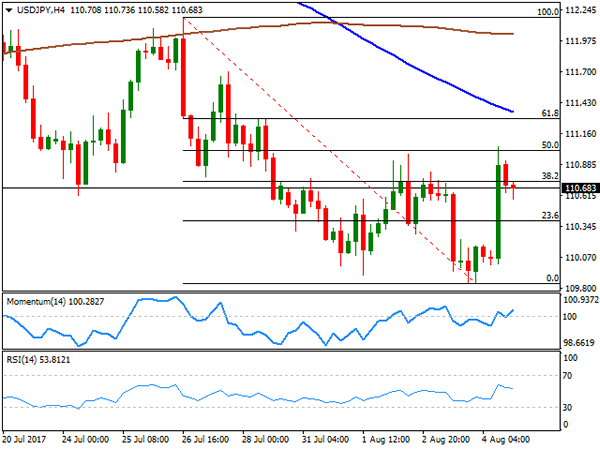
The USD/JPY pair ended the week at 110.68, barely 15 pips above Monday's opening, and after extending its recent decline down to 109.84, its lowest since mid June. On Friday, the pair surged up to 111.04, as an upbeat US employment report helped the greenback correcting higher after being under pressure for three consecutive weeks, with speculative interest using employment data as an excuse to take profits out before deciding what's next. The Japanese yen appreciated earlier in the week, as bond yields trended lower, holding near their yearly lows. The strong jobs' reported helped them bounce, but not enough to close the week in positive territory, therefore limiting yen´s losses. At the beginning of the week, Japan will release its preliminary June Coincident and Leading economic indexes, key measures of the current and future economic activity. From a technical perspective, the daily chart shows that the price settled below its 100 and 200 SMAs, whilst indicators bounced from oversold readings, but remain well into negative territory, limiting chances of further recoveries. Additionally, the 4 hours chart shows that the pair closed below the 38.2% retracement of its latest bearish run between 112.18 and the mentioned low at 110.70, retracing from the 50% retracement of the same decline around 111.05. In this last time frame, the 100 SMA maintains a strong bearish slope well above the level, while technical indicators hover around their mid-lines unable to provide directional clues.
Support levels: 110.35 109.85 109.50
Resistance levels: 110.70 111.05 111.40
GBP/USD
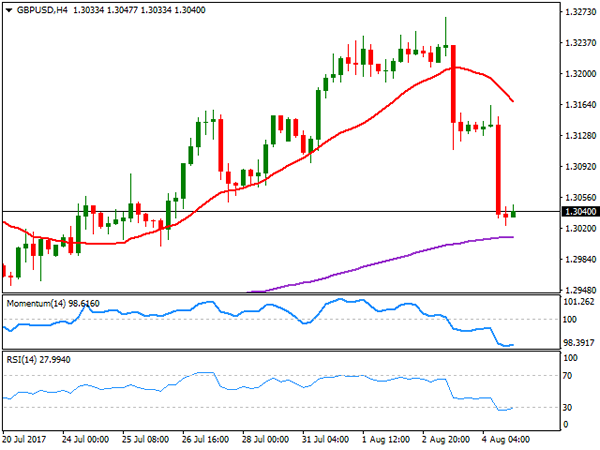
The British Pound was among the worst performers last week, taking a double hit, one from the BOE and the other by the better-than-expected US jobs report. The GBP/USD pair plunged for a second consecutive day to end at 1.3040, its lowest in almost two weeks. The Bank of England decided last Thursday to maintain its monetary policy unchanged, but policy makers estimate that they would need to raise rates two times over the next three years, up from previous forecast of one, but downgraded their growth estimates for this year and the next. The MPC also warned about the uncertainty surrounding Brexit, saying that it could increase inflationary pressures. However, the market took the statement as dovish, particularly as recent data showing sluggish grown and weak wage growth resulted in six out of the eight MPC members voting to keep their policy unchanged. The pair is close to a bearish breakout according to the daily chart, as it settled below its 20 DMA, while technical indicators turned south and are about to enter negative territory. The key is the 1.3000 threshold as a break below it will likely dent further investors' sentiment. In the 4 hours chart, the 20 SMA turned sharply lower above the current level, while technical indicators ended the week flat in oversold territory, with no signs of changing course. The 200 EMA in this last time frame stands around 1.3000, reinforcing the psychological support level.
Support levels: 1.3000 1.2965 1.2920
Resistance levels: 1.3070 1.3110 1.3150
GOLD
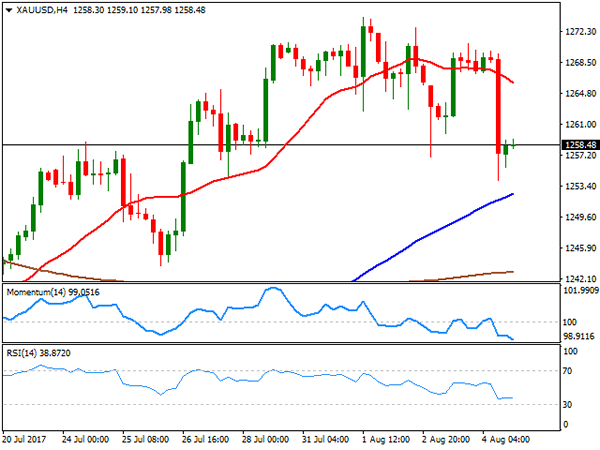
Gold prices plunged on Friday to close the week in the red, with spot settling at $1,258.49 a troy ounce, on a resurging dollar following the release of the US monthly employment report that supports Fed's case of normalization. The commodity retreated from a seven-week high of 1,274.04, and while the slide has been quite impressive on Friday, a bearish continuation is not yet clear, moreover considering that other US economic indicators released through the week signaled sluggish economic conditions at the beginning of the third quarter. Technically, the daily chart shows that the price held above its 100 DMA, now the immediate support around 1.254.10, while the 20 DMA maintains its bullish slope, not far below the largest. Indicators in the mentioned chart have turned sharply lower from overbought levels, but remain within positive territory, indicating that the downward move may extend on a break below the mentioned dynamic support. In the 4 hours chart, and for the short term, the risk turned towards the downside, as the price is currently developing below a strongly bearish 20 SMA, while the Momentum indicator heads south within negative territory and at fresh 1-month low, while the RSI indicator consolidates around 38.
Support levels: 1,254.10 1,245.20 1,235.20
Resistance levels: 1,265.30 1,274.05 1,283.30
WTI CRUDE OIL
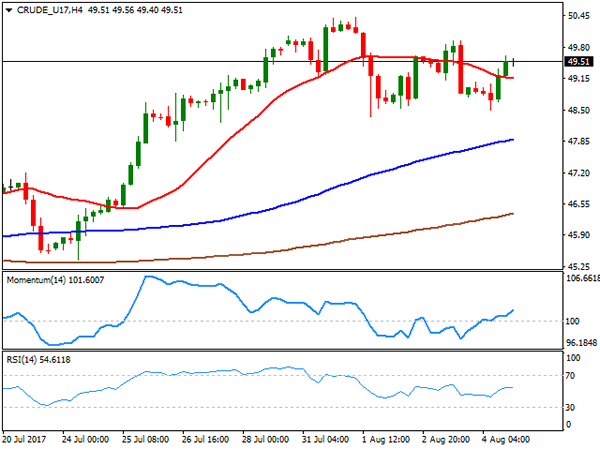
West Texas Intermediate crude futures closed the week marginally lower at $49.51 a barrel after failing to regain the 50.00 level earlier on the week .The commodity came under pressure earlier on the week on news that African OPEC's members rose their oil output during July, while the American Petroleum Institute reported an inventory build of 1.779 million barrels, well above an almost 3 million decline. The EIA report showed a smaller-than-expected draw of 1.5 million barrels. Friday's bounce was backed by the Baker Hughes report, as the number of active rigs drilling oil in the US fell by one to 765. In the daily chart, the upside is being contained by a horizontal 200 DMA, currently around 50.00, while the Momentum indicator retreated from oversold readings and heads lower within positive territory, but the RSI remains firm around 61, whist the 20 DMA advances above the 100 DMA below the current price, limiting the downside potential. In the 4 hours chart, the technical outlook is modestly bullish, as the price settled above a flat 20 SMA while the RSI indicator consolidates around 54, and the Momentum aims higher above its 100 level.
Support levels: 48.80 48.30 47.70
Resistance levels: 50.20 50.85 51.40
DJIA
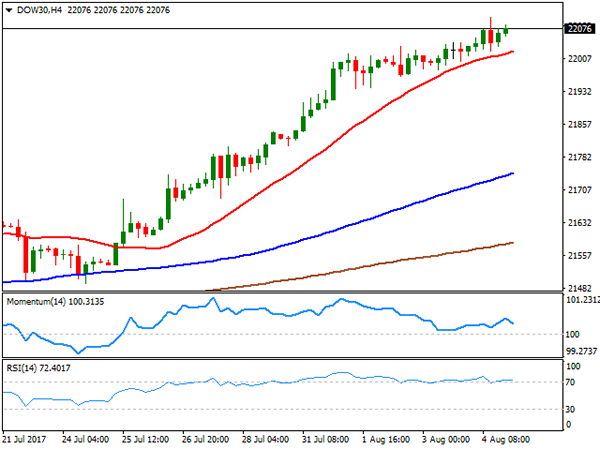
Wall Street closed in the green, with the Dow Jones Industrial Average posting its eighth consecutive record close, up 66 points to 22,092.81. The Nasdaq Composite gained 0.18% or 11 points to 6,351.56, while the S&P added 4 points to close at 2,476.83. Indexes were boosted by the solid employment report released on Friday, and despite escalating political tensions related to Russia's involvement in the US election. Financial-related equities led the way higher within the Dow, following their European counterparts, with Goldman Sachs up 2.59% being the best performer, followed by Home Depot that added 1.30% and JP Morgan that closed 1.25% higher. Walt Disney was the worst performer, down 1.31%, followed by Merck that shed 0.66%. From a technical point of view, the upside remains favored in the DJIA, as the index remains well above bullish moving averages, whilst technical indicators have barely decelerated their advance, still holding within extreme overbought territory. In the 4 hours chart, a bullish 20 SMA keeps providing short term support, currently at 22,023, the Momentum indicator heads south within positive territory, while the RSI indicator remains flat in overbought territory, reflecting the latest consolidation rather than suggesting upward exhaustion.
Support levels: 22,023 21,982 21,940
Resistance levels: 22,102 22,145 22,190
FTSE100
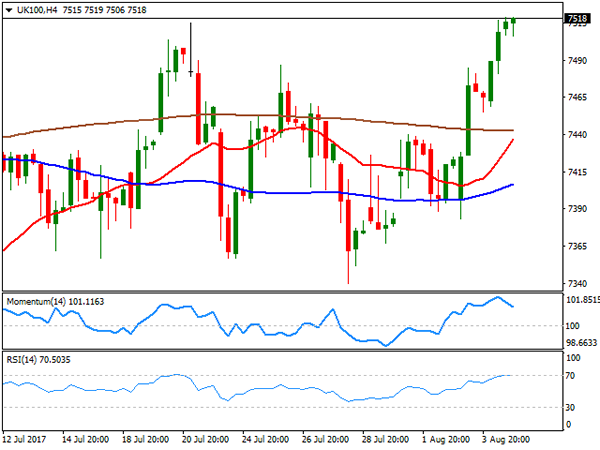
The FTSE 100 closed the week higher at 7,511.71, strongly up for a second consecutive day. The benchmark added 37 points on Friday as the Pound kept easing, although soften within mining and home builders' equities limited the advance. Barratt Developments was the worst performer, down 4.69%, followed by Persimmon that shed 3.98%. Randgold Resources led the way lower from commodity-linked equities shedding 1.87%. Leading the way higher was Merlin Entertainments up 5.75%, followed by Mediclinic that added 4.06%. The index settled at its highest for the week, and the daily chart supports additional gains ahead, as the index has finally detached from its 20 and 100 DMAs, with the shortest gaining upward traction, whilst technical indicators head north well above their mid-lines. In the 4 hours chart, technical indicators eased modestly within overbought territory, but the index remains well above all of its moving averages, in line with further gains ahead.
Support levels: 7,487 7,440 7,392
Resistance levels: 7,540 7,572 7,600
DAX
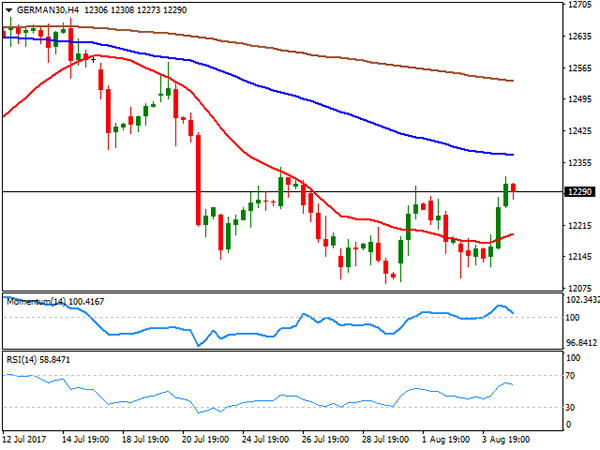
A weakening EUR underpinned European equities which closed firmly higher on the last trading day of the week. The German DAX added 114 points or 1.18%, to end at 12,297.70, boosted by an advance in financial and industrial-related equities. Macroeconomic news coming from Germany showed that in June, factory orders rose by more than expected, up by 1.0% in the month and by 5.1% from a year earlier, largely surpassing market's expectations. Within the DAX, only two members closed lower, Siemens that shed 0.71% and Merck that lost 0.47%. Leading advancers was E.ON, up 3.95%, followed by Commerzbank which added 3.53%. The index closed near its highest for the week, but in the daily chart, the upward potential remains limited, given that it stalled below a bearish 20 DMA that extended its slide below the 100 DMA, while technical indicators have managed to bounce from oversold levels, but remain within negative territory. In the 4 hours chart, the index settled above a modestly bullish 20 SMA, while technical indicators lost their upward strength and turned lower after entering positive territory, in line with the longer term perspective.
Support levels: 12,255 12,210 12,174
Resistance levels: 12,323 12,381 12,427
Friday U.S. Jobs Report Had A Strong Impact On Forex Pairs
Dollar Jumped From 15-mth Low On U.S. Jobs Report. The Dollar holds firm on Monday after a rally based on a strong U.S. jobs data that lifted it off 15-month lows. The dollar index climbed 0.75 percent on Friday. The data released on Friday showed that nonfarm payrolls increased by a bigger-than-forecast 209,000 jobs last month, while average hourly earnings increased 0.3 percent. Strong jobs data helped the dollar by giving a hope of the December interest rate increase by the Federal Reserve, meanwhile markets are still looking for the further evidence of robust fundamentals in order to firm up the dollar upturn.
This is going to be a crucial week for the U.S. currency. U.S PPI numbers for July will be released on Thursday and the CPI figures are due on Friday, they both may have to be better than expected to douse inflation concerns. Only then we will see if the dollar reached a real turning point.
Euro Consolidated After 0.8 Percent Loss On Friday. After the strong U.S. employment data released on Friday that pushed Euro down from its 2-1/2-year high of $1.1910 and made it losing over 100 pips, the pair EUR/USD went into a consolidation phase and is now trading at 1.1788.
Aussie Lost 0.7 Percent On Friday. The Australian dollar is recovering in a minor correction at $0.7931 after losing about 0.7 percent last week against the surged U.S. dollar.
GBP Is Flat After Sharp Slide At The End Of Last Week. Friday’s dollar surge deepened losses for sterling, which was already on the back foot after the Bank of England kept rates unchanged on Thursday and delivered a dovish message. It has slid sharply from a 13-month peak of $1.3267 set earlier last week.
CAD Notched Its Weakest Close In More Than 2-wks. After a strong U.S. jobs data and increase in Canada’s trade deficit on Friday, the Canadian dollar had its weakest close in more than two weeks against U.S. dollar. The Loonie fell 1.7 percent against the greenback last week, but is still up nearly 9 percent since early May.
Dollar Up Or Down?
Only two levels can tell you which way to go
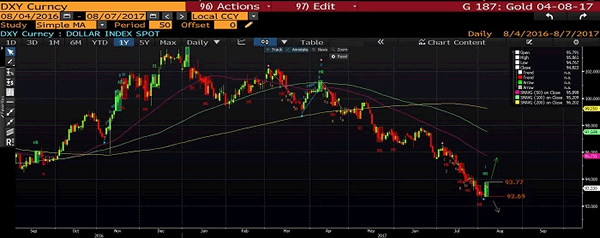
For the dollar index, the question is if we have a bottom in place after that sturdy reading of the US NFP. We know that we are way too oversold on the price curve and the price is bound to correct itself. To clear the noise and have a more logical discussion, we have used the candle session study and combined it with the simple price study.
A candle session study is a useful tool in determining the potential reversal which is established by comparing up or down candles to see where the potential session highs or lows are. The potential reversal tends to occur at the count of 8, 10 or 13. We can already see that the downtrend exhausted at the 10th count and now we have our first count which is giving us a signal that a new trend is emerging.
However, in order for us to have a clear indication of this, the two important levels matter a lot. The break of the 93.77 level would confirm that the trend is moving to the upside and the price would continue to correct itself. The break of 92.69 would imply there is still more steam left in this downtrend and we are still going to move lower.